. 2021 Apr;85(4):2016-2026.
doi: 10.1002/mrm.28570. Epub 2020 Nov 10.

Multi-shot acquisitions for stimulus-evoked spinal cord BOLD fMRI

Affiliations

Multi-shot acquisitions for stimulus-evoked spinal cord BOLD fMRI

Robert L Barry et al. Magn Reson Med. 2021 Apr.

Abstract

Purpose: To demonstrate the feasibility of 3D multi-shot magnetic resonance imaging acquisitions for stimulus-evoked blood oxygenation level dependent (BOLD) functional magnetic resonance imaging (fMRI) in the human spinal cord in vivo.

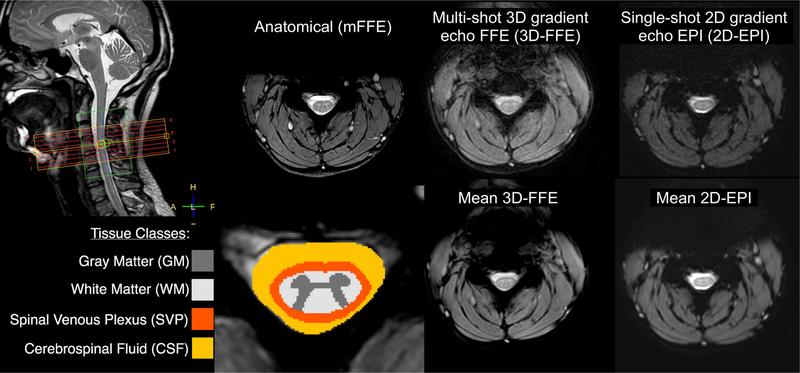
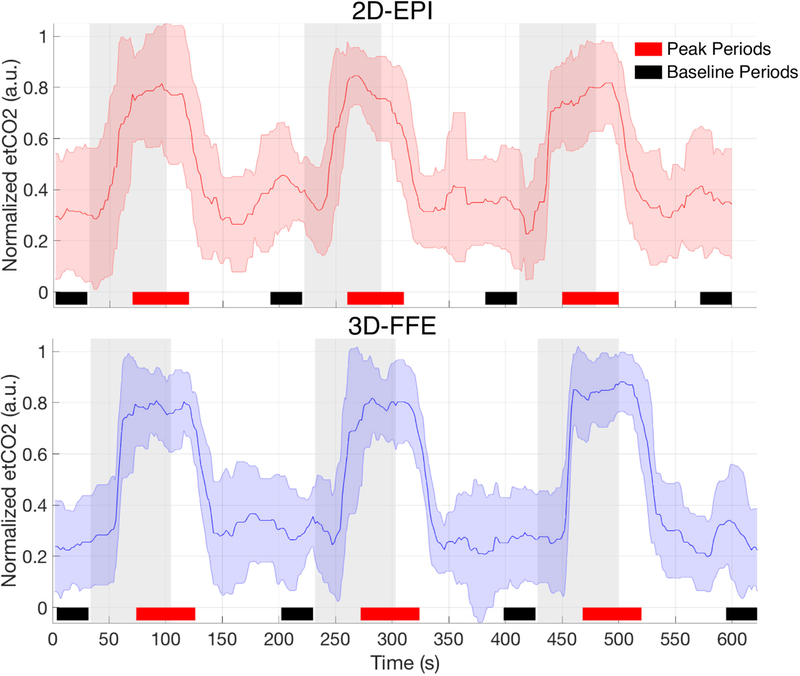
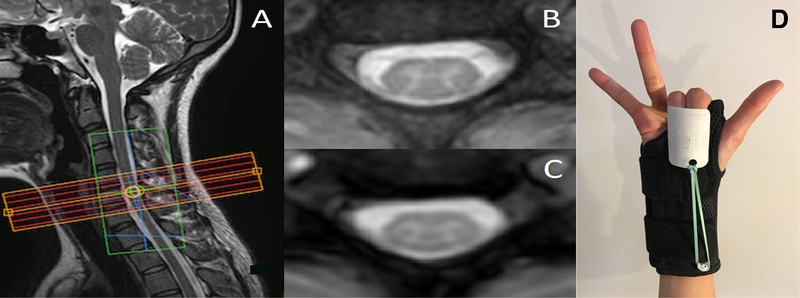
Methods: Two fMRI studies were performed at 3T. The first study was a hypercapnic gas challenge where data were acquired from healthy volunteers using a multi-shot 3D fast field echo (FFE) sequence as well as single-shot multi-slice echo-planar imaging (EPI). In the second study, another cohort of healthy volunteers performed an upper extremity motor task while fMRI data were acquired using a 3D multi-shot acquisition.

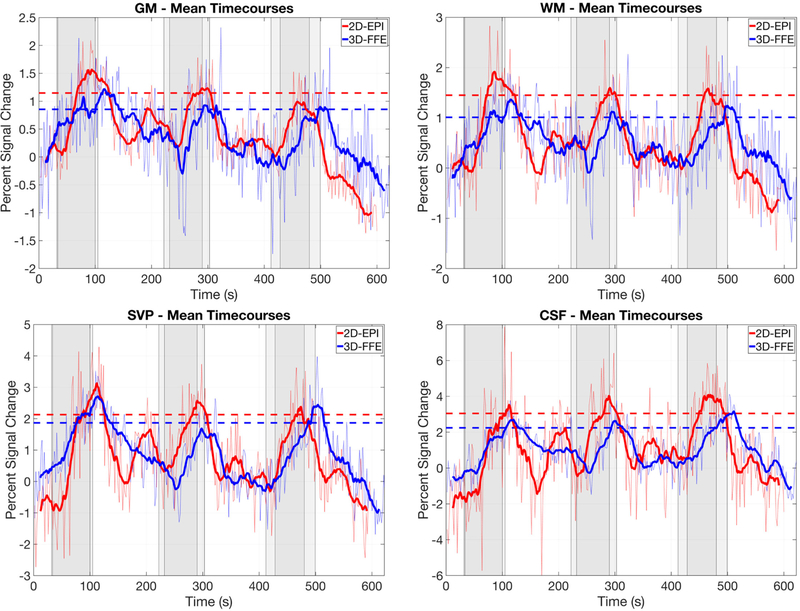
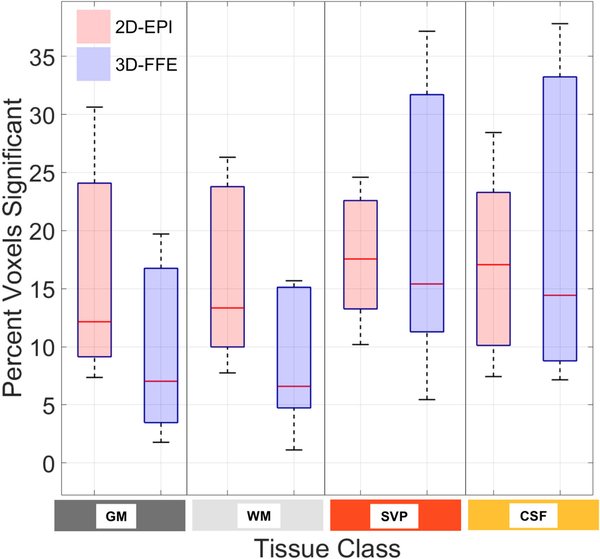
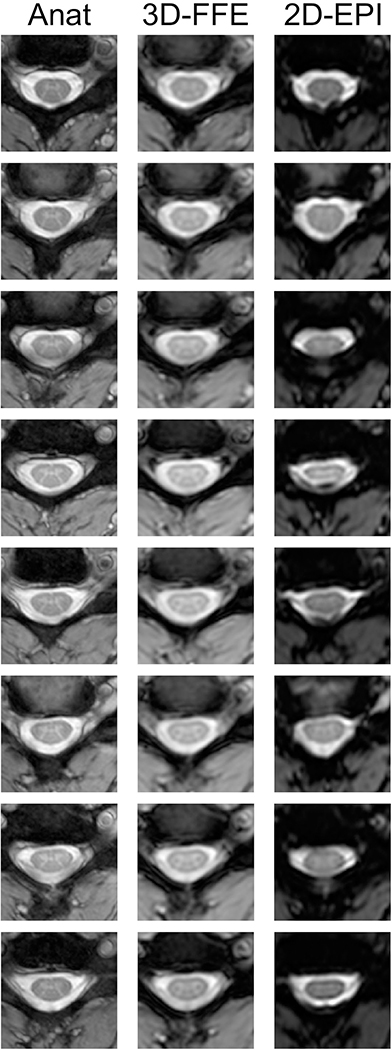
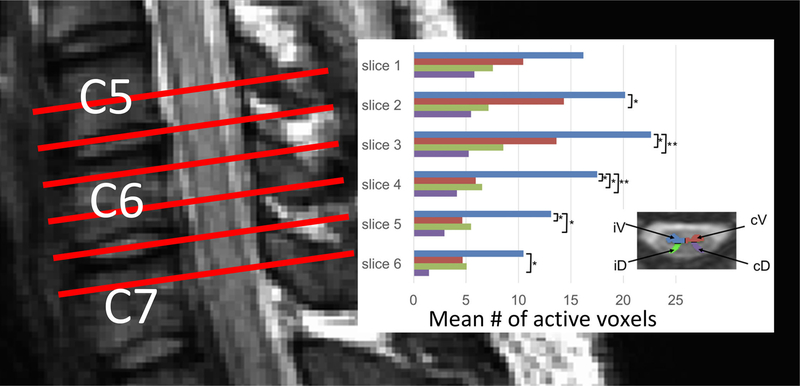
Results: Both 2D-EPI and 3D-FFE were shown to be sensitive to BOLD signal changes in the cervical spinal cord, and had comparable contrast-to-noise ratios in gray matter. FFE exhibited much less signal drop-out and weaker geometric distortions compared to EPI. In the motor paradigm study, the mean number of active voxels was highest in the ventral gray matter horns ipsilateral to the side of the task and at the spinal level associated with innervation of finger extensors.

Conclusions: Highly multi-shot acquisition sequences such as 3D-FFE are well suited for stimulus-evoked spinal cord BOLD fMRI.

Keywords: 3 Tesla; functional magnetic resonance imaging; gradient echo imaging; healthy controls; spinal cord; stimulus-evoked paradigms.


Conflict of interest statement

Conflict of Interest

The authors declare no competing interests.

Figures

Figure 1:
Figure 1:
Imaging stack placement (top left), tissue class definitions (bottom left), and anatomical/functional images for one subject in the hypercapnic gas challenge study. The green box overlaying the imaging stack is the region of interest selected for B0 shimming. Axial images show one slice at the center of the C4 vertebral body. The phase-encode direction is left-right in 3D-FFE and anterior-posterior in 2D-EPI. The 3D-FFE images show good gray/white matter contrast and minimal distortions. The 2D-EPI images also show acceptable contrast between gray and white matter, but have more pronounced distortions/artifacts within the cord and cerebrospinal fluid.
Figure 2:
Figure 2:
Mean end-tidal CO2 timecourse over all subjects/runs. Raw end-tidal CO2 traces were median filtered and artifactual spikes were removed prior to group averaging. The gas presentation paradigm for the 2D-EPI acquisition was: 30s rest – 70s gas – 120s rest – 70s gas – 120s rest – 70s gas – 120s rest = 600s total. Due to a discrepancy in the true volume acquisition time reported by the scanner console, the paradigm for the 3D-FFE sequence was extended slightly: 31.8s rest – 72.9s gas – 125.3s rest – 72.9s gas – 123.4s rest – 72.9s gas – 123.5s rest = 622.7s total. Room air was delivered during rest periods, and gray bars represent delivery periods of a hypercapnic normoxia gas mixture (5% CO2, 21% O2, 74% N2). Mean signals across baseline periods (denoted by black bars) were used for percent signal change calculations, and peak periods (denoted by red bars) were used for mean peak signal change lines in Fig. 4.
Figure 3:
Figure 3:
(A) Imaging stack placement for one subject in the motor paradigm study. The green box overlaying the imaging stack is the region of interest selected for B0 shimming. (B) Anatomical image for one axial slice and (C) the corresponding 3D-FFE functional image that has been interpolated to match the in-plane spatial resolution of the anatomical. (D) The splint provided automatic flexion after self-paced extensions of the index and middle fingers.
Figure 4:
Figure 4:
Mean percent BOLD signal change timecourses in response to the hypercapnic gas challenge for each tissue class (defined in Fig. 1, bottom left) and acquisition scheme (2D-EPI and 3D-FFE). Results are averaged across subjects. For each subject, the top half of all voxels for each tissue class, according to t-values from the GLM analyses, were used in the timecourse calculations. Dark lines on each plot represents a 20-point moving average of the raw mean timecourse. Dashed lines represent the mean signal change in the raw mean timecourse across the three peak periods (defined in Fig. 2). Sets of gray bars represent the gas delivery periods for each acquisition, with the onset of gas blocks for the FFE acquisition being delayed slightly due to a difference in timing (see Fig. 2 legend). The vertical axis in each plot is scaled according to the dynamic range of the data. It is important to note that while the spatial resolution is matched between these sequences, important differences in other acquisition parameters will influence the percent signal change and contrast-to-noise ratio: TE = 30 ms, TR = 2000 ms, flip angle = 70°, echo train length (ETL) = 75 for 2D-EPI; and TE = 10 ms, TR = 36.4 ms, flip angle = 8°, ETL = 7 for 3D-FFE. Complete details of the acquisition parameters are presented in the Methods.
Figure 5:
Figure 5:
Percentage of voxels, across subjects, exhibiting significant BOLD signal changes (p < 0.05, based upon a one-tailed test) in response to the hypercapnic gas challenge for each tissue class (defined in Fig. 1, bottom left) and acquisition scheme. For each subject, voxels with t > 1.65 (uncorrected) as determined from the GLM analysis are counted and expressed as a percent of the total number of voxels for each tissue class. There were no statistically significant differences between 2D-EPI and 3D-FFE across subjects (paired t-test, p > 0.05) despite different TEs for the two sequences.
Figure 6:
Figure 6:
Eight contiguous slices spanning C3 to C5 in one representative subject. The first column shows the high-resolution anatomical images, the second column shows the mean 3D-FFE functional images, and the third column shows the mean 2D-EPI functional images. Across slices and subjects, the 3D-FFE sequence produced functional images that are robust to geometric distortions and signal drop-out, and more closely resemble the anatomical images. The 2D-EPI images, however, show a range of distortions including stretch, shear, and compression, and significant signal drop-out in CSF and WM on some slices.
Figure 7:
Figure 7:
(left) Schematic illustrating imaging stack placement for the motor paradigm study. The slices are centered on vertebral level C6. (right) Mean number of active gray matter voxels (across subjects) for each slice where the colors correspond to the four regions of interest defined in the legend inset: ipsilateral ventral (iV), contralateral ventral (cV), ipsilateral dorsal (iD), and contralateral dorsal (cD). The iV horn exhibits more active voxels compared to other horns in the same slice (* = p < 0.05; ** = p < 0.01). The highest mean number of active voxels was observed in slice 3, which roughly corresponds to spinal cord segment C7 and innervation of finger extensors.

References

    1. Mansfield P Multi-planar image formation using NMR spin echoes. J Phys C Solid State Phys 10, L55–L58 (1977).
    1. Stehling MK, Turner R & Mansfield P Echo-planar imaging: magnetic resonance imaging in a fraction of a second. Science 254, 43–50 (1991). - PubMed
    1. Ordidge R The development of echo-planar imaging (EPI): 1977–1982. MAGMA 9, 117–121 (1999). - PubMed
    1. Cohen MS & Weisskoff RM Ultra-fast imaging. Magn Reson Imaging 9, 1–37 (1991). - PubMed
    1. Poustchi-Amin M, Mirowitz SA, Brown JJ, McKinstry RC & Li T Principles and applications of echo-planar imaging: a review for the general radiologist. Radiographics 21, 767–779 (2001). - PubMed

Publication types