Novel tau biomarkers phosphorylated at T181, T217 or T231 rise in the initial stages of the preclinical Alzheimer's continuum when only subtle changes in Aβ pathology are detected
- PMID: 33169916
- PMCID: PMC7721364
- DOI: 10.15252/emmm.202012921
Novel tau biomarkers phosphorylated at T181, T217 or T231 rise in the initial stages of the preclinical Alzheimer's continuum when only subtle changes in Aβ pathology are detected
Abstract
In Alzheimer's disease (AD), tau phosphorylation in the brain and its subsequent release into cerebrospinal fluid (CSF) and blood is a dynamic process that changes during disease evolution. The main aim of our study was to characterize the pattern of changes in phosphorylated tau (p-tau) in the preclinical stage of the Alzheimer's continuum. We measured three novel CSF p-tau biomarkers, phosphorylated at threonine-181 and threonine-217 with an N-terminal partner antibody and at threonine-231 with a mid-region partner antibody. These were compared with an automated mid-region p-tau181 assay (Elecsys) as the gold standard p-tau measure. We demonstrate that these novel p-tau biomarkers increase more prominently in preclinical Alzheimer, when only subtle changes of amyloid-β (Aβ) pathology are detected, and can accurately differentiate Aβ-positive from Aβ-negative cognitively unimpaired individuals. Moreover, we show that the novel plasma N-terminal p-tau181 biomarker is mildly but significantly increased in the preclinical stage. Our results support the idea that early changes in neuronal tau metabolism in preclinical Alzheimer, likely in response to Aβ exposure, can be detected with these novel p-tau assays.
Keywords: Alzheimer’s disease; biomarker; cerebrospinal fluid; plasma; tau.
© 2020 The Authors. Published under the terms of the CC BY 4.0 license.
Conflict of interest statement
JDG has given lectures in symposia sponsored by the following for‐profit companies: General Electric, Philips and Biogen. GK is a full‐time employee of Roche Diagnostics GmbH. ES is an employee and EVM is a co‐founder of ADx NeuroSciences. HZ has served at scientific advisory boards for Denali, Roche Diagnostics, Wave, Samumed and CogRx, has given lectures in symposia sponsored by Fujirebio, Alzecure and Biogen, and is a co‐founder of Brain Biomarker Solutions in Gothenburg AB (BBS), which is a part of the GU Ventures Incubator Program. KB has served as a consultant or at advisory boards for Abcam, Axon, Biogen, Lilly, MagQu, Novartis and Roche Diagnostics, and is a co‐founder of Brain Biomarker Solutions in Gothenburg AB, a GU Ventures‐based platform company at the University of Gothenburg. JLM has served/serves as a consultant or at advisory boards for the following for‐profit companies, or has given lectures in symposia sponsored by the following for‐profit companies: Roche Diagnostics, Genentech, Novartis, Lundbeck, Oryzon, Biogen, Lilly, Janssen, Green Valley, MSD, Eisai, Alector, BioCross, GE Healthcare, ProMIS Neurosciences. The remaining authors declare that they have no conflict of interest.
Figures


- A–E
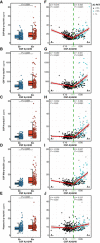
Scatter plots showing the association of each of the p‐tau biomarkers with age in the Aβ‐negative (A−; blue; n = 250) and the Aβ‐positive (A+; red; n = 131) groups. The solid lines indicate the regression line and the 95% confidence intervals for each of the groups. For each group, the standardized regression coefficients (β) and the P‐values were computed using a linear model adjusting for sex. Additionally, we computed the “Age × Aβ status” interaction term. Abbreviations: CSF, cerebrospinal fluid; Mid, mid‐region; N, N‐terminal; p‐tau, phosphorylated tau.
- A–E
Dot and box‐plot comparing each of the p‐tau biomarker between the Aβ‐negative (A−; blue; n = 250) and the Aβ‐positive (A+; red; n = 131) groups. Aβ positivity was defined as CSF Aβ42/40 ratio < 0.071. The box‐plots depict the median (horizontal bar), interquartile range (IQR, hinges) and 1.5 × IQR (whiskers). P‐values were assessed by a one‐way ANCOVA adjusted for age and sex.
- F–J
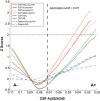
Scatter plots depicting the changes between each p‐tau biomarker as a function of CSF Aβ42/40. The horizontal axes directions were inverted; lower CSF Aβ42/40 ratio reflects higher Aβ pathology. For each Aβ status group, we computed the standardized regression coefficients (β) and the P‐values, adjusted for age and sex. The solid lines indicate the regression line and the 95% confidence intervals for each of the Aβ status groups. The dashed green lines indicate the CSF Aβ42/40 cut‐off. Participants were also colour‐coded based on the Aβ PET CL scale (≤ 12CL, black; > 12CL, turquoise; Aβ PET non‐available, grey).
- A–E
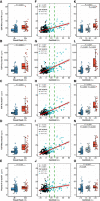
Dot and box‐plot comparing each of the p‐tau biomarker between the Aβ‐negative (A−; blue; n = 287) and the Aβ‐positive (A+; red; n = 42) groups. Aβ positivity was defined with Aβ PET visual read. The box‐plots depict the median (horizontal bar), interquartile range (IQR, hinges) and 1.5 × IQR (whiskers). P‐values were assessed by a one‐way ANCOVA adjusted by age and sex.
- F–J
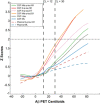
Scatter plots depicting the changes between each p‐tau biomarker as a function of Aβ PET Centiloids (CL). The standardized regression coefficients (β) and the P‐values were computed using a linear model adjusting for age and sex. The solid lines indicate the regression line and the 95% confidence intervals. The dashed green lines indicate the CL12 and CL30 cut‐offs. Participants were also colour‐coded based on the CSF Aβ42/40 ratio (A−, black; A+, turquoise).
- K–O
Dot and box‐plots depicting comparison between each of the p‐tau biomarker between Centiloid scale groups: (i) ≤ 12CL (blue; n = 278), (ii) 12–30CL (subthreshold Aβ pathology group; grey; n = 28), (iii) >30CL (red; n = 25). The box‐plots depict the median (horizontal bar), interquartile range (IQR, hinges) and 1.5 × IQR (whiskers). P‐values were assessed by a one‐way ANCOVA adjusted by age and sex, followed by a Bonferroni‐corrected post hoc pairwise comparison.
- A–C
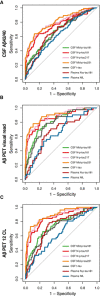
ROC analysis was performed to test the accuracy to discriminate between Aβ‐positive (A+) from Aβ‐negative (A−) individuals. Aβ positivity was defined as CSF Aβ42/40 < 0.071 (A), Aβ PET‐positive visual read (B) or Aβ PET Centiloid (CL) > 12 (C). Abbreviations: CSF, cerebrospinal fluid; Mid, mid‐region; NfL, neurofilament light; N, N‐terminal; p‐tau, phosphorylated tau; t‐tau, total tau.
- A–F
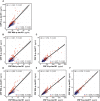
Scatter plots depicting the correlations between the CSF p‐tau biomarkers. We computed the Spearman's correlation coefficient (r s) and the P‐value for the whole cohort (n = 381) and for the A− (n = 250; blue dots) and A+ (n = 131; red dots) groups. The solid lines indicate the regression line and the 95% confidence intervals. Abbreviations: CSF, cerebrospinal fluid; Mid, mid‐region; N, N‐terminal; p‐tau, phosphorylated tau.


- A–D
Dot and box‐plot showing the levels of each p‐tau biomarker in each of the AT groups. Aβ‐positive (A+) was defined by a CSF Aβ42/40 < 0.071 and Tau‐positive (T+) by an Elecsys CSF Mid‐p‐tau181 > 24 pg/ml. The box‐plots depict the median (horizontal bar), interquartile range (IQR, hinges) and 1.5 × IQR (whiskers). The horizontal dashed line indicates the median of the p‐tau biomarker in the A−T− group. P‐values were assessed by a one‐way ANCOVA adjusted by age and sex followed by Bonferroni‐corrected post hoc pairwise comparisons. Abbreviations: CSF, cerebrospinal fluid; Mid, mid‐region; N, N‐terminal; p‐tau, phosphorylated tau.

- A–E
Scatter plots showing the association of each of the p‐tau biomarkers with CSF Neurofilament light (NfL) in the Aβ‐negative (A−; blue) and the Aβ‐positive (A+; red) groups. The solid lines indicate the regression line and the 95% confidence intervals for each of the groups. For each group, the standardized regression coefficients (β) and the P‐values were computed using a linear model adjusting for age and sex. We also computed the “CSF NfL × Aβ status” interaction term. Abbreviations: CSF, cerebrospinal fluid; Mid, mid‐region; N, N‐terminal; p‐tau, phosphorylated tau.
References
-
- Arai H, Ishiguro K, Ohno H, Moriyama M, Itoh N, Okamura N, Matsui T, Morikawa Y, Horikawa E, Kohno H et al (2000) CSF phosphorylated tau protein and mild cognitive impairment: a prospective study. Exp Neurol 166: 201–203 - PubMed
-
- Augustinack JC, Schneider A, Mandelkow E‐M, Hyman BT (2002) Specific tau phosphorylation sites correlate with severity of neuronal cytopathology in Alzheimer’s disease. Acta Neuropathol 103: 26–35 - PubMed
Publication types
MeSH terms
Substances
Grants and funding
- LCF/PR/GN17/50300004/"la Caixa" Foundation ("la Caixa")
- TriBEKa-17-519007/Alzheimer's Association (AA)
- 2017-SGR-892/Catalan Government
- 752310/EC | H2020 | H2020 Priority Excellent Science | H2020 Marie Skłodowska-Curie Actions (MSCA)
- A2020812F/BrightFocus Foundation (BFF)
- 681712/EC | H2020 | H2020 Priority Excellent Science | H2020 European Research Council (ERC)
- ALFGBG-720931/Swedish State Support for Clinical Research
- ALFGBG-715986/ALF-agreement
- JPND2019-466-236/EU Joint Programme - Neurodegenerative Disease Research (JPND)
- PI19/00155/MEC | Instituto de Salud Carlos III (ISCIII)
- CP II 17/00029/MEC | Instituto de Salud Carlos III (ISCIII)
- IJC2018-037478-I/Ministerio de Ciencia, Innovación y Universidades (MCIU)
- FJCI-2017-33437/Ministerio de Ciencia, Innovación y Universidades (MCIU)
- RYC2018-026053-I/Ministerio de Ciencia, Innovación y Universidades (MCIU)
- RYC-2013-13054/Ministerio de Economía y Competitividad (MEC)
- IEDI-2016-00690/Ministerio de Economía y Competitividad (MEC)
- 2018-02532/Svenska Forskningsrådet Formas
- 2017-00915/Svenska Forskningsrådet Formas
- AF-930627/Swedish Alzheimer Foundation
- AF-742881/Swedish Alzheimer Foundation
- 201809-2016862/Alzheimer's Drug Discovery Foundation (ADDF)
- RDAPB-201809-2016615/Alzheimer's Drug Discovery Foundation (ADDF)
- FO2017-0243/Hjärnfonden Sweden

