Meta-Analysis
. 2020 Nov 10:9:e61834.
doi: 10.7554/eLife.61834.

SpikeInterface, a unified framework for spike sorting

Affiliations
Meta-Analysis

SpikeInterface, a unified framework for spike sorting

Alessio P Buccino et al. Elife. .

Abstract

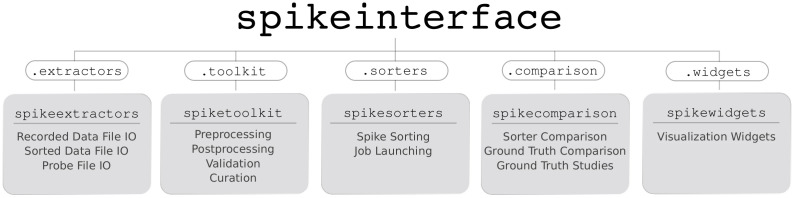
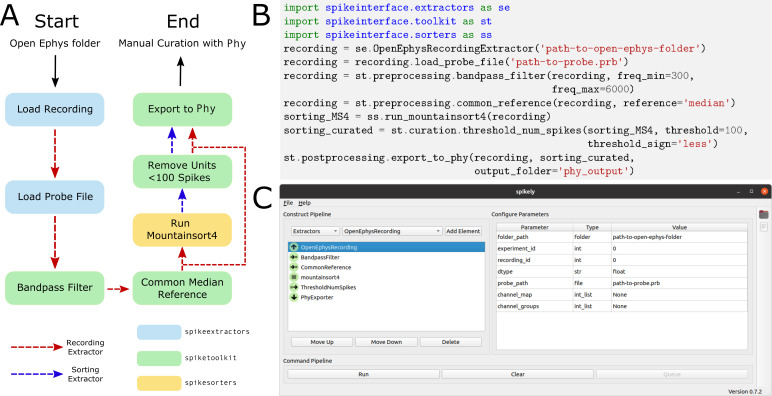
Much development has been directed toward improving the performance and automation of spike sorting. This continuous development, while essential, has contributed to an over-saturation of new, incompatible tools that hinders rigorous benchmarking and complicates reproducible analysis. To address these limitations, we developed SpikeInterface, a Python framework designed to unify preexisting spike sorting technologies into a single codebase and to facilitate straightforward comparison and adoption of different approaches. With a few lines of code, researchers can reproducibly run, compare, and benchmark most modern spike sorting algorithms; pre-process, post-process, and visualize extracellular datasets; validate, curate, and export sorting outputs; and more. In this paper, we provide an overview of SpikeInterface and, with applications to real and simulated datasets, demonstrate how it can be utilized to reduce the burden of manual curation and to more comprehensively benchmark automated spike sorters.

Keywords: extracellular recordings; mouse; neuroscience; open-source software; python; rat; reproducibility; spike sorting.


Conflict of interest statement

AB, CH, SG, JM, JS, RH, MH No competing interests declared

Figures

Figure 1.
Figure 1.. Comparison of spike sorters on a real Neuropixels dataset.
(A) A visualization of the activity on the Neuropixels array (top, color indicates spike rate estimated on each channel evaluated with threshold detection) and of traces from the Neuropixels recording (below). (B) The number of detected units for each of the six spike sorters (HS = HerdingSpikes2, KS = Kilosort2, IC = IronClust, TDC = Tridesclous, SC = SpyKING Circus, HDS = HDSort). (C) The total number of units for which k sorters agree (unit agreement is defined as 50% spike match). (D) The number of units (per sorter) for which k sorters agree; most sorters find many units that other sorters do not.
Figure 1—figure supplement 1.
Figure 1—figure supplement 1.. Examples of matched units in a Neuropixels recording.
The illustration shows units from six spike sorters that were matched by spike train comparison. Panel (A) shows a unit with high agreement score (0.97), and panel (B) a lower agreement score (0.69). In both panels, the top plot shows the spike trains (the first 20 s of the recording) found by each sorter, and below unit templates (estimated from waveforms of 100 spikes randomly sampled from each unit) are shown.
Figure 1—figure supplement 2.
Figure 1—figure supplement 2.. Cumulative histogram of agreement scores (above threshold of .5 that defines a match) for the ensemble sorting of the simulated ground-truth dataset.
This analysis was performed with the six chosen sorters and highlights how over 80% of the matched units had an agreement score greater than 0.8.
Figure 1—figure supplement 3.
Figure 1—figure supplement 3.. Comparison of spike sorters on a Neuropixels recording.
This dataset contains spontaneous neural activity from the rat cortex (motor and somatosensory areas) by Marques-Smith et al., 2018a; Marques-Smith et al., 2018b (dataset spe-c1). The dataset is also available at https://gui.dandiarchive.org/#/dandiset/000034/draft. (A) A visualization of the activity on the Neuropixels array (top, color indicates spike rate estimated on each channel evaluated with threshold detection) and of traces from the Neuropixels recording (below). (B) The number of detected units for each of the six spike sorters (HS = HerdingSpikes2, KS = Kilosort2, IC = IronClust, TDC = Tridesclous, SC = SpyKING Circus, HDS = HDSort). (C) The total number of units for which k sorters agree (unit agreement is defined as 50% spike match). (D) The number of units (per sorter) for which k sorters agree; Most sorters find many units that other sorters do not. The analysis notebook for this analysis can be found at https://spikeinterface.github.io/blog/ensemble-sorting-of-a-neuropixels-recording-2/.
Figure 1—figure supplement 4.
Figure 1—figure supplement 4.. Comparison of spike sorters on a Biocam recording from a mouse retina.
This retina recording (Hilgen et al., 2017) has 1’024 channels in a square configuration, and a sampling frequency of 23199 Hz. The dataset can be found at https://gui.dandiarchive.org/#/dandiset/000034/draft. Only four spike sorters were capable of processing this data set (HS = HerdingSpikes2, KS = Kilosort2, IC = IronClust, HDS = HDSort). (A) A visualization of the activity on the Biocam array (top, color indicates spike rate estimated on each channel evaluated with threshold detection) and of traces from the recording (below). (B) The number of detected units for each of the four spike sorters. (C) The total number of units for which k sorters agree (unit agreement is defined as 50% spike match). (D) The number of units (per sorter) for which k sorters agree; most sorters find many units that other sorters do not. The analysis notebook for this analysis can be found at https://spikeinterface.github.io/blog/ensemble-sorting-of-a-3brain-biocam-recording-from-a-retina/.
Figure 2.
Figure 2.. Evaluation of spike sorters on a simulated Neuropixels dataset.
(A) A visualization of the activity on and traces from the simulated Neuropixels recording. (B) The signal-to-noise ratios (SNR) for the ground-truth units. (C) The number of detected units for each of the six spike sorters (HS = HerdingSpikes2, KS = Kilosort2, IC = IronClust, TDC = Tridesclous, SC = SpyKING Circus, HDS = HDSort). (D) The accuracy, precision, and recall of each sorter on the ground-truth units. (E) A breakdown of the detected units for each sorter (precise definitions of each unit type can be found in the SpikeComparison Section of the Methods). The horizontal dashed line indicates the number of ground-truth units (250).
Figure 2—figure supplement 1.
Figure 2—figure supplement 1.. Evaluation of spike sorters performance metrics.
(A) Precision versus recall for the ground-truth comparison the simulated dataset. Some sorters seem to favor precision (HerdingSpikes, SpyKING Circus, HDSort), others instead have higher recall (Ironclust) or score well on both measures (Kilosort2). Tridesclous does not show a bias towards precision or recall. (B) Accuracy versus SNR. All the spike sorters (except Kilosort2) show a strong dependence of performance with respect to the SNR of the ground-truth units. Kilosort2, remarkably, is capable of achieving a high accuracy also for low-SNR units.
Figure 3.
Figure 3.. Comparison of spike sorters on a simulated Neuropixels dataset.
(A) The total number of units for which k sorters agree (unit agreement is defined as 50% spike match). (B) The number of units (per sorter) for which k sorters agree; Most sorters find many units that other sorters do not. (HS = HerdingSpikes2, KS = Kilosort2, IC = IronClust, TDC = Tridesclous, SC = SpyKING Circus, HDS = HDSort) (C) Number of matched ground-truth units (blue) and false positive units (red) found by each sorter on which k sorters agree upon. Most of the false positive units are only found by a single sorter. Number of false positive units found by k2 sorters: HS = 4, KS = 4, IC = 4, SC = 2, TDC = 1, HDS = 2. (D) Signal-to-noise ratio (SNR) of ground-truth unit with respect to the number of k sorters agreement. Results are split by sorter.
Figure 3—figure supplement 1.
Figure 3—figure supplement 1.. The fractions of predicted false and true positive units from ensembles using different numbers of sorters.
All possible subsets of two to five of the six sorters were tested by removing corresponding units from the full sorting comparison. Each dot corresponds to one unique combination of sorters. This analysis shows that false positive units are well-identified using pairs of sorters (almost all false positive units are only found by one sorter), indicating that the sorters are biased in different ways. However, the fraction of true positives in the ensemble (at least two sorters agree) can be significantly lower when only pairs of sorters are used. This is explained by the fact that, for this dataset, a fraction of true positive units are only found by one sorter (as expected since the quality of detection and isolation of the units varies among sorters). In contrast, using four or more sorters reliably identifies most true positive units. For two sorters, the most reliable identification of true positives was achieved by combining two of Kilosort2, Ironclust, and HDSort.
Figure 3—figure supplement 2.
Figure 3—figure supplement 2.. The SNR of all units found by Kilosort2 in the ground-truth data separated into those with and without matches in the ground-truth spike trains.
Many detected false positive units have an SNR above the mode of the ground-truth SNR, indicating that SNR is not a good measure to separate false and true positives in this case.
Figure 4.
Figure 4.. Comparison between consensus and manually curated outputs.
(A) Venn diagram showing the agreement between Curator 1 and 2. 174 units are discarded by both curators from the Kilsort2 output. (B) Percent of matched units between the output of each sorter and C1 (red) and C2 (blue). Ironclust has the highest match with both curated datasets. (C) Similar to C, but using the consensus units (units agreed upon by at least two sorters - k2). The percent of matching with curated datasets is now above 70% for all sorters, with Kilosort2 having the highest match (KSc ∩C1 = 84.55%, KSc∩C2 = 89.55%), slightly higher than Ironclust (ICc ∩ C1 = 82.63%, ICc ∩ C2 = 83.83%). (D) Percent of non-consensus units (k=1) matched to curated datasets. The only significant overlap is between Curator one and Kilosort2, with a percent around 18% (KSnc ∩ C1 = 18.58%, KSnc ∩ C2 = 24.34%).
Figure 5.
Figure 5.. Overview of SpikeInterface’s Python packages, their different functionalities, and how they can be accessed by our meta-package, spikeinterface.
Figure 6.
Figure 6.. Sample spike sorting pipeline using SpikeInterface.
(A) A diagram of a sample spike sorting pipeline. Each processing step is colored to represent the SpikeInterface package in which it is implemented and the dashed, colored arrows demonstrate how the Extractors are used in each processing step. (B) How to use the Python API to build the pipeline shown in (A). (C) How to use the GUI to build the pipeline shown in (A).
Author response image 1.
Author response image 1.. Comparison of five individual runs of Kilosort2 on the simulated Neuropixels recording.
The top shows the proportions of units from each sorting found in k other sortings. Below these units are split according to false and true positive units after comparison to the ground-truth data. While a sizable fraction of false positive units are unique to each run of the sorter, many are identical in all sortings, indicating that variability in multiple sorter outputs cannot be used to reliably separate false and true positive units.

References

    1. Allen Institute for Brain Science 2019. Allen Brain Observatory Neuropixels. Allen Brain Map. 766640955
    1. Angotzi GN, Boi F, Lecomte A, Miele E, Malerba M, Zucca S, Casile A, Berdondini L. SiNAPS: an implantable active pixel sensor CMOS-probe for simultaneous large-scale neural recordings. Biosensors and Bioelectronics. 2019;126:355–364. doi: 10.1016/j.bios.2018.10.032. - DOI - PubMed
    1. Ballini M, Müller J, Livi P, Chen Y, Frey U, Stettler A, Shadmani A, Viswam V, Jones IL, Jäckel D, Radivojevic M, Lewandowska MK, Gong W, Fiscella M, Bakkum DJ, Heer F, Hierlemann A. A 1024-Channel CMOS microelectrode array with 26,400 electrodes for recording and stimulation of electrogenic cells in vitro. IEEE Journal of Solid-State Circuits. 2014;49:2705–2719. doi: 10.1109/JSSC.2014.2359219. - DOI - PMC - PubMed
    1. Barnett AH, Magland JF, Greengard LF. Validation of neural spike sorting algorithms without ground-truth information. Journal of Neuroscience Methods. 2016;264:65–77. doi: 10.1016/j.jneumeth.2016.02.022. - DOI - PubMed
    1. Berdondini L, van der Wal PD, Guenat O, de Rooij NF, Koudelka-Hep M, Seitz P, Kaufmann R, Metzler P, Blanc N, Rohr S. High-density electrode array for imaging in vitro electrophysiological activity. Biosensors and Bioelectronics. 2005;21:167–174. doi: 10.1016/j.bios.2004.08.011. - DOI - PubMed

Publication types