. 2021 Jan 4;131(1):e134565.
doi: 10.1172/JCI134565.

Deubiquitinase USP7 contributes to the pathogenicity of spinal and bulbar muscular atrophy

Affiliations

Deubiquitinase USP7 contributes to the pathogenicity of spinal and bulbar muscular atrophy

Anna Pluciennik et al. J Clin Invest. .

Abstract

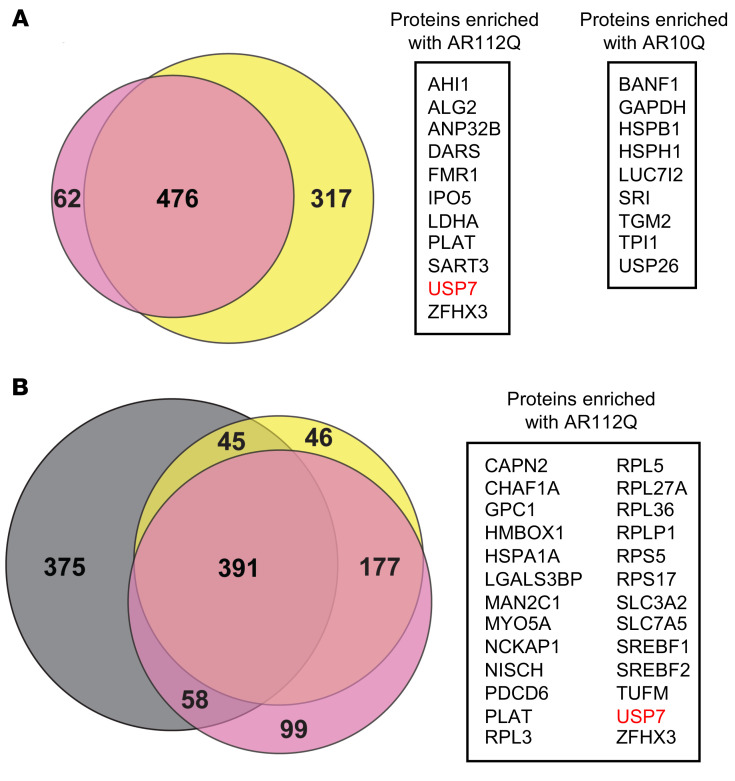
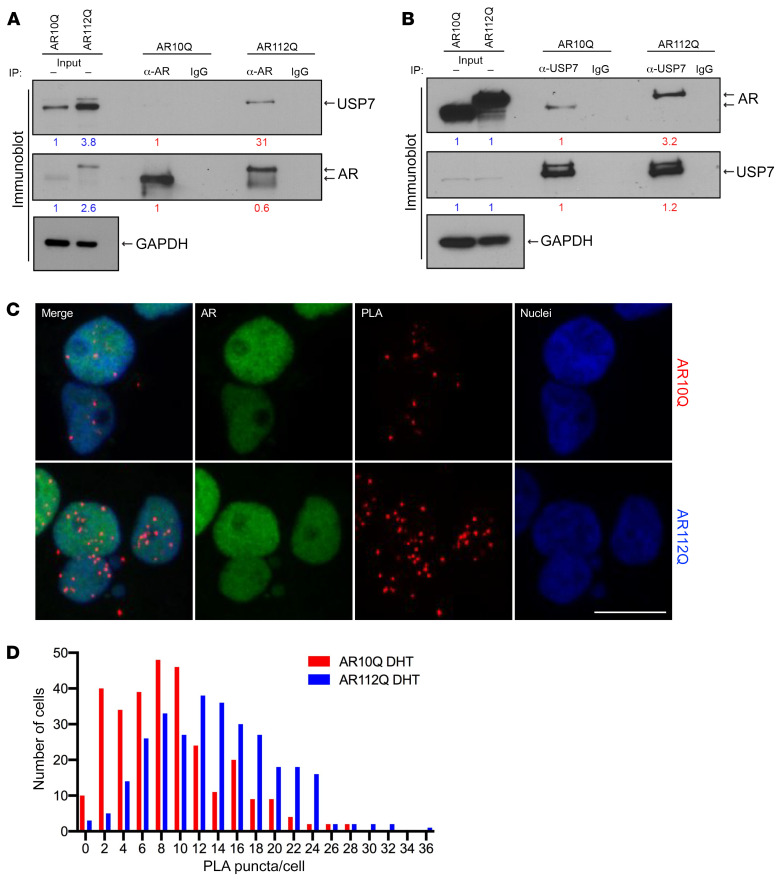
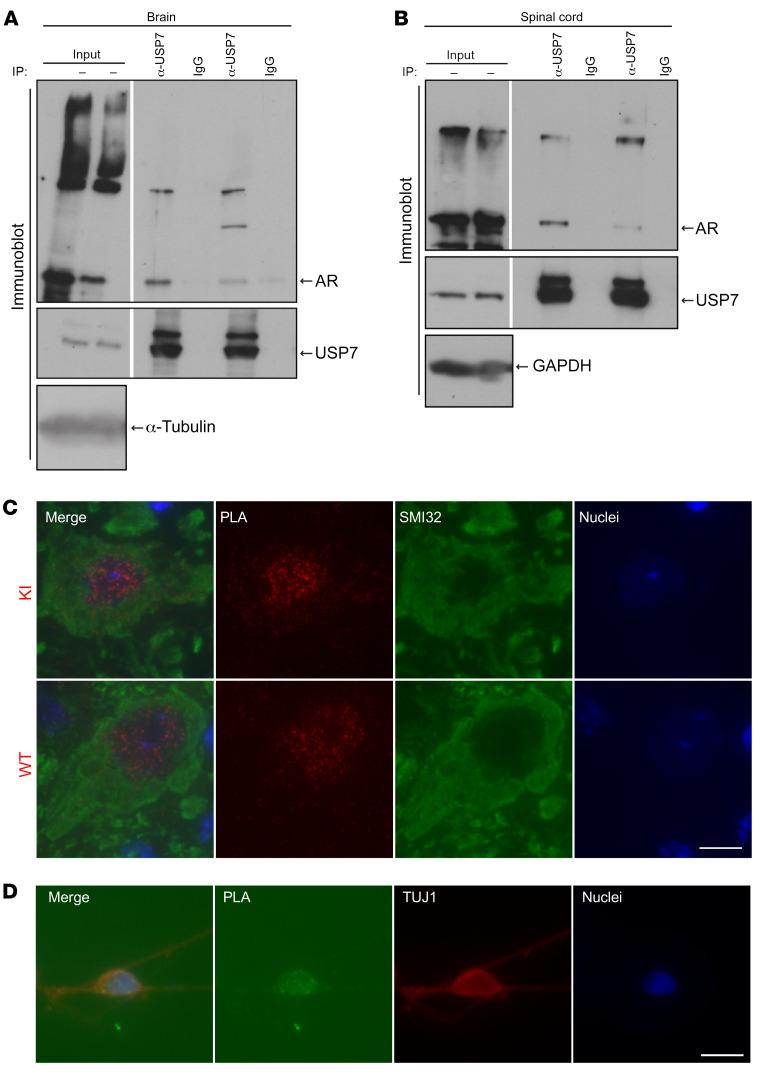
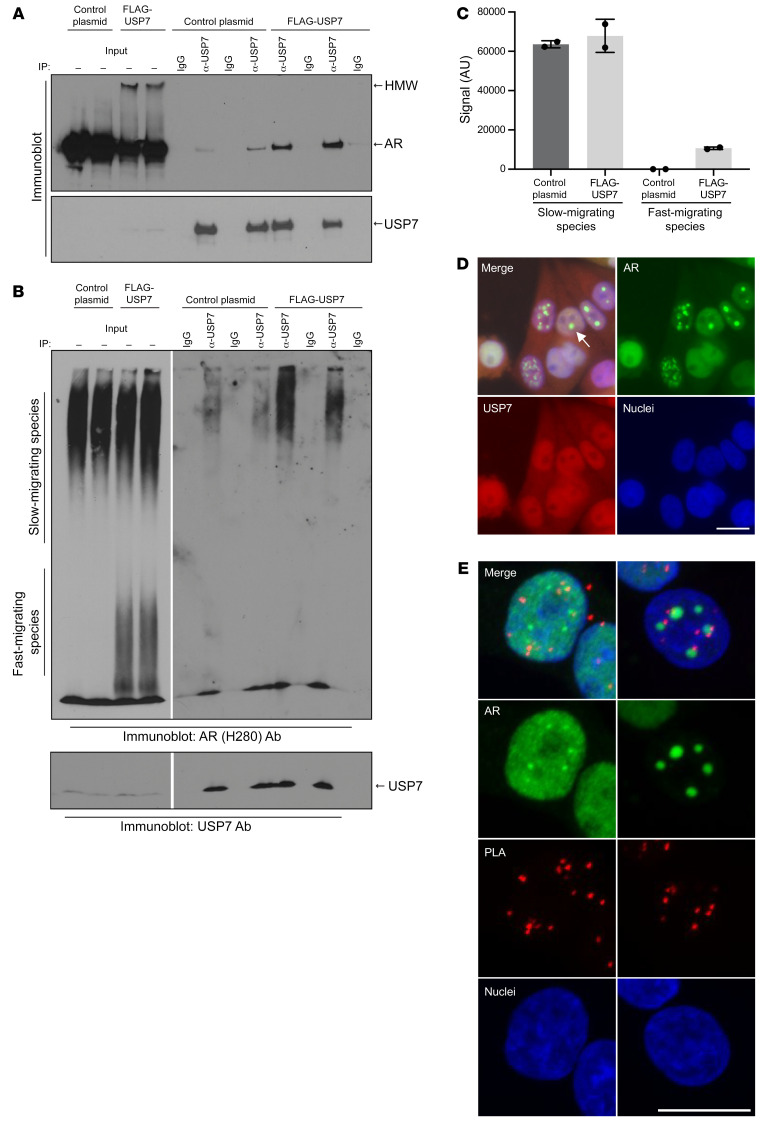
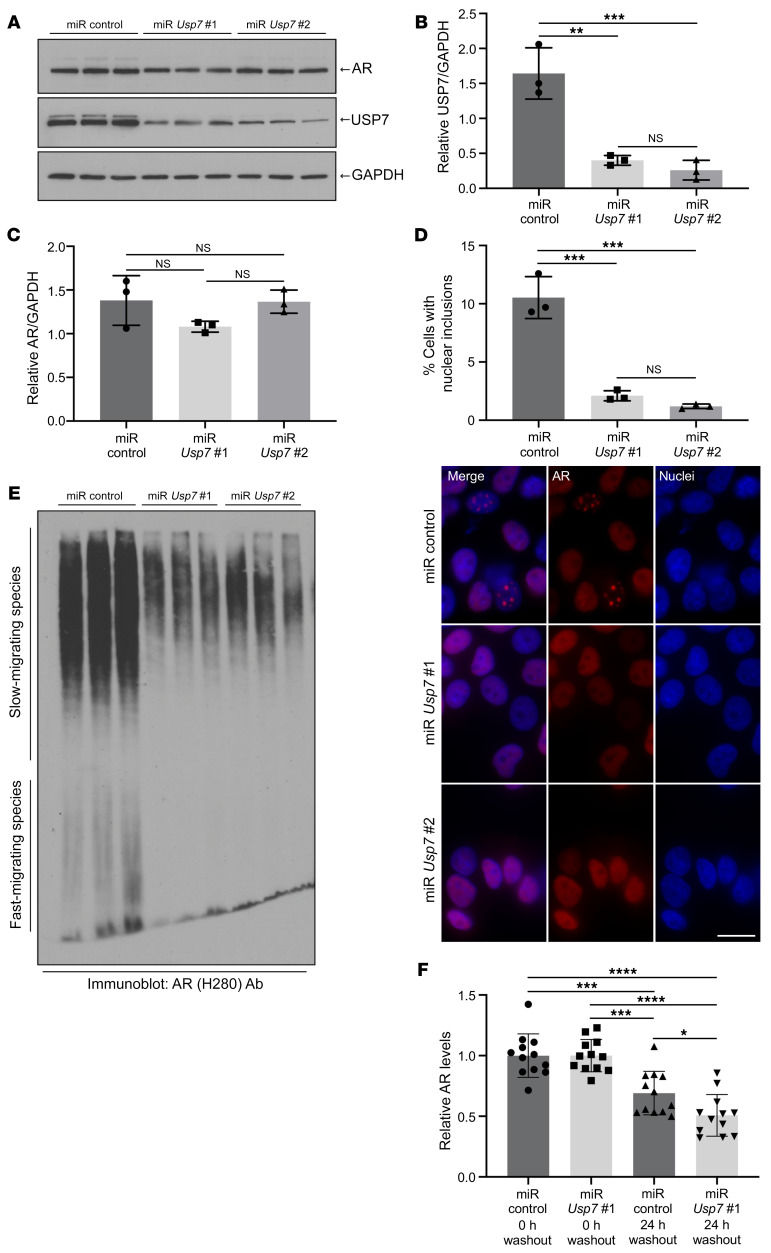
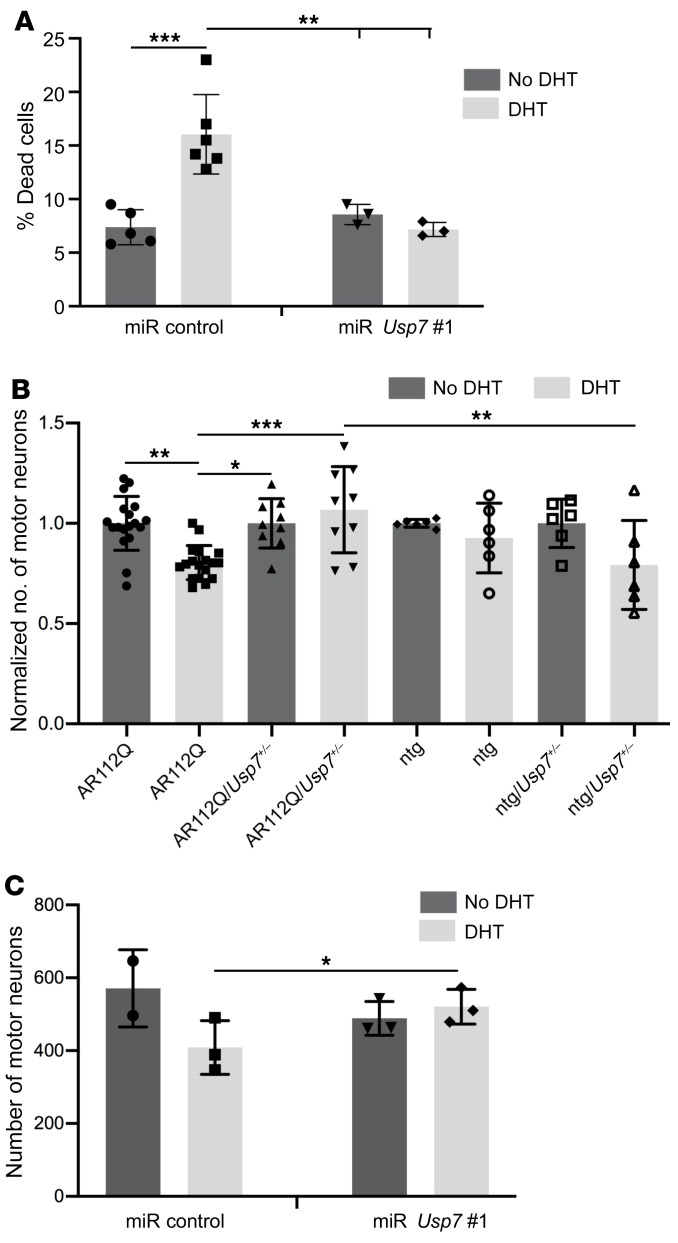
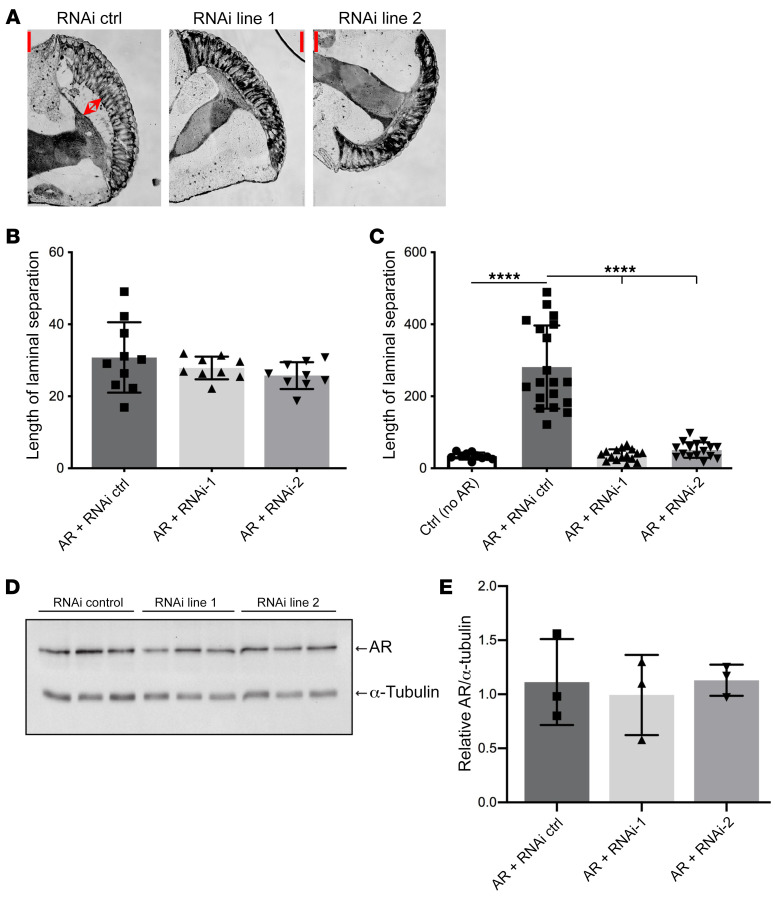
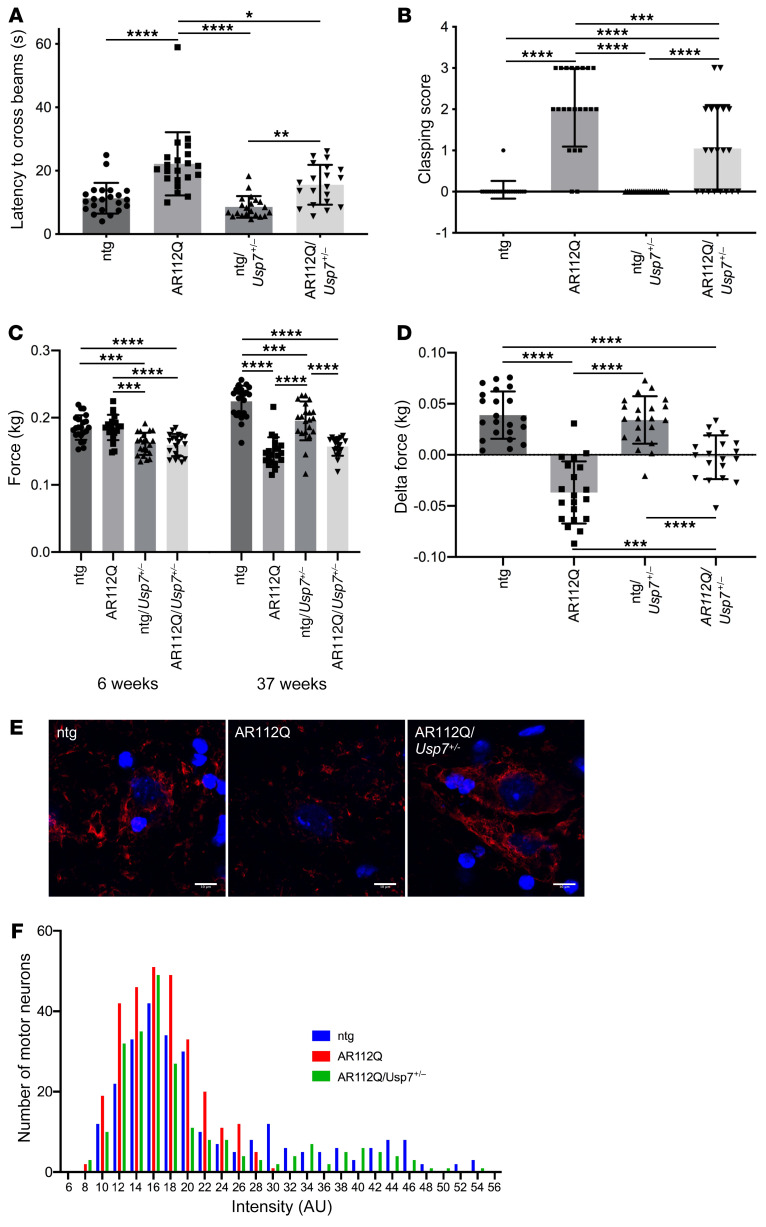
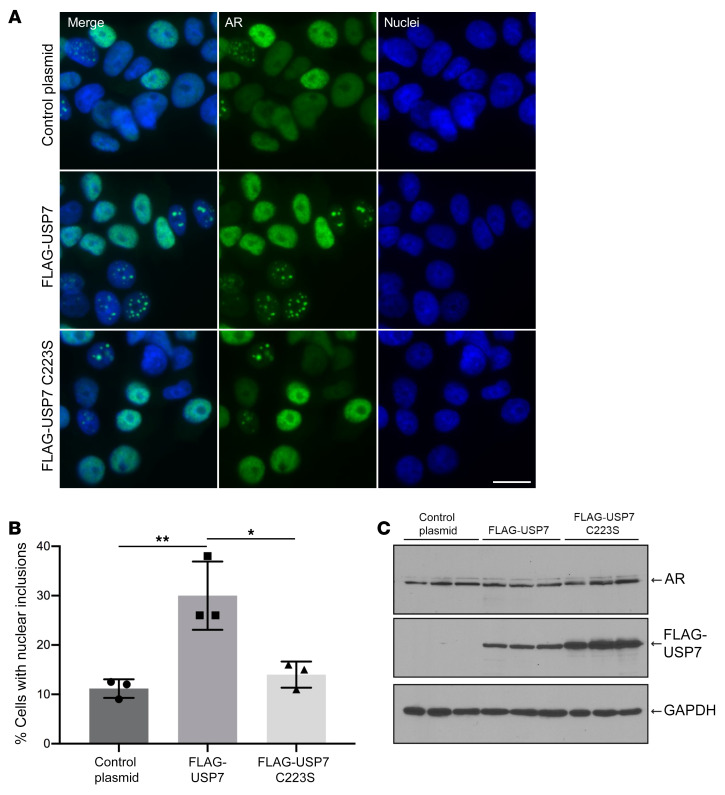
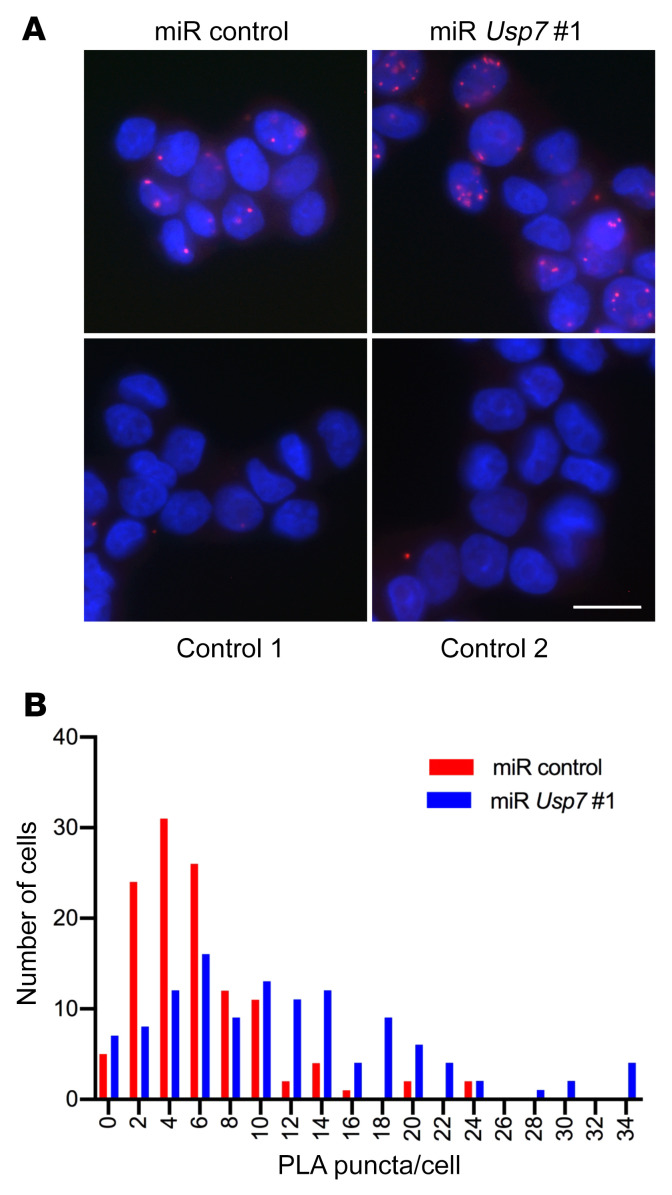
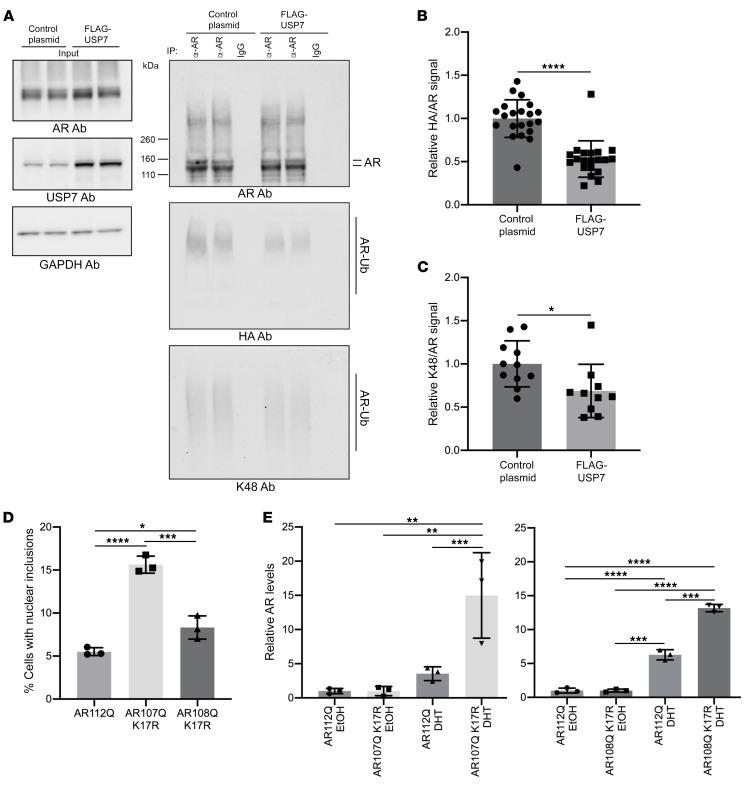
Polyglutamine (polyQ) diseases are devastating, slowly progressing neurodegenerative conditions caused by expansion of polyQ-encoding CAG repeats within the coding regions of distinct, unrelated genes. In spinal and bulbar muscular atrophy (SBMA), polyQ expansion within the androgen receptor (AR) causes progressive neuromuscular toxicity, the molecular basis of which is unclear. Using quantitative proteomics, we identified changes in the AR interactome caused by polyQ expansion. We found that the deubiquitinase USP7 preferentially interacts with polyQ-expanded AR and that lowering USP7 levels reduced mutant AR aggregation and cytotoxicity in cell models of SBMA. Moreover, USP7 knockdown suppressed disease phenotypes in SBMA and spinocerebellar ataxia type 3 (SCA3) fly models, and monoallelic knockout of Usp7 ameliorated several motor deficiencies in transgenic SBMA mice. USP7 overexpression resulted in reduced AR ubiquitination, indicating the direct action of USP7 on AR. Using quantitative proteomics, we identified the ubiquitinated lysine residues on mutant AR that are regulated by USP7. Finally, we found that USP7 also differentially interacts with mutant Huntingtin (HTT) protein in striatum and frontal cortex of a knockin mouse model of Huntington's disease. Taken together, our findings reveal a critical role for USP7 in the pathophysiology of SBMA and suggest a similar role in SCA3 and Huntington's disease.

Keywords: Neurodegeneration; Neuromuscular disease; Neuroscience; Ubiquitin-proteosome system.


Conflict of interest statement

Conflict of interest: The authors have declared that no conflict of interest exists.

Figures

Figure 1
Figure 1. Unbiased quantitative interaction screen for WT and polyQ-expanded AR.
Three independent SILAC experiments were performed. Experiment 1: PC12 cells expressing AR 112Q or AR10Q were grown in heavy or light SILAC medium, respectively (shown in pink). Anti-AR (A) or 3B5H10 antibody (B) was used for IP. Experiment 2 (label swap): AR112Q- or AR10Q-expressing cells were grown in light or heavy SILAC medium, respectively (shown in yellow). Anti-AR (A) or 3B5H10 antibody (B) was used for IP. Experiment 3: cells expressing AR 112Q or AR10Q were grown in heavy or light SILAC medium, respectively (shown in gray). 3B5H10 antibody (B) was used for IP. Cells were induced with doxycycline to express AR and treated with DHT for 48 hours. (A) Left: Venn diagram comparison of common proteins pulled down with anti-AR antibody in 2 experiments. Right: common proteins that were enriched either with AR112Q or AR10Q by 1.5-fold or more. Fold enrichment is shown in Supplemental Tables 1 and 2. (B) Left: Venn diagram comparison of common proteins pulled down with 3B5H10 antibody in 3 independent experiments. Right: common proteins enriched with AR112Q by 1.5-fold or more in at least 2 experiments. Fold enrichment is shown in Supplemental Table 1.
Figure 2
Figure 2. USP7 preferentially interacts with AR112Q in cells.
(A) Co-IP of USP7 with AR after pull-down with an anti-AR antibody, followed by immunoblot with anti-AR or anti-USP7 antibodies; GAPDH detection served as loading control. Input levels of AR or USP7 in AR112Q- relative to AR10Q-expressing cells are shown in blue (data normalized to AR10Q cells). Relative amounts of immunoprecipitated AR or USP7 are shown in red, normalized to IP recovery from AR10Q-expressing cells. (B) Co-IP of AR with USP7 following pull-down with an anti-USP7 antibody, followed by immunoblot with anti-AR or anti-USP7 antibodies; GAPDH detection served as loading control. As in A, relative input levels are shown in blue, and amounts of immunoprecipitated proteins are shown in red. (C) USP7-AR interaction was evaluated by PLA (red puncta) in PC12 cells. AR was predominantly nuclear, as judged by subsequent immunostaining with anti-AR antibody (green signal). Scale bar: 10 μm. (D) Quantification of PLA puncta in cells expressing AR10Q and AR112Q, respectively, based on images taken before staining for total AR (see Supplemental Figure 2C), with 100 cells evaluated per condition and carried out in triplicate. P < 0.0001, Kolmogorov-Smirnov test.
Figure 3
Figure 3. USP 7 interacts with AR in vivo.
(A and B) Western blot analysis of immunoprecipitates from brain and spinal cord of 10-week-old SBMA male transgenic mice. Aggregated AR species can be observed as high molecular weight species at the top of the gel. (C) PLA analysis of AR-USP7 interaction in motor neurons from spinal cord sections of a 7-month-old KI SBMA mouse or a WT mouse, followed by immunostaining for unphosphorylated NF-H (SMI32 Ab) to identify motor neurons and with Hoechst 33258 to mark nuclei. Scale bar: 10 μm. PLA quantification and PLA technical controls are shown in Supplemental Figure 3A and Supplemental Figure 3B, respectively. (D) USP7-AR interaction was evaluated by PLA (green) in iPS-derived motor neurons from SBMA patient, followed by immunostaining with anti-β III-tubulin antibody (TUJ1) (red). Scale bar: 10 μm. PLA technical controls are shown in Supplemental Figure 3E.
Figure 4
Figure 4. USP7 preferentially interacts with soluble polyQ-expanded AR and does not colocalize with nuclear inclusions.
IP of AR112Q-expressing PC12 cell protein lysates with anti-USP7 antibody, resolved by SDS-PAGE (A) or SDS-agarose (B). (C) Quantification of slow- and fast-migrating species from input lanes of B. (D) Immunofluorescence images of PC12 cells expressing AR112Q. Arrow points to a nuclear inclusion. Scale bar: 10 μm. (E) AR immunofluorescence images of cells examined by PLA in Figure 2C. Approximately 10% (9.5 ± 1.1) of AR112Q-expressing cells contained nuclear inclusions. Scale bar: 10 μm.
Figure 5
Figure 5. Knockdown of USP7 decreases polyQ-expanded AR aggregation and increases AR turnover in a cell model of SBMA.
PC12 cells inducibly expressing AR112Q and constitutively expressing miRNAs targeting different regions of Usp7 mRNA (miR Usp7 no. 1 and miR Usp7 no. 2) or nontargeting miRNA (miR control) were (A) analyzed for USP7 and AR protein levels by immunoblot. (B and C) Quantification of USP7 and AR protein levels from A. (D) Percentage of cells with nuclear inclusions upon USP7 knockdown (top); representative immunofluorescence images (bottom). Scale bar: 10 μm. For each condition, 500 cells were counted in triplicate. Experiment was repeated 3 times. (E) Cell lysates from A were resolved on SDS-agarose followed by immunoblot analysis with an anti-AR antibody. (F) AR turnover upon USP7 knockdown. AR levels were determined by Western blot analysis (images shown in Supplemental Figure 4G). Graph represents an average of 4 independent experiments, with each experiment performed in triplicate. Data were normalized to the 0-hour washout time point. *P < 0.05; **P < 0.01; ***P < 0.001; ****P < 0.0001, 1-way ANOVA with post hoc Tukey’s test. Error bars represent SD.
Figure 6
Figure 6. Knockdown of USP7 rescues DHT-induced toxicity in cell models of SBMA.
(A) DHT-induced cell death in PC12 cells expressing AR112Q and either miR Usp7 no. 1 or miR control. Two hundred cells were counted in triplicate per condition (except for miR control no DHT, n = 5; and miR control DHT, n = 6). The experiment was repeated 3 times. (B) Dissociated spinal cord cultures from mouse embryos with the genotypes AR112Q, AR112Q/Usp7+/–, ntg/Usp7+/–, or nontransgenic (ntg) were treated with DHT or vehicle (ethanol) for 7 days and motor neurons from 10 random fields were counted per experimental condition. Three independent experiments were performed for AR112Q (n = 6) and AR112Q/Usp7+/– (n = 3), and 2 independent experiments were performed in triplicate for ntg/Usp7+/– and ntg. Due to experimental variability in total motor neuron number, relative motor neuron number in DHT vs. vehicle treatment conditions is presented. An example of the raw data is presented in Supplemental Figure 5A. *P < 0.05; **P < 0.01; ***P < 0.001, 1-way ANOVA with post hoc Tukey’s. Error bars represent SD. (C) Dissociated spinal cord cultures from mouse embryos of KI SBMA mice were infected with AAV1 expressing either miR control or miR Usp7 no. 1 for 5 days, followed by DHT or ethanol treatment for an additional 7 days. Motor neurons were counted from the entire coverslip per experimental condition in triplicate (except for the miR control ethanol condition, where the experiment was done in duplicate). *P < 0.05, 1-tailed t test. Error bars represent SD.
Figure 7
Figure 7. Knockdown of USP7 rescues DHT-induced toxicity in a fly model of SBMA.
(A) Histological sections of fly eyes expressing pathogenic AR52Q either with RNAi control or 2 independent USP7-directed RNAi; red arrows in the left panel mark detachment of array from the lamina. Scale bar: 50 μm. (B) Flies expressing AR52Q were sacrificed at day 1 of DHT treatment as adults. Eyes from 9–10 flies per group were sectioned, with 3–6 sections stained and imaged; the length of the detachment of the array from the lamina was measured and averaged for each fly. (C) Adult flies expressing AR52Q were sacrificed at 10 days of DHT treatment. Eyes from 10–19 flies per experimental group were sectioned and analyzed as in B. (D) Western blots from fly heads expressing AR52Q. (E) Quantification of AR levels in each experimental group from D. ****P < 0.0001, 1-way ANOVA with post hoc Tukey’s test. Error bars represent SD.
Figure 8
Figure 8. Haploinsufficiency of Usp7 rescues several motor deficits and restores levels of unphosphorylated NF-H in spinal motor neurons in a mouse model of SBMA.
(A) Effect of monoallelic knockout of Usp7 on balance beam deficits of AR112Q male mice. ntg (n = 22), AR112Q (n = 21), ntg/Usp7+/– (n = 21), and AR112Q/Usp7+/– (n = 20) mice were evaluated at 33 weeks of age. (B) ntg (n= 22), AR112Q (n = 22), ntg/Usp7+/– (n = 21), and AR112Q/Usp7+/– (n = 20) male mice were evaluated for clasping at 30 weeks of age. (C) Effect of monoallelic knockout of Usp7 on grip strength of 6-week-old (n = 25 per cohort) and 37-week-old mice. ntg (n = 22), AR112Q (n = 20), ntg/Usp7+/– (n = 21) and AR112Q/Usp7+/– (n = 19); average relative change in grip strength between 6 and 37 weeks is represented in D. *P < 0.05; **P < 0.01; ***P < 0.001; ****P < 0.0001, 1-way ANOVA with post hoc Tukey’s test. Error bars represent SD. (E) Unphosphorylated NF-H (SMI32 Ab) immunofluorescence (red) in spinal cords from 37-week-old mice (3 mice per experimental group), with Hoechst 33258 to identify nuclei. Scale bars: 10 μm. (F) Intensity of SMI32 staining was evaluated from at least 230 motor neurons per experimental group. For comparison of distributions, statistical significance was determined by the Kolmogorov-Smirnov test (ntg vs. AR112Q P < 0.0001; AR112Q/Usp7+/– vs. ntg P < 0.01; AR112Q/Usp7+/– vs. AR112Q P < 0.001).
Figure 9
Figure 9. USP7 catalytic activity promotes AR aggregation.
(A) Immunofluorescence images of PC12 cells expressing AR112Q and FLAG-USP7, the catalytic mutant FLAG-USP7 C223S, or a control vector. Scale bar: 10 μm. (B) Quantification of the number of cells containing nuclear inclusions from A. For each condition, 500 cells were counted in triplicate. Experiment was repeated 3 times. *P < 0.05; **P < 0.01, 1-way ANOVA with post hoc Tukey’s test. Error bars represent SD. (C) Expression levels of AR, FLAG-USP7, and FLAG-USP7 C223S were evaluated by immunoblot.
Figure 10
Figure 10. USP7 knockdown enhances polyQ-expanded AR ubiquitination.
AR ubiquitination in PC12 cells expressing AR112Q and miR Usp7 no. 1 (or a miR control) was evaluated by PLA, using antibodies to AR and ubiquitin. (A) Fluorescence images of PLA puncta. Control 1, anti-AR antibody was omitted; control 2, PC12 cells that do not express AR. Scale bar: 10 μm. (B) Quantification of the number of PLA puncta in miR control–expressing cells or miR Usp7 no. 1–expressing cells, respectively; n = 120 cells per condition. Experiment was repeated 3 times. For comparison of distributions, statistical significance was determined by the Kolmogorov-Smirnov test. P < 0.0001.
Figure 11
Figure 11. AR is a substrate for the deubiquitinase function of USP7.
(A) Immunoprecipitated AR from HEK293T cells transiently expressing AR111Q, HA-tagged Ub, and FLAG-USP7 (or GFP control) was analyzed by immunoblotting with anti-AR antibody (top), HA-specific antibody (middle) and K48-linked polyubiquitin-specific antibody (bottom). Input levels are shown on the left. (B) Quantitation (from 8 independent experiments performed in duplicate or triplicate) of the relative change in HA to AR monomer signals upon FLAG-USP7 overexpression. (C) Quantitation of the relative change in K48 to AR monomer signals upon FLAG-USP7 overexpression from 4 independent experiments (each experiment performed in duplicate or triplicate). *P < 0.05; ****P < 0.0001, 2-tailed Student’s t test. Error bars represent SD. (D) Percentage of cells with nuclear inclusions in cells expressing AR112Q, AR107Q K17R, or AR108Q K17R. *P < 0.05; ***P < 0.001; ****P < 0.0001, 1-way ANOVA with post hoc Tukey’s test. Error bars represent SD. (E) To evaluate AR turnover, AR112Q, AR107Q K17R, or AR108Q K17R expression was induced with DOX for 48 hours. Following DOX washout, cells were treated with cycloheximide and either DHT or vehicle (EtOH) for an additional 24 hours. AR levels were analyzed by Western blotting (example images shown in Supplemental Figure 10E). Data were normalized to the vehicle (EtOH) treatment condition. Three independent experiments (each one in triplicate) were performed. **P < 0.01; ***P < 0.001; ****P < 0.0001, 1-way ANOVA with post hoc Tukey’s test. Error bars represent SD.

References

    1. La Spada AR, Wilson EM, Lubahn DB, Harding AE, Fischbeck KH. Androgen receptor gene mutations in X-linked spinal and bulbar muscular atrophy. Nature. 1991;352(6330):77–79. - PubMed
    1. Chevalier-Larsen ES, et al. Castration restores function and neurofilament alterations of aged symptomatic males in a transgenic mouse model of spinal and bulbar muscular atrophy. J Neurosci. 2004;24(20):4778–4786. doi: 10.1523/JNEUROSCI.0808-04.2004. - DOI - PMC - PubMed
    1. Katsuno M, et al. Testosterone reduction prevents phenotypic expression in a transgenic mouse model of spinal and bulbar muscular atrophy. Neuron. 2002;35(5):843–854. doi: 10.1016/S0896-6273(02)00834-6. - DOI - PubMed
    1. Yu Z, et al. Androgen-dependent pathology demonstrates myopathic contribution to the Kennedy disease phenotype in a mouse knock-in model. J Clin Invest. 2006;116(10):2663–2672. doi: 10.1172/JCI28773. - DOI - PMC - PubMed
    1. Kennedy WR, Alter M, Sung JH. Progressive proximal spinal and bulbar muscular atrophy of late onset. A sex-linked recessive trait. Neurology. 1968;18(7):671–680. doi: 10.1212/WNL.18.7.671. - DOI - PubMed

Publication types

MeSH terms