. 2020 Nov 10;15(11):e0239528.
doi: 10.1371/journal.pone.0239528. eCollection 2020.

Regulatory and evolutionary adaptation of yeast to acute lethal ethanol stress

Affiliations

Regulatory and evolutionary adaptation of yeast to acute lethal ethanol stress

Jamie Yang et al. PLoS One. .

Abstract

The yeast Saccharomyces cerevisiae has been the subject of many studies aimed at understanding mechanisms of adaptation to environmental stresses. Most of these studies have focused on adaptation to sub-lethal stresses, upon which a stereotypic transcriptional program called the environmental stress response (ESR) is activated. However, the genetic and regulatory factors that underlie the adaptation and survival of yeast cells to stresses that cross the lethality threshold have not been systematically studied. Here, we utilized a combination of gene expression profiling, deletion-library fitness profiling, and experimental evolution to systematically explore adaptation of S. cerevisiae to acute exposure to threshold lethal ethanol concentrations-a stress with important biotechnological implications. We found that yeast cells activate a rapid transcriptional reprogramming process that is likely adaptive in terms of post-stress survival. We also utilized repeated cycles of lethal ethanol exposure to evolve yeast strains with substantially higher ethanol tolerance and survival. Importantly, these strains displayed bulk growth-rates that were indistinguishable from the parental wild-type strain. Remarkably, these hyper-ethanol tolerant strains had reprogrammed their pre-stress gene expression states to match the likely adaptive post-stress response in the wild-type strain. Our studies reveal critical determinants of yeast survival to lethal ethanol stress and highlight potentially general principles that may underlie evolutionary adaptation to lethal stresses in general.


Conflict of interest statement

The authors have declared that no competing interests exist.

Figures
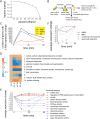
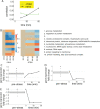
Fig 1
Fig 1. Global transcriptional response to threshold lethal acute ethanol stress.
(A) The fraction survival of yeast CFUs exposed to two minutes of ethanol stress, from 19% to 26% ethanol. Error bars represent standard error. (B) Procedure used to perform stress assay on yeast cells and to collect samples for RNA-seq. (C) Number of differentially expressed genes, for each post-stress time point relative to the pre-stress time point, measured as the number of genes with more than a two-fold expression change. The total number of differentially expressed genes was broken down into those with a two-fold downregulation and those with a two-fold upregulation. (D) Clustering of the time-course gene expression data using k-means with 10 clusters. Gene ontology analysis was performed on each of the clusters, and significant functional categories (p<0.001) are shown. (E) Average expression from the 12 most significant gene ontology categories in the 15- or 30-minute post-stress time point. Red colored lines indicate upregulated genes and blue colored lines indicate downregulated genes within the early post-stress time points. (F) Average expression of condensed chromosome and spore wall assembly genes, along with the expression of UME6 and IME1.
Fig 2
Fig 2. Utilizing the pooled yeast deletion library to determine contributions of all non-essential genes to survival.
(A) Procedure used to perform stress assay on yeast cells and to determine contribution of each gene deletion to survival. (B) Histogram of fitness (survival) scores. (C) Maximum gene expression fold change versus statistically significant fitness scores to determine concordance between a gene’s transcriptional response and its contribution to stress survival. (D) Boxplot showing that negative fitness scores have a significant positive expression change (p < 2.2 x 10⁻¹⁶), and positive fitness scores have a significant negative expression change (p = 1.9 x 10⁻¹³).
Fig 3
Fig 3. Laboratory experimental evolution to repeated acute lethal ethanol stress selects for mutants with substantially enhanced survival.
(A) Laboratory evolution protocol. At every round of selection, survival was measured by plating, and experiments were stopped when survival was enhanced substantially beyond the baseline level of 1%. (B) Fraction survival of the naive wild-type strain (black), evolved population (red), and 3 distinct clones from the evolved population (green). Horizontal lines indicate the average survival of each of the replicates. JY304 is derived from the colony with the highest percent survival. (C) Analogous to Fig 1A, comparing the fraction survival of strain JY304 to the wild-type strain at a range of ethanol concentrations, from 19% to 26%. Error bars indicate standard error. (D) Growth curves of strain JY304 and wild-type strain. (E) Testing cross-protection of cells evolved under ethanol stress, compared to the wild-type strain, stressed at 70 mM hydrogen peroxide. Error bars indicate standard error. (F) Same as D except with heat stress at 57°C.
Fig 4
Fig 4. Transcriptional responses of an extreme ethanol stress survivor.
(A) Correlation between each of the post-stress time points to the pre-stress time point for both strain JY304 and the wild-type strain. (B) Clustering of the time-course gene expression data using k-means with 10 clusters for strain JY304. Gene ontology analysis was performed on each of the clusters, and significant functional categories (p<0.001) are shown for each cluster. For comparison, the heatmap for the wild-type time-course gene expression clustering is shown to the left. Note: The significant functional categories for strain JY304 do not apply to the wild-type heatmap, which is unaltered from Fig 1D. (C-E) Average expression of the three functional categories that are significantly (p<0.001) up- or downregulated in the wild-type strain in response to ethanol stress (right), along with a boxplot of their corresponding pre-stress expression in strain JY304. The categories are kinase (C) (p < 2.2 x 10⁻¹⁶), ribosomal protein (D) (p = 0.005415), and translation (E) (p = 0.00324).

References

    1. Hottiger T, Boller T, Wiemken A. Rapid changes of heat and desiccation tolerance correlated with changes of trehalose content in Saccharomyces cerevisiae cells subjected to temperature shifts. FEBS letters. 1987. August 10;220(1):113–5. 10.1016/0014-5793(87)80886-4 - DOI - PubMed
    1. Benaroudj N, Lee DH, Goldberg AL. Trehalose Accumulation during Cellular Stress Protects Cells and Cellular Proteins from Damage by Oxygen Radicals. Journal of Biological Chemistry. 2001. June 29;276(26):24261–7. 10.1074/jbc.M101487200 - DOI - PubMed
    1. Sanchez Y, Taulien J, Borkovich KA, Lindquist S. Hsp104 is required for tolerance to many forms of stress. The EMBO journal. 1992. June;11(6):2357–64. - PMC - PubMed
    1. Gasch AP, Spellman PT, Kao CM, Carmel-Harel O, Eisen MB, Storz G, et al. Genomic expression programs in the response of yeast cells to environmental changes. Molecular biology of the cell. 2000. December;11(12):4241–57. 10.1091/mbc.11.12.4241 - DOI - PMC - PubMed
    1. Causton HC, Ren B, Sang Seok Koh, Harbison CT, Kanin E, Jennings EG, et al. Remodeling of yeast genome expression in response to environmental changes. Molecular biology of the cell. 2001. February;12(2):323–37. 10.1091/mbc.12.2.323 - DOI - PMC - PubMed

Publication types

MeSH terms