

Twitter reveals human mobility dynamics during the COVID-19 pandemic
- PMID: 33170889
- PMCID: PMC7654838
- DOI: 10.1371/journal.pone.0241957
Twitter reveals human mobility dynamics during the COVID-19 pandemic
Abstract
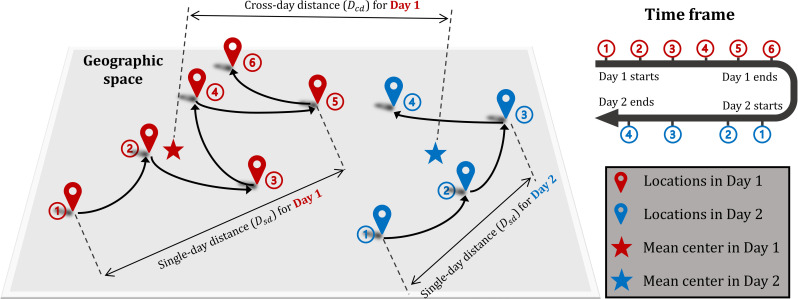
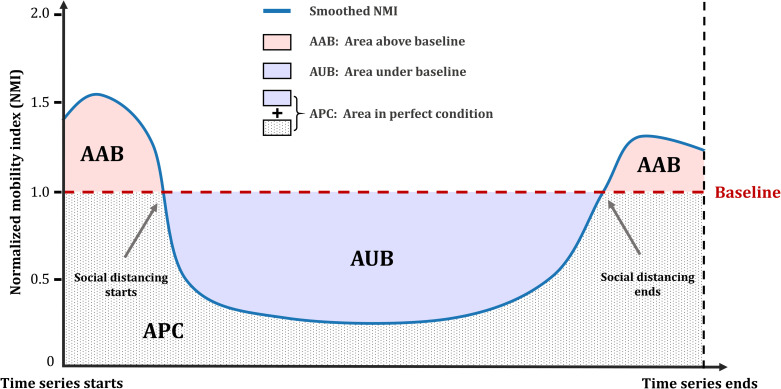
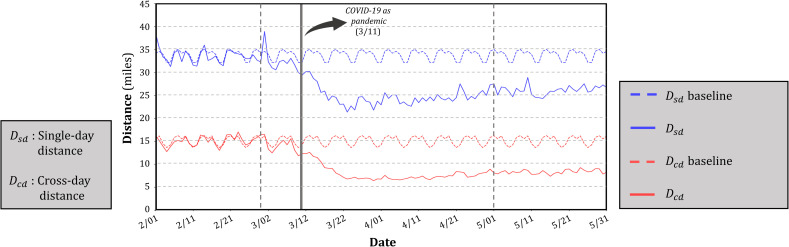
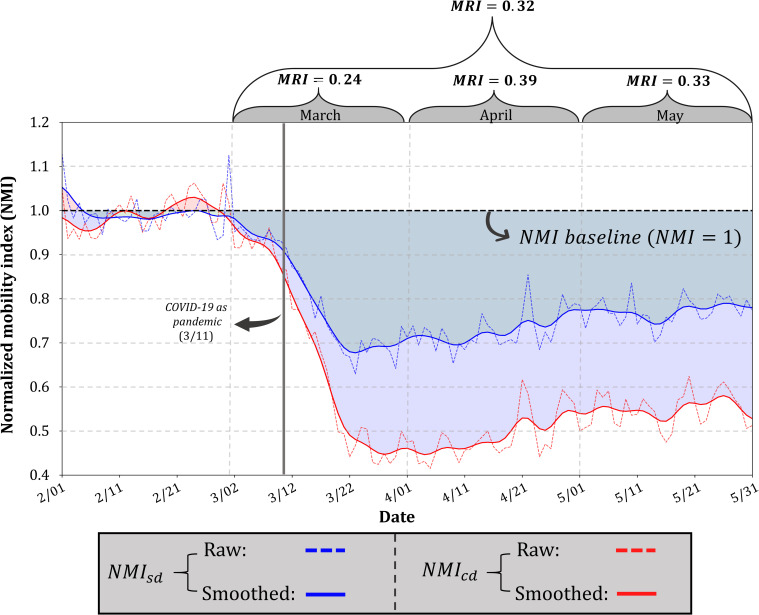
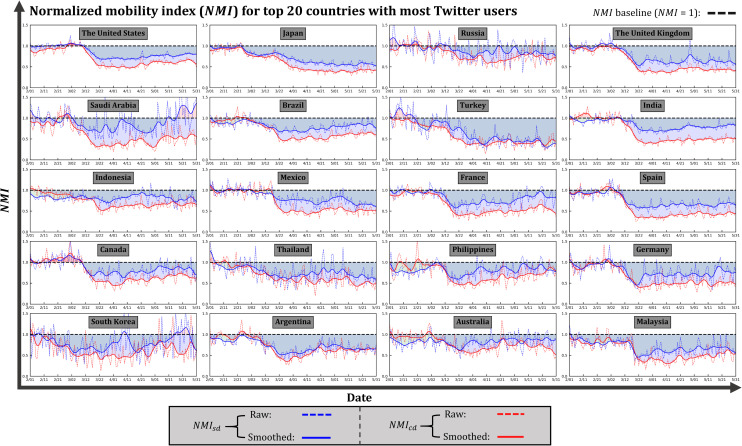
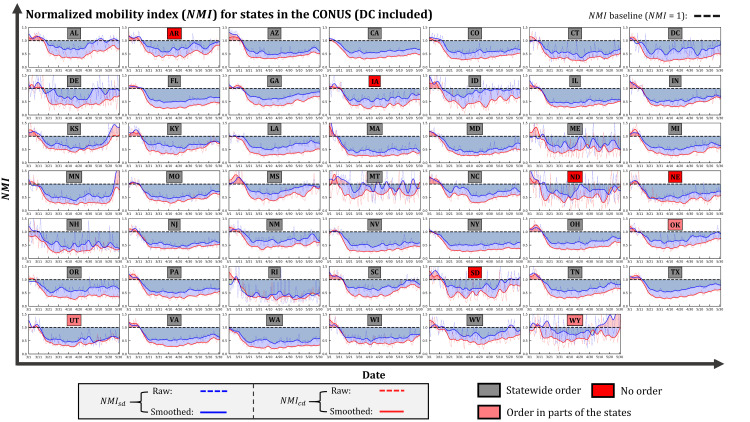
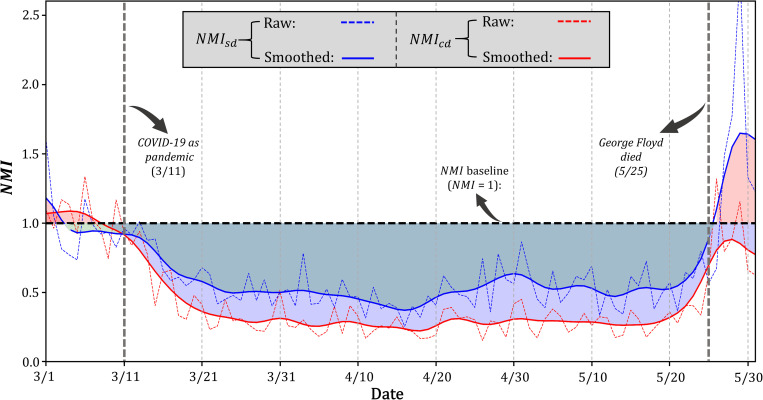
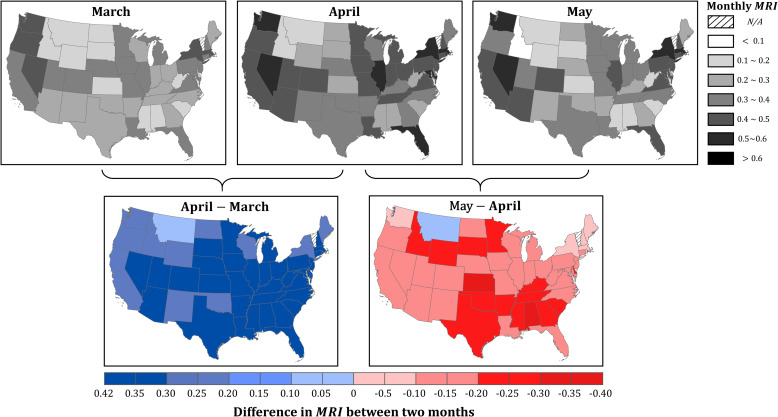
The current COVID-19 pandemic raises concerns worldwide, leading to serious health, economic, and social challenges. The rapid spread of the virus at a global scale highlights the need for a more harmonized, less privacy-concerning, easily accessible approach to monitoring the human mobility that has proven to be associated with viral transmission. In this study, we analyzed over 580 million tweets worldwide to see how global collaborative efforts in reducing human mobility are reflected from the user-generated information at the global, country, and U.S. state scale. Considering the multifaceted nature of mobility, we propose two types of distance: the single-day distance and the cross-day distance. To quantify the responsiveness in certain geographic regions, we further propose a mobility-based responsive index (MRI) that captures the overall degree of mobility changes within a time window. The results suggest that mobility patterns obtained from Twitter data are amenable to quantitatively reflect the mobility dynamics. Globally, the proposed two distances had greatly deviated from their baselines after March 11, 2020, when WHO declared COVID-19 as a pandemic. The considerably less periodicity after the declaration suggests that the protection measures have obviously affected people's travel routines. The country scale comparisons reveal the discrepancies in responsiveness, evidenced by the contrasting mobility patterns in different epidemic phases. We find that the triggers of mobility changes correspond well with the national announcements of mitigation measures, proving that Twitter-based mobility implies the effectiveness of those measures. In the U.S., the influence of the COVID-19 pandemic on mobility is distinct. However, the impacts vary substantially among states.
Conflict of interest statement
The authors have declared that no competing interests exist.
Figures
References
-
- Coronavirus Disease (COVID-19) Situation Reports—155 [Internet]. World Health Organization. World Health Organization; [cited 2020Jun23]. Available from: https://www.who.int/docs/default-source/coronaviruse/situation-reports/2...
-
- Coronavirus Disease (COVID-19)—events as they happen [Internet]. World Health Organization. World Health Organization; [cited 2020Jun23]. Available from: https://www.who.int/emergencies/diseases/novel-coronavirus-2019/events-a...
-
- Soucheray S. US COVID-19 cases surge past 82,000, highest total in world [Internet]. CIDRAP. 2020 [cited 2020Jun23]. Available from: https://www.cidrap.umn.edu/news-perspective/2020/03/us-covid-19-cases-su...
-
- Gao S, Rao J, Kang Y, Liang Y, Kruse J. Mapping county-level mobility pattern changes in the United States in response to COVID-19. SIGSPATIAL Special. 2020. June 3;12(1):16–26.
Publication types
MeSH terms
Grants and funding
LinkOut - more resources
Full Text Sources
