. 2020 Dec 10;183(6):1496-1507.e16.
doi: 10.1016/j.cell.2020.10.051. Epub 2020 Nov 3.

Quick COVID-19 Healers Sustain Anti-SARS-CoV-2 Antibody Production

Affiliations

Quick COVID-19 Healers Sustain Anti-SARS-CoV-2 Antibody Production

Yuezhou Chen et al. Cell. .

Abstract

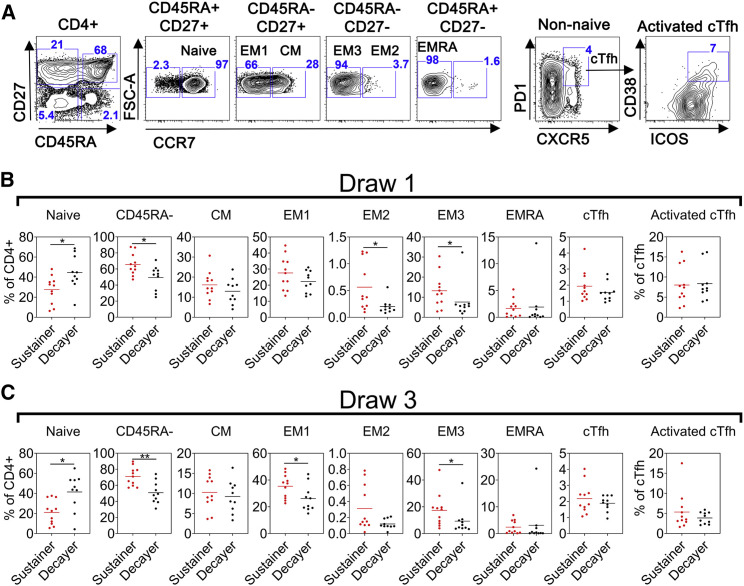
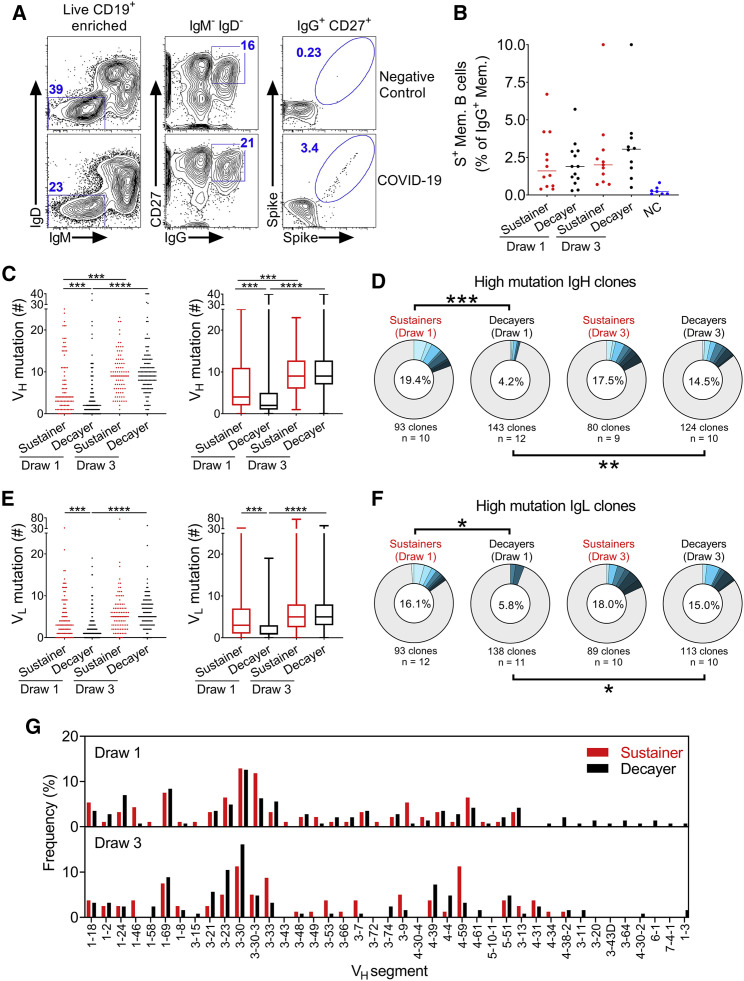
Antibodies are key immune effectors that confer protection against pathogenic threats. The nature and longevity of the antibody response to SARS-CoV-2 infection are not well defined. We charted longitudinal antibody responses to SARS-CoV-2 in 92 subjects after symptomatic COVID-19. Antibody responses to SARS-CoV-2 are unimodally distributed over a broad range, with symptom severity correlating directly with virus-specific antibody magnitude. Seventy-six subjects followed longitudinally to ∼100 days demonstrated marked heterogeneity in antibody duration dynamics. Virus-specific IgG decayed substantially in most individuals, whereas a distinct subset had stable or increasing antibody levels in the same time frame despite similar initial antibody magnitudes. These individuals with increasing responses recovered rapidly from symptomatic COVID-19 disease, harbored increased somatic mutations in virus-specific memory B cell antibody genes, and had persistent higher frequencies of previously activated CD4+ T cells. These findings illuminate an efficient immune phenotype that connects symptom clearance speed to differential antibody durability dynamics.

Keywords: COVID-19; SARS-CoV-2; SHM; durability; germinal center; serology; severity; somatic hypermutation; symptom duration.


Conflict of interest statement

Declaration of Interests The authors declare no competing interests.

Figures

None
Graphical abstract
Figure 1
Figure 1
Humoral Responses to SARS-CoV-2 Antigens Are Broadly Distributed and Correlate with Age and Symptom Severity Among Patients with Mild Disease (A and B) Anti-N, anti-S, and anti-RBD IgG (A) and IgM (B) levels for all 92 COVID-19 subjects measured by full titration and comparison to either a pooled plasma standard (AU) or monoclonal antibody standard (mAb μg/mL equiv.). (C) Single variate Spearman correlation matrix displaying r values and significance levels for correlations between anti-SARS-CoV-2 IgG levels and age, BMI, symptom (Sx) severity, and Sx duration. ns, not significant; p < 0.05, ∗∗p < 0.01, ∗∗∗p < 0.001, and ∗∗∗∗p < 0.0001. Surveys were >97% complete for each category. Color indicates strength of positive correlation. (D–I) The relationships between symptom severity and anti-N (D), anti-S (E), and anti-RBD (F) IgG levels are displayed as scatterplots. Similarly, the correlations between age and anti-N (G), anti-S (H), and anti-RBD (I) IgG levels are given. r and significance from Spearman correlation are given at the top of the plot. For all plots, the black dashed lines represent twice the average of negative controls.
Figure S1
Figure S1
Correlation Scatterplots for All Baseline Antibody and Clinical Parameters, Related to Figure 1 Scatterplots illustrating all correlations in Figure 1C. Correlations are shown for (A) anti-N IgG and anti-S IgG levels, (B) anti-N IgG and anti-RBD IgG, (C) anti-S IgG and anti-RBD IgG, (D) anti-N IgG and BMI, (E) anti-S IgG and BMI, (F) anti-RBD IgG and BMI, (G) anti-N IgG and symptom duration, (H) anti-S IgG and symptom duration, (I) anti-RBD IgG and symptom duration, (J) age and symptom duration, (K) BMI and symptom duration, (L) symptom severity and symptom duration, (M) age and BMI, (N) age and symptom severity, (O) and BMI and symptom severity. At the top of each plot is the r value and significance level determined by Spearman correlation analysis. (P) Box and whisker and dot plots illustrating the range of symptom severity scores reported by subjects.
Figure 2
Figure 2
Luminex Analysis of COVID-19 Samples Confirms that the Plasma Antibody Response to SARS-CoV-2 Infection Ranges from Robust to Negligible (A and B) IgG1 (A) and IgM (B) reactivities to N (blue circles), S (red triangles), and RBD (white squares) as measured by Luminex among pre-pandemic (negative control) samples (NC, n = 6) and a subset of the COVID-19 convalescent cohort (COVID-19, n = 60). (C and D) Plots showing the proportions of the COVID-19 subjects analyzed by Luminex and ELISA that are positive for anti-N (blue), anti-S (red), and anti-RBD (black) antibody. IgG (ELISA)/IgG1(Luminex) (C) and IgM (D) are shown. Positivity cut off was set at twice the average signal of the negative control samples. (E and F) Scatterplots showing the correspondence between the anti-N and anti-S IgG1 (E) and anti-N and anti-RBD IgG1 (F) Luminex values. Black dashed lines represent twice the average of negative controls and Spearman r value for the correlation is shown. (G) Latent variable scores biplot resulting from orthogonal partial least square discriminant analysis (OPLS-DA) with symptom severity as outcome variable. Each point is an individual patient, colored by symptom severity. Ellipses illustrate the 95% confidence intervals for each outcome. (H) Loadings plot depicting feature importance on the 1st latent variable. Feature names are colored by antigen (N: light blue; S: red; RBD: navy). Bar color corresponds with the symptom severity group that the feature correlates most highly with based on median feature values. (I) OPLSDA model performance. ROC curves (purple) for 100 5-fold cross validated trials predicting symptom severity based on the OPLS-DA model. The median AUC score is labeled in the legend and the corresponding curve is highlighted in black. Blue dashed line denotes classification threshold for a random process. (J) Correlation networks identifying ELISA (hexagon) and Luminex (circle) features that co-correlate with the four features selected for the OPLS-DA model (outlined in black). Edges exist between features with correlation strength greater than 0.75 and p < 0.01. Nodes are colored by antigen as in (H).
Figure S2
Figure S2
Correlations between Influenza or Cold Virus Antibody Levels and Key COVID-19 Cohort Characteristics, Related to Figure 2 Heatmap illustrating correlations between IgG1, IgG2, IgG3, IgG4, IgA and IgM reactivity to the spike receptor binding domains of 3 common cold coronaviruses, HKU.1, 229E and OC43, influenza hemagglutinin and key clinical and disease features of subjects in our cohort. Data are from Luminex assay, with 60 subjects included. Survey data are > 96% complete for each category. Spearman correlation analysis was performed and r values and significance levels are displayed, ns is not significant, p < 0.05, ∗∗p < 0.01, ∗∗∗p < 0.001, and ∗∗∗∗p < 0.0001. Blue color intensity indicates strength of negative correlations, red color intensity indicates strength of positive correlations.
Figure 3
Figure 3
Longitudinal Plasma Samples Define a Subset of Swift-Healing Subjects with Stable or Increasing Anti-SARS CoV-2 IgG Levels at ∼100 Days after Symptom Onset (A) Box and whisker plots illustrating blood draw schedule with medians indicated. (B) Plot showing the ranges of antibody durability indices for subjects that donated three blood samples (n = 76). The durability index for each antigen here is the quotient of the 3rd blood draw IgG level divided by the first blood draw from the same individual. Dashed line at unity. (C) Venn diagram illustrating overlap between anti-N, anti-S, and anti-RBD sustainer groups. (D and E) Subjects were grouped as either having stable or decaying antibody levels based on their antibody durability index, with “sustainers” (red) ≥ 1 and “decayers” (black) < 1. The changes in anti-N (left), anti-S (middle), and anti-RBD (right) IgG levels across draws are expressed as an absolute value (D) or relative to the value for that subject in draw 1 (baseline) (E). (F) Single variate Spearman correlation matrix displaying r values and significance levels for correlations between antibody durability indices and the indicated variables derived from survey data (n = 72). Survey data were complete for all categories excluding BMI, for which one subject declined to provide data. (G and H) Scatterplots illustrating the correlations between the anti-S (G) and anti-RBD durability index (H) and duration of COVID-19 symptoms, with r and significance from Spearman correlation analysis. (I–L) Comparison of symptom duration reported for individuals with stable anti-S IgG levels (I) and anti-RBD IgG levels (K) (sustainers, red; n = 20 and n = 17, respectively) to those with decaying levels (decayers, black; n = 52 and n = 55, respectively). Comparisons of draw 1 and draw 3 IgG antibody levels among anti-S (J) and anti-RBD (L) IgG sustainers and decliners shown in (I and K). Horizontal lines indicate medians. For (D), (J), and (L), black dashed lines represent twice the average of negative controls. Student’s t test was used for significance testing of differences in antibody levels following a log transformation of the values. Significance testing for differences in symptom duration used the Mann-Whitney U test. ns, not significant. p < 0.05, ∗∗p < 0.01, ***p < 0.001.
Figure S3
Figure S3
Alternative Presentation of Anti-SARS-CoV-2 IgG Dynamics over Time and Comparison of Sustainer and Decayer Draw Times, Related to Figure 3 (A) Scatterplots illustrating changes in anti-N (left), anti-S (middle) and anti-RBD (right) IgG over time in COVID-19 subjects that donated 3 blood samples over approximately 100 days following the onset of their symptoms (n = 76). Data for each subject are plotted with sequential draws from an individual linked by connecting lines. Instead of plotting by draw number as in Figure 3 the exact draw time was used. Sustainers are highlighted in red and decayers are displayed in black. The black dashed lines represent twice the average of negative controls as described in Figure 1. (B) Alternative display of the data in (A), normalizing the anti-SARS-CoV-2 IgG levels of the second and third blood collection as a percent of the value in the first blood samples (baseline) for that subject. (C–F) Comparison of blood draw time for seroconverted (n = 64) anti-S IgG sustainers and decayers (left panels, C and E) and anti-RBD IgG sustainers and decayers (right panels, D and F) relative to symptom onset (top panels, C and D) or relative to symptom resolution (bottom panels, E and F). No significant differences were found in draw times by Mann-Whitney U test except for ((D) draw 1. *p < 0.05.
Figure S4
Figure S4
Correlation Scatterplots for All IgG Durability Indices and Direct Comparison of Clinical Parameters between Sustainers and Decayers, Related to Figure 3 Scatterplots illustrating all correlations in Figure 3F. Correlations are shown for (A) anti-N and anti-S durability indices, (B) anti-N and anti-RBD durability indices, (C) anti-N durability index and age, (D) anti-N durability index and BMI, (E) anti-N durability index and symptom severity, (F) anti-N durability index and symptom duration, (G) anti-S and anti-RBD durability indices, (H) anti-S durability index and age, (I) anti-S durability index and BMI, (J) anti-S durability index and symptom severity, (K) anti-RBD durability index and age, (L) anti-RBD durability index and BMI, (M) anti-RBD durability index and symptom severity, (N) age and BMI, (O) age and symptom severity, (P) age and symptom duration, (Q) BMI and symptom severity, (R) BMI and symptom duration, and (S) symptom severity and symptom duration. Included at the top of each plot is the r value and significance level determined by Spearman correlation analysis. (T&U) Comparisons of age (left), BMI (center), and symptom severity (right) between anti-S IgG (T) and anti-RBD IgG (U) sustainers (n = 20, and n = 17) and decayers (n = 17, and n = 55). Sustainers are shown in red and decayers in black. (V) Alternative presentation of Figure 3B, with each point colored to indicate the initial antibody level for that subject. White dots had an initial antibody level falling within the first quartile of measured values (lowest), blue the second quartile, yellow the third quartile, and red the fourth quartile. The dashed line at 2° (i.e., 1) separates sustainers and decayers. In this version, n = 72 as the four subjects negative for SARS-CoV-2 antibody were excluded to maintain consistency with the analysis in Figures 3F–3L. Significance testing for (T) and (U) used the Mann-Whitney U test, no significant differences found.
Figure S5
Figure S5
Comparison of Functional Antibody Data for Sustainers and Decayers, Related to Figure 3 (A and B) Comparison of ACE2-binding inhibition titers and durability indices of anti-S (A) sustainers (red, n = 20) and decayers (black, n = 49) as well as anti-RBD (B) sustainers (n = 17) and decayers (n = 52) described in Figure 3. The ACE2 inhibition durability index was calculated by dividing the 50% inhibitory concentration (IC50) titer in draw 3 by the IC50 titer in draw 1 for subjects with titers exceeding negative controls. The dashed line at 2° (i.e., 1) indicates stable ACE2-inihibition ability across draws 1 and 3. (C) 50% neutralization titers (NT50) at draws 1 and 3 from an automated, high-throughput (green circles, draw 1 n = 86 and draw 3 n = 55) or conventional pseudovirus neutralization assay (gold circles, draw 1 n = 91 and draw 3 n = 76), with the dashed line indicating limit of detection. (D) Spearman correlation analysis correlating conventional draw 1 NT50 values (Neut. Titer, n = 91) or NT50 durability index (Neut. durability index, n = 64) and clinical parameters displayed in a grid. For each correlation, the r value is given and significance levels are given. Red color intensity indicates strength of positive correlation, intensity of blue indicates strength of negative correlation. (E) Box and whisker plots illustrating differences in the distributions of values in each antibody measure dataset for the COVID-19 cohort. N IgG, S IgG and RBD IgG are IgG levels as measured by ELISA (n = 92 for draws 1 and 3). ACE2 inh. is the IC50 titer for ACE2-binding inhibition assay (n = 69 for draw 1, n = 68 for draw 3). HT neut. is NT50 value as measured by the high-throughput neutralization assay (n = 86 for draw 1, n = 55 for draw 3). Conv. neut. is NT50 measured by a conventional pseudovirus neutralization assay (n = 91 for draw 1, n = 76 for draw 3). Each value was log transformed and divided by the mean value for that measure. A broader distribution indicates higher variance in the distribution. (F–I) Analysis of differences in high-throughput neutralization titers (F and G) and conventional neutralization titers (H and I) between anti-S (F and H) and anti-RBD (G and I) sustainers and decayers as described for ACE2 binding inhibition in (A) and (B). Significance testing for all comparisons used the Mann-Whitney U test. Significance is reported in the panels, ns is not significant, p < 0.05, ∗∗p < 0.01, ∗∗∗p < 0.001, and ∗∗∗∗p < 0.0001.
Figure 4
Figure 4
Naive CD4+ T Cells Are Reduced in Sustainers (A) Representative flow plots illustrating the gating strategy used to define the CD4 T cell (CD3+CD8CD4+) populations measured, including naive (CD45RA+CD27+CCR7+), central memory (CM, CD45RACD27+CCR7+), effector memory 1 (EM1, CD45RACD27+CCR7), effector memory 2 (EM2, CD45RACD27CCR7+), effector memory 3 (EM3, CD45RACD27CCR7), CD45RA+ effector memory (EMRA, CD45RA+CD27CCR7), circulating Tfh (cTfh, CD45RAPD1+CXCR5+), and activated cTfh (CD45RAPD1+CXCR5+CD38+ICOS+). (B and C) Quantification of the CD4+ T cell populations among PBMCs from sustainers (n = 11) and decayers (n = 10) in draw 1 (B) and draw 3 (C). Means are represented as horizontal lines in the plots. Mann-Whitney U test. p < 0.05, ∗∗p < 0.01.
Figure S6
Figure S6
Comparison CD8 T Cells between Sustainers and Decayers, Related to Figure 4 (A) Representative flow plots illustrating the gating strategy used to define the CD8 T cell (CD3+CD4-CD8+) populations measured, including naive (CD45RA+CD27+CCR7+CD95), central memory (CM, CD45RACD27+CCR7+), effector memory 1 (EM1, CD45RACD27+CCR7), effector memory 2 (EM2, CD45RACD27CCR7+), effector memory 3 (EM3, CD45RACD27CCR7), and CD45RA+ effector memory (EMRA, CD45RA+CD27CCR7). (B–F) Quantification of the CD8 T cell populations among PBMCs from sustainers (n = 11) and decayers (n = 10) in draw 1 (E) and draw 3 (F). Means are represented as horizontal lines in the plots. No significant differences were found by Mann-Whitney U test.
Figure S7
Figure S7
Confirmation that S-Binding CD19+IgM-IgD-CD27+IgG+ Cells Are Not Plasmablasts and Comparison of Clinical and Antibody Features of Sustainers and Decayers Included in Antibody Sequence Analysis, Related to Figure 5 (A–C) PBMCs from the first blood draw from sustainers (red, n = 9) and decayers (black, n = 12) were analyzed by flow cytometry to ascertain whether spike-binding CD19+ cells (IgM-IgD-CD27+IgG+Spike+) are memory cells or plasmablasts in subjects analyzed for SHM. (A) Flow plots illustrating the gating strategy to determine the spike-binding CD19+ cell type are shown on top, with sequential gating shown left to right. IgM-IgD-CD27+IgG+Spike+ cells were analyzed for CD20 and CD38 expression to identify memory cells (CD20+ CD38int/-) and plasmablasts (CD20-CD38Hi). Bottom plots show a second gating approach to confirm that plasmablasts (CD20-CD27+CD38Hi) could be identified among PBMCs from the same subjects using this antibody panel. (B) Quantitation of the proportion of IgM-IgD-CD27+IgG+Spike+ memory cells (Mem.) or plasmablasts (PB) among the sustainers and decayers. (C) Quantitation of total plasmablasts as a proportion of all live CD19+ cells for sustainers and decayers. (D–Q) Comparison of (D) symptom duration, (E) age, (F) BMI, (G) severity, (H) timing of initial blood draw relative to symptom onset, (I) timing of third blood draw relative to symptom onset, (J) initial anti-S IgG level, (K) initial anti-RBD IgG level, (L) anti-S durability index, (M) anti-RBD durability index, (N) ACE2-inhibition durability index, (O) conventional neutralization durability index, (P) timing of initial blood draw relative to symptom onset, and (Q) timing of third blood draw relative to symptom onset between the sustainers (red, n = 12) and decayers (black, n = 13) included in the analysis of S-specific memory B cell IgH sequences (Figure 6). (R) Dot plots (left) and box and whisker plots (right) showing mutation numbers per sequence in the VH of sorted S+ single memory B cells with less than 15 VH mutations from sustainers (red, n = 12) and decayers (black, n = 13). Significance testing for initial antibody levels used Student’s t test on log transformed data. Significance testing for all other comparisons used the Mann-Whitney U test. Significance is reported in the panels, ns not significant, p < 0.05, ∗∗p < 0.01, ∗∗∗p < 0.001, and ∗∗∗∗p < 0.0001.
Figure 5
Figure 5
Increased Early SHM in S-Specific Memory B Cells from Sustainers (A) Cytometric gating strategy for anti-SARS-CoV-2 S-specific IgG memory B cell (IgG Mem. B cells, DAPICD19+IgMIgDIgG+CD27+Spike+) sorting from CD19+ enriched PBMCs from a representative negative control subject (top) and a COVID-19 convalescent subject (bottom). Sequential gating events are shown left to right. (B) Summary data for the percent of S+ IgG memory B cells among IgG+ memory cells from draws 1 and 3 of sustainers (red, draw 1: n = 12 and draw 3: n = 11) and decayers (black, draw 1: n = 13 and draw 3: n = 10). Kruskal-Wallis test showed no significant differences. (C) Dot plots (left) and box and whisker plots (right) showing mutation numbers per sequence in the heavy chain V gene segment (VH) of sorted S+ single memory B cells from sustainers and decayers. For draw 1, 93 productive clones were obtained from 10 sustainers and 143 productive clones from 12 decayers. For draw 3, 80 productive clones were obtained from 9 sustainers and 124 productive clones from 10 decayers. Kruskal-Wallis test. (D) Donut charts illustrating percent of VH sequences in (C) with <15 mutation (gray) or ≥15 mutation (shades of blue) for sustainers and decayers. Fifteen represents the 90th percentile for VH mutation distribution. Shades of blue represent sequences contributed by a single subject. Fisher’s exact test. (E) Analysis of mutation frequency in light chain V gene segments (VL) as described for VH in (C). Draw 1 includes 93 productive clones from sustainers and 138 from decayers. Draw 3 includes 89 productive clones from sustainers and 113 from decayers. (F) Donut charts illustrating the percent of VL sequences in (E) with <10 mutation (gray) or ≥10 mutation (shades of blue) for sustainers and decayers. Ten represents the 90th percentile for VL mutation distribution. Shades of blue represent sequences contributed by a single subject. Fisher’s exact test. (G) V gene segment usage among all analyzed heavy chain clones for sustainers (red bars) and decayers (black bars) in draw 1 (top) and draw 3 (bottom). Medians are represented as horizontal lines. For (A–G), ns, not significant; p < 0.05, ∗∗p < 0.01, ∗∗∗p < 0.001, and ∗∗∗∗p < 0.0001.
Figure 6
Figure 6
Individuals with Stable Antibody at ∼100 Days Maintain Antibody Levels at ∼145 Days (A) Blood collection timeline as in Figure 3A, with the addition of the 4th blood draw plot (purple, n = 68). (B) Analysis strategy in this figure. Draw 4 durability index analysis for subjects grouped by draw 3-defined antibody durability indices. (C) Plots comparing the magnitudes (left) and durability (right) of total anti-SARS-CoV-2 IgGs (top), pseudovirus neutralization titers (middle), and ACE2 binding inhibition titers (bottom) for draw 3-defined anti-S IgG sustainers and decayers (n = 16 sustainers and n = 48 decayers). Dashed lines for total antibody levels represent the positivity cutoff described above and the limit of neutralization detection. (D) Plots are as described for (C), with draw 3-defined anti-RBD IgG sustainers (n = 15) and decayers (n = 49). Student’s t test was used for significance testing of differences in total antibody levels following a log transformation. All other significance testing used the Mann-Whitney U test. ns, not significant; p < 0.05, ∗∗p < 0.01, ∗∗∗p < 0.001, and ∗∗∗∗p < 0.0001. Horizontal lines indicate medians.
Figure 7
Figure 7
Reanalysis Using 4th Draw Durability Indices Confirms that Sustained Antibody Production Correlates with Reduced Symptom Duration (A) Analysis strategy in this figure. Subjects are grouped based on their 4th draw antibody durability indices and analyzed based on 4th draw antibody measures. (B) Venn diagram illustrating the overlap between draw 3-defined and draw 4-defined sustainer groups by anti-S IgG durability indices (left) or anti-RBD durability indices (right). (C) Scatterplots illustrating the correlations between the 4th draw anti-S durability index and the duration of COVID-19 symptoms, with r and significance from Spearman correlation. A dot plot comparing symptom duration between draw 4 anti-S IgG sustainers (n = 14) and decayers (n = 50) is given on the right. (D) Plots as in (C) with draw 4-defined anti-RBD IgG durability for sustainers (n = 16) and decayers (n = 48). (E) Plots comparing the magnitudes (left) and durability (right) of total anti-SARS-CoV-2 IgGs (top), pseudovirus neutralization titers (middle), and ACE2 binding inhibition titers (bottom) for sustainers and decayers as defined by draw 4 anti-S IgG. Dashed lines for total antibody levels represent the positivity cutoff described above and for neutralization the limit of detection. (F) Plots are as described for (E), with sustainers and decayers as defined by draw 4 anti-RBD IgG. Student’s t test was used for significance testing of differences in total antibody levels following a log transformation of the values. All other significance testing for differences in symptom duration used the Mann-Whitney U test. ns, not significant; p < 0.05, ∗∗p < 0.01, ∗∗∗p < 0.001, and ∗∗∗∗p < 0.0001. Horizontal lines indicate medians.

References

    1. Amanna I.J., Carlson N.E., Slifka M.K. Duration of humoral immunity to common viral and vaccine antigens. N. Engl. J. Med. 2007;357:1903–1915. - PubMed
    1. Balaz M., Becker A.S., Balazova L., Straub L., Muller J., Gashi G., Maushart C.I., Sun W., Dong H., Moser C. Inhibition of Mevalonate Pathway Prevents Adipocyte Browning in Mice and Men by Affecting Protein Prenylation. Cell Metab. 2019;29:901–916.e8. - PubMed
    1. Beaudoin-Bussières G., Laumaea A., Anand S.P., Prévost J., Gasser R., Goyette G., Medjahed H., Perreault J., Tremblay T., Lewin A. Decline of humoral responses against SARS-CoV-2 spike in convalescent individuals. MBio. 2020;11:e02590-20. - PMC - PubMed
    1. Brouwer P.J.M., Caniels T.G., van der Straten K., Snitselaar J.L., Aldon Y., Bangaru S., Torres J.L., Okba N.M.A., Claireaux M., Kerster G. Potent neutralizing antibodies from COVID-19 patients define multiple targets of vulnerability. Science. 2020;369:643–650. - PMC - PubMed
    1. Brown E.P., Licht A.F., Dugast A.S., Choi I., Bailey-Kellogg C., Alter G., Ackerman M.E. High-throughput, multiplexed IgG subclassing of antigen-specific antibodies from clinical samples. J. Immunol. Methods. 2012;386:117–123. - PMC - PubMed

Publication types