. 2021 Jan:67:101860.
doi: 10.1016/j.media.2020.101860. Epub 2020 Oct 15.

AI-driven quantification, staging and outcome prediction of COVID-19 pneumonia

Affiliations

AI-driven quantification, staging and outcome prediction of COVID-19 pneumonia

Guillaume Chassagnon et al. Med Image Anal. 2021 Jan.

Abstract

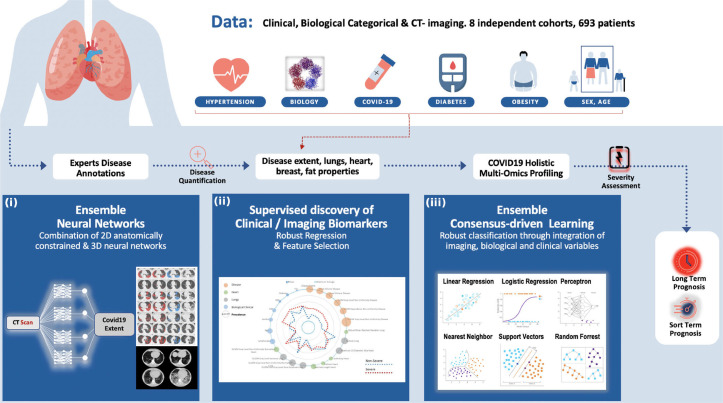
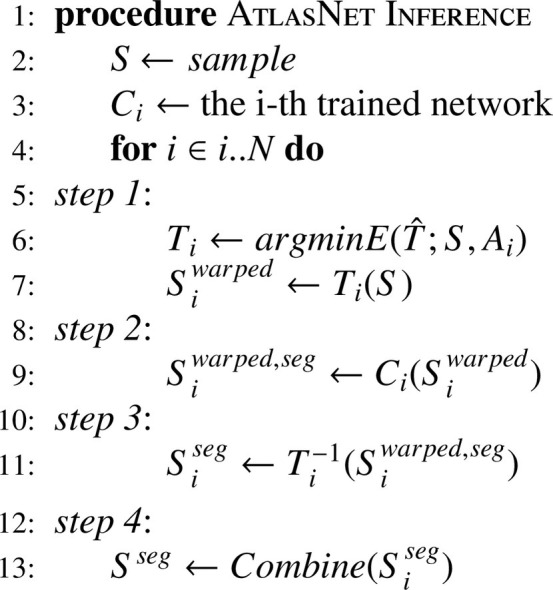
Coronavirus disease 2019 (COVID-19) emerged in 2019 and disseminated around the world rapidly. Computed tomography (CT) imaging has been proven to be an important tool for screening, disease quantification and staging. The latter is of extreme importance for organizational anticipation (availability of intensive care unit beds, patient management planning) as well as to accelerate drug development through rapid, reproducible and quantified assessment of treatment response. Even if currently there are no specific guidelines for the staging of the patients, CT together with some clinical and biological biomarkers are used. In this study, we collected a multi-center cohort and we investigated the use of medical imaging and artificial intelligence for disease quantification, staging and outcome prediction. Our approach relies on automatic deep learning-based disease quantification using an ensemble of architectures, and a data-driven consensus for the staging and outcome prediction of the patients fusing imaging biomarkers with clinical and biological attributes. Highly promising results on multiple external/independent evaluation cohorts as well as comparisons with expert human readers demonstrate the potentials of our approach.

Keywords: Artifial intelligence; Biomarker discovery; COVID 19 pneumonia; Deep learning; Ensemble methods; Prognosis; Staging.


Conflict of interest statement

Declaration of Competing Interest The authors declare that they have no known competing financial interests or personal relationships that could have appeared to influence the work reported in this paper.

Figures

None
Graphical abstract
Fig. 1
Fig. 1
Overview of the method for automatic quantification, staging and prognosis of COVID-19. Our study includes 8 independent cohorts, resulting in 693 COVID-19 patients in total. A variety of clinical and biological attributes were collected and combined with imaging biomarkers for short and long term prognosis of COVID-19 patients. Our study is composed by three different steps: (i) Proposing a state-of-the-art deep learning based consensus of 2D & 3D networks for automatic quantification of COVID-19 disease, reaching expert-level annotations, (ii) A radiomics study integrating interpretable features extracted from disease, lung and heart regions. A consensus-driven COVID-19 low dimensional bio(imaging)-holistic profiling and staging signature has been proposed using robust machine learning algorithms, fusing imaging, clinical and biological attributes. & (iii) An ensemble of robust linear & non-linear classification methods for the proper identification of patients that need intubation.
Algorithm 1
Algorithm 1
AtlasNet inference.
Fig. 2
Fig. 2
Correlation between body mass index (BMI) and fat ratio.
Fig. 3
Fig. 3
Training and validation curves for one template/ atlas (Ai) of CovidE2D and the CovidE3D.
Fig. 4
Fig. 4
Box-Plot in terms of DSC and HD between CovidENet and its individual components, Obs1 & Obs2. One can observe that CovidENet (blue) performs better and closer to Obs1-Obs2 (red) DSC and HD metrics than its individual components CovidE2D & CovidE3D. (For interpretation of the references to color in this figure legend, the reader is referred to the web version of this article.)
Fig. 5
Fig. 5
Plots indicating the correlation between the average disease extent measured from CovidE2D, CovidE3D and CovidENet respectively and the manual segmentation. Disease extent is expressed as the percentage of lung affected by the disease. The red line shows a perfect correlation (Spearman R=1). Spearman correlation coefficients are displayed for each comparison. (For interpretation of the references to color in this figure legend, the reader is referred to the web version of this article.)
Fig. 6
Fig. 6
Qualitative analysis for the comparison between manual and the proposed CovidENet disease quantification. Delineation of the diseased areas on chest CT in different slices of COVID-19 patients. From left to right: Input, CovidENet-segmentation, Obs1-segmentation, Obs2-segmentation.
Fig. 7
Fig. 7
COVID-19 Holistic Multi-Omics Signature & Staging: Spider chart representing average profiles (average values of the variables after normalization between 0 and 1) with respect to severe versus non-severe separation are shown along with prevalence of biomarkers (diameter of the circle). The prevalence of the biomarker corresponds here to the number of selections of the biomarker during the feature selection process. Classification performance, confusion matrices and area under the curve with respect to the proposed method and the consensus of expert readers (reader+) are reported on the right side. Selective associations of features with outcome (NS/S) are shown at the top right of the figure (box plots).
Fig. 8
Fig. 8
Short & Long Term Prognosis. Spider chart representing average profiles (average values of the variables after normalization between 0 and 1) with respect to the short deceased (SD), long deceased (LD) and long recovered (LR) classes are shown along with their correlations with the outcome (diameter of the circle). The presented correlation corresponds to Pearson Correlation for LR/LD outcome (Table 5). Classification performance, confusion matrices and area under the curve with respect to the proposed method and - when feasible - the consensus of expert readers (reader+) are reported on the right side. ROC curves correspond to one-vs-all classification of the SD/LR/LD patients. Selective associations of features with final outcome (LD/LR) are shown at the bottom of the figure (box plots).

References

    1. Abadi, M., Agarwal, A., Barham, P., Brevdo, E., Chen, Z., Citro, C., Corrado, G. S., Davis, A., Dean, J., Devin, M., Ghemawat, S., Goodfellow, I. J., Harp, A., Irving, G., Isard, M., Jia, Y., Józefowicz, R., Kaiser, L., Kudlur, M., Levenberg, J., Mané, D., Monga, R., Moore, S., Murray, D. G., Olah, C., Schuster, M., Shlens, J., Steiner, B., Sutskever, I., Talwar, K., Tucker, P. A., Vanhoucke, V., Vasudevan, V., Viégas, F. B., Vinyals, O., Warden, P., Wattenberg, M., Wicke, M., Yu, Y., Zheng, X., 2016. Tensorflow: large-scale machine learning on heterogeneous distributed systems. CoRR abs/1603.04467
    1. Anthimopoulos M., Christodoulidis S., Ebner L., Christe A., Mougiakakou S. Lung pattern classification for interstitial lung diseases using a deep convolutional neural network. IEEE Trans. Med. Imaging. 2016;35(5):1207–1216. - PubMed
    1. Anthimopoulos M., Christodoulidis S., Ebner L., Geiser T., Christe A., Mougiakakou S. Semantic segmentation of pathological lung tissue with dilated fully convolutional networks. IEEE J. Biomed. Health Inform. 2018;23(2):714–722. - PubMed
    1. Badrinarayanan V., Kendall A., Cipolla R. Segnet: a deep convolutional encoder-decoder architecture for image segmentation. IEEE Trans. Pattern Anal. Mach. Intell. 2017;39(12):2481–2495. - PubMed
    1. Bai, X., Fang, C., Zhou, Y., Bai, S., Liu, Z., Xia, L., Chen, Q., Xu, Y., Xia, T., Gong, S., et al., 2020. Predicting COVID-19 malignant progression with ai techniques. - PMC - PubMed

Publication types