. 2020 Nov 10;12(21):20946-20967.
doi: 10.18632/aging.202176. Epub 2020 Nov 10.

Sirtuin 6 deficiency induces endothelial cell senescence via downregulation of forkhead box M1 expression

Affiliations

Sirtuin 6 deficiency induces endothelial cell senescence via downregulation of forkhead box M1 expression

Ok-Hee Lee et al. Aging (Albany NY). .

Abstract

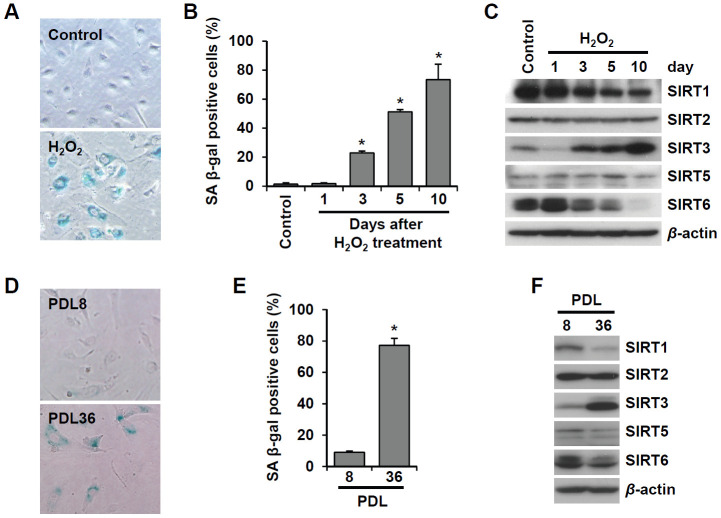
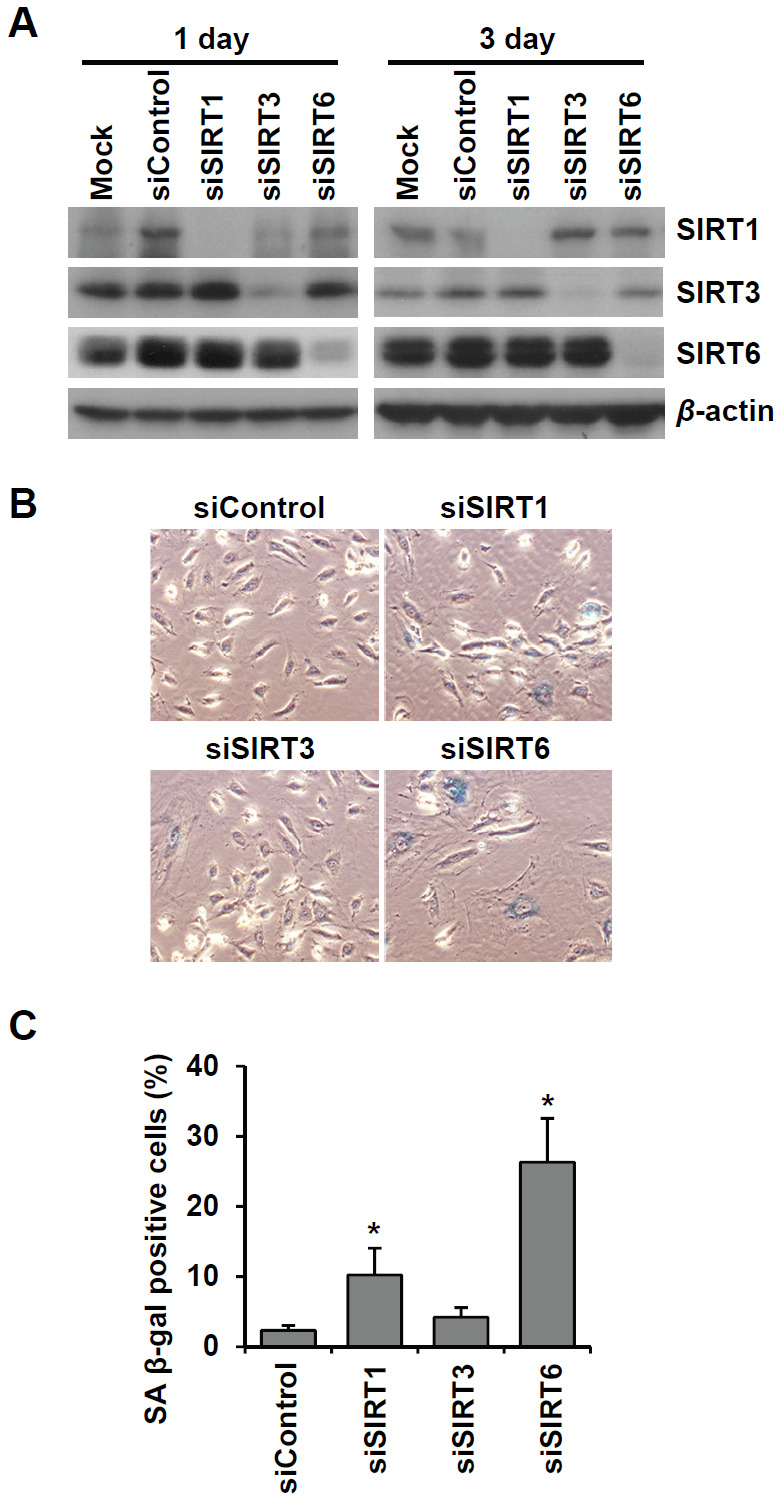
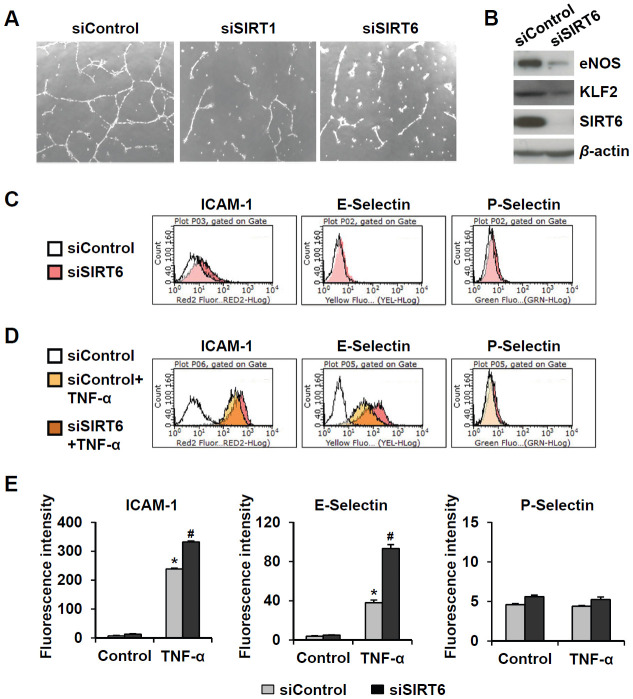
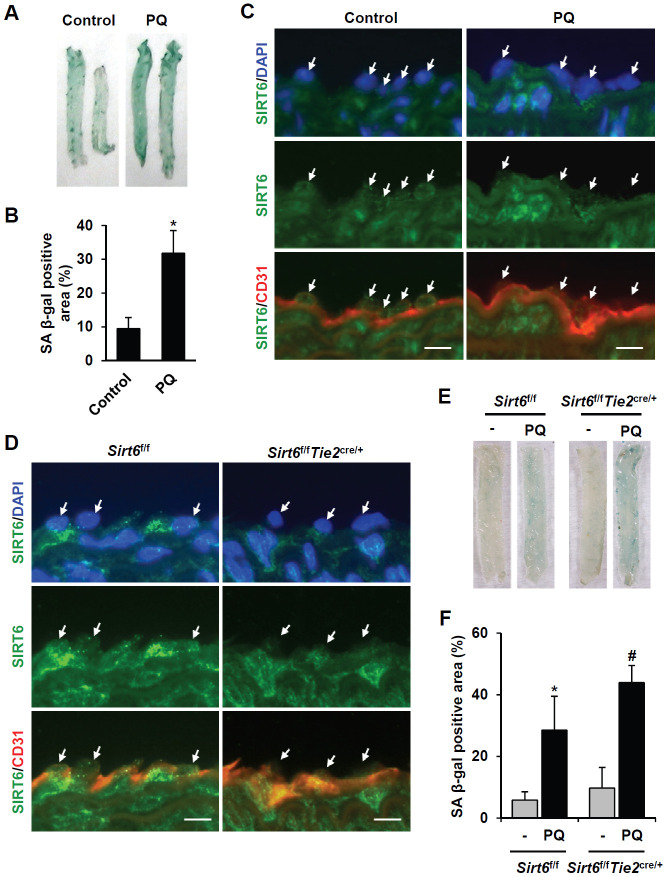
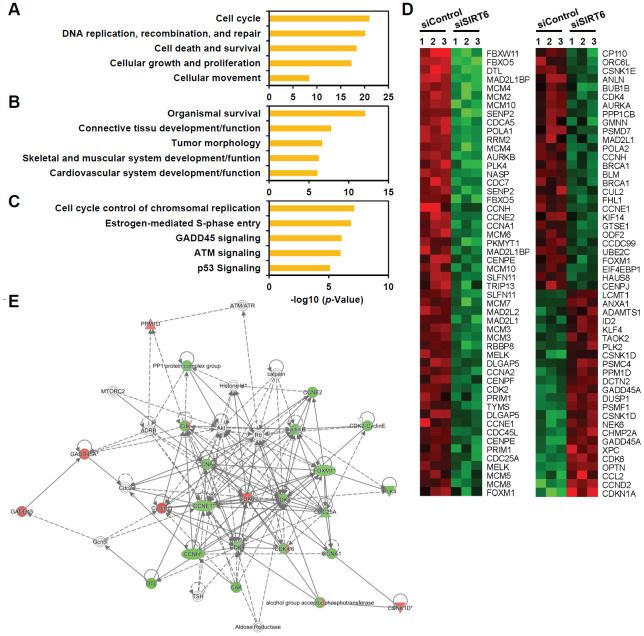
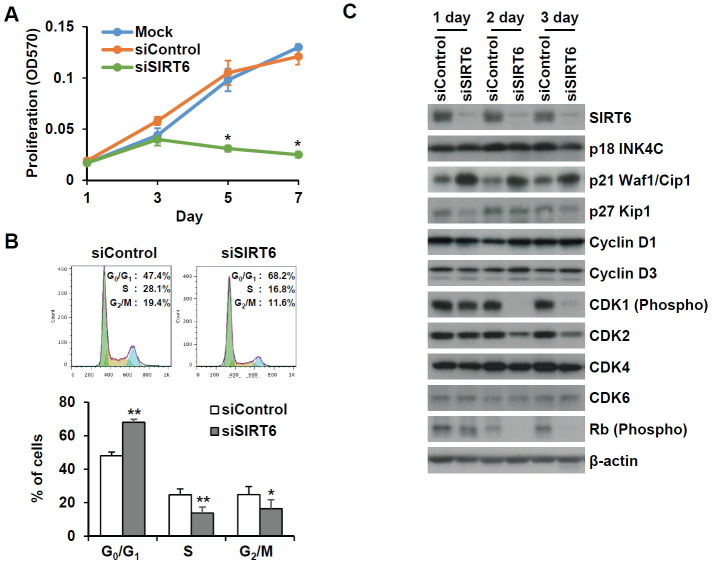
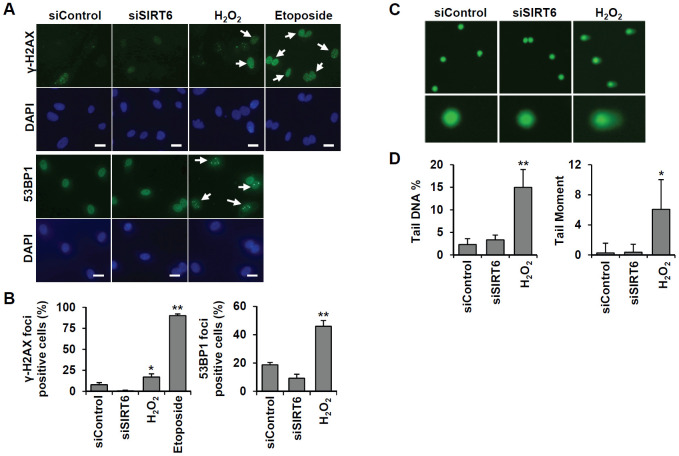
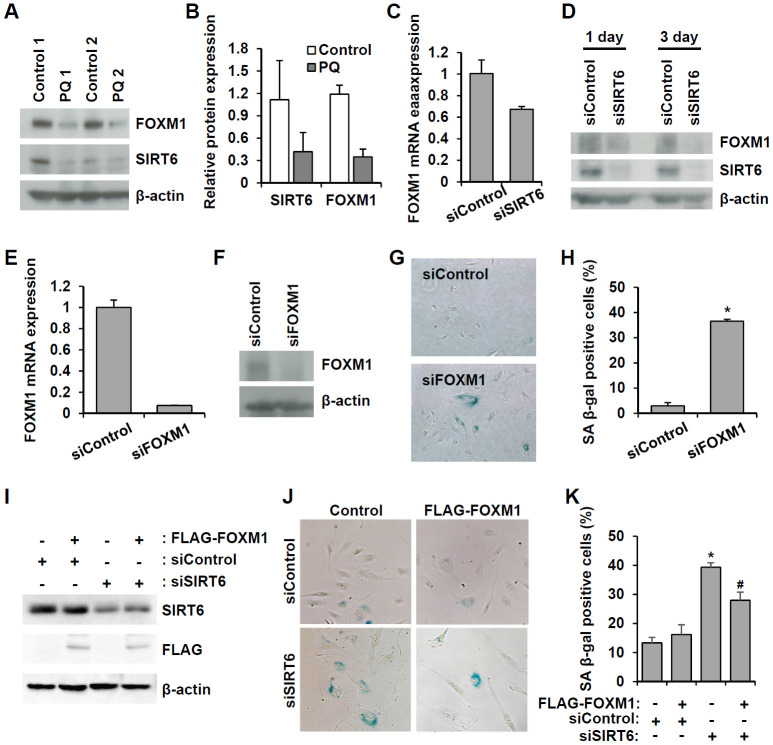
Cellular senescence of endothelial cells causes vascular dysfunction, promotes atherosclerosis, and contributes to the development of age-related vascular diseases. Sirtuin 6 (SIRT6), a conserved NAD+-dependent protein deacetylase, has beneficial effects against aging, despite the fact that its functional mechanisms are largely uncharacterized. Here, we show that SIRT6 protects endothelial cells from senescence. SIRT6 expression is progressively decreased during both oxidative stress-induced senescence and replicative senescence. SIRT6 deficiency leads to endothelial dysfunction, growth arrest, and premature senescence. Using genetically engineered endothelial cell-specific SIRT6 knockout mice, we also show that down-regulation of SIRT6 expression in endothelial cells exacerbates vascular aging. Expression microarray analysis demonstrated that SIRT6 modulates the expression of multiple genes involved in cell cycle regulation. Specifically, SIRT6 appears to regulate the expression of forkhead box M1 (FOXM1), a critical transcription factor for cell cycle progression and senescence. Overexpression of FOXM1 ameliorates SIRT6 deficiency-induced endothelial cell senescence. In this work, we demonstrate the role of SIRT6 as an anti-aging factor in the vasculature. These data may provide the basis for future novel therapeutic approaches against age-related vascular disorders.

Keywords: FOXM1; SIRT6; cell cycle; endothelial cell; senescence.


Conflict of interest statement

CONFLICTS OF INTEREST: The authors declare no conflicts of interest.

Figures

Figure 1
Figure 1
SIRT6 expression is inhibited in endothelial cells during oxidative stress-induced or replicative senescence. (A) Representative image of SA β-gal-positive HUVECs 10 d after the addition of H2O2 (200 μM). (B) The percentage of SA β-gal-positive senescent HUVECs that were treated with 200 μM H2O2 for 1 h and then cultured for the indicated time to generate oxidative stress-induced senescence. The data represent the mean percentage ± SD (n = 3). *P < 0.01 vs. control. (C) Western blot images to analyze the expression of SIRT1, SIRT2, SIRT3, SIRT5, and SIRT6 in HUVECs at 1, 3, 5, or 10 d after addition of H2O2 (200 μM). (D) SA β-gal staining images for young (PDL8) and old (PDL36) cells. (E) The percentage of SA β-gal-positive HUVECs that were passaged to induce replicative senescence. The data are shown as the mean ± SD (n = 3). *P < 0.01 vs. young cells. (F) The expression of SIRTs in young and old HUVECs. An antibody recognizing β-actin was used as a loading control.
Figure 2
Figure 2
Knockdown of SIRT6 expression induces endothelial cell senescence. (A) Western blot analysis showing the knockdown expression of SIRT1, SIRT3, and SIRT6 in HUVECs treated with SIRT1, SIRT3, and SIRT6 siRNAs, respectively. Total protein was extracted from cells 1 and 3 d after siRNA treatment. (B) The representative images obtained from SA β-gal-stained HUVECs. The cells transfected with the indicated siRNA (25 nM) were re-transfected with the siRNA 3 d after the first siRNA treatment. After 6 d from the first transfection, cells were stained for SA β-gal. (C) The percentage of SA β-gal-positive senescent cells at 6 d after siRNA transfection. The data are shown as the mean ± SD (n = 3). *P < 0.05 vs. control siRNA.
Figure 3
Figure 3
Downregulated expression of SIRT6 induces endothelial cell dysfunction. (A) Effect of SIRT6 siRNA on in vitro tube formation in HUVECs. HUVECs transfected with 25 nM of the indicated siRNA were cultured on Matrigel to check in vitro angiogenesis activity of endothelial cells. The representative micrographs of tube formation in HUVECs. (B) Western blot analysis showing the effect of SIRT6 siRNA on the expression of eNOS and KLF2. β-Actin was used as a loading control. (C, D) Representative flow cytometry plots showing the effect of SIRT6 knockdown on cell surface expression of ICAM-1, E-selectin, and P-selectin. HUVECs transfected with 25 nM control or SIRT6 siRNA were treated or not treated with TNF-α (50 ng/mL) for 4 h. Cells were stained with the fluorochrome-conjugated antibodies and analyzed by flow cytometry. (E) Graphs showing ICAM-1, E-selectin, and P-selectin expression levels in the cells. Data were obtained by analyzing the mean fluorescence intensity of each inflammatory molecule on HUVECs, which were differentially treated with control or SIRT6 siRNA in the absence and presence of TNF-α. *P < 0.01 vs. control siRNA. #P < 0.01 vs. control siRNA with TNF-α.
Figure 4
Figure 4
SIRT6 expression is downregulated in mouse senescent aorta, and endothelial-specific Sirt6 knockout in mouse deteriorates oxidative stress-induced senescence in the aorta. (A) Images from SA β-gal staining of thoracic aorta from C57/BL6 mice injected with PBS or PQ. (B) Graph showing the relative SA β-gal-positive areas in PBS- and PQ-treated thoracic aortas. SA β-gal-positive areas were quantified using ImageJ. The experiment was repeated twice. Data represent the mean percentage ± SD (n = 4). *P < 0.05 vs. control treatment. (C) Double immunofluorescence staining showing SIRT6 and CD31 expression in control and PQ-treated thoracic aortas. The sections were co-stained with anti-SIRT6 and anti-CD31 antibodies. DAPI was used to stain nuclei. Arrows indicate nuclei of endothelial cells. Scale bars represent 10 μm. (D) Double immunofluorescence staining confirming Sirt6 knockout in Sirt6f/fTie2cre/+ mouse thoracic aortas. The sections were co-stained with anti-SIRT6 and anti-CD31 antibodies. DAPI was used to stain nuclei. Arrows indicate nuclei of endothelial cells. Scale bars represent 10 μm. (E) Dissecting microscope images of thoracic aortas stained for SA β-gal. The thoracic aortas were obtained from Sirt6f/f and Sirt6f/fTie2cre/+ mice injected with PBS or PQ. (F) Relative SA β-gal-positive areas in the mouse thoracic aortas from Sirt6f/f and Sirt6f/fTie2cre/+ mice injected with PBS or PQ. The percentage of SA β-gal-positive areas was quantified using ImageJ. The experiment was repeated twice. Data are shown as the mean ± SD (n = 4). *P < 0.05 vs. control Sirt6f/f. #P < 0.05 vs. Sirt6f/f treated with PQ.
Figure 5
Figure 5
Genes associated with cell proliferation are the genes most affected by SIRT6 knockdown in endothelial cells. HUVECs were transfected with 25 nM of control or SIRT6 siRNA. After 3 d, total RNA was isolated, and the gene expression profile was assessed with the Illumina bead chip analysis. The identified genes that were differentially regulated by SIRT6 knockdown were analyzed by the Ingenuity Pathway Analysis program to determine the SIRT6 gene function in endothelial cells. (A, B) Top five groups of genes categorized by molecular and cellular functions (A) and physiological system development and function (B). (C) Top five canonical pathways affected by SIRT6 knockdown. (D) Heat map showing the genes specifically involved in cell cycle transition regulation. Rows show individual genes, and columns show triplicate samples. Up- and downregulated genes are shown in red and green, respectively. (E) A gene functional association network for the genes involved in cell cycle transition regulation. The intensity of the node colors (red and green) indicates the degree of up- and downregulation.
Figure 6
Figure 6
SIRT6 knockdown significantly induces cell proliferation in endothelial cells. (A) MTT assay showing the effect of SIRT6 knockdown on endothelial cell proliferation. HUVECs were transfected with 25 nM control or SIRT6 siRNA and incubated for the indicated number of days. *P < 0.01 vs. control siRNA. (B) Cell cycle analysis indicating that SIRT6 siRNA induces cell cycle arrest in endothelial cells. HUVECs were transfected with 25 nM control or SIRT6 siRNA. After 3 d, cells were stained with PI and analyzed using flow cytometry. Graphs show the mean percentage ± SD of cells in G0/G1, S, and G2/M phases. *P < 0.05 vs. control siRNA. **P < 0.01 vs. control siRNA. (C) Western blot analysis to determine the effect of SIRT6 knockdown on the expression of cell cycle regulators. β-Actin was used as a loading control.
Figure 7
Figure 7
SIRT6 knockdown does not directly induce DNA damage at the times when the cell cycle is inhibited. (A) Representative images for the effect of SIRT6 knockdown on the formation of DNA damage foci. HUVECs were transfected with 25 nM control or SIRT6 siRNA. H2O2 (200 μm) and etoposide (10 μm) were used as positive controls to induce DNA damage. After 3 d, cells were stained with anti-γ-H2AX and anti-53BP1 antibodies. DAPI was used to stain nuclei. Scale bars represent 20 μm. (B) Quantification of DNA-damaged cells. Cells with more than ten γ-H2AX or five 53BP1 foci were scored. Data are expressed as the mean ± SD (n = 3). *P < 0.05 vs. control siRNA. **P < 0.001 vs. control siRNA. (C) Comet images of HUVECs treated with control or SIRT6 siRNA. HUVECs were treated with 25 nM control or SIRT6 siRNA. After 3 d, dissociated single cells were subjected to alkaline comet assay. Cells treated with H2O2 for 1 h were used as positive control. (D) Analysis of comet images. Percent DNA in the tail and tail moment of damaged cells were quantified using OpenComet. Data are expressed as the mean ± SD (n = 3). *P < 0.05 vs. control siRNA. **P < 0.01 vs. control siRNA.
Figure 8
Figure 8
Downregulated SIRT6 expression inhibits FOXM1 expression, which is closely related to endothelial cell senescence. (A) Western blot analysis showing downregulation of FOXM1 and SIRT6 expression in thoracic aortas of mice treated with PBS or PQ. (B) Relative SIRT6 and FOXM1 protein expression in control and PQ-treated aortas. The protein expression was quantified using Bio-Rad Image Lab software. Relative expression was normalized to β-actin. (C) Real-time RT-PCR analysis indicating that SIRT6 knockdown transcriptionally inhibited FOXM1 expression. (D) Western blot analysis presenting the effect of SIRT6 knockdown on FOXM1 protein expression. (E) Real-time RT-PCR confirming the efficient knockdown of FOXM1 expression in endothelial cells by 25 nM FOXM1 siRNA. (F) Western blot analysis to show the knockdown of FOXM1 protein in FOXM1 siRNA-treated HUVECs. (G) Representative images of SA β-gal-positive senescent HUVECs that were transfected with control or FOXM1 siRNA. (H) Quantification of data from (G). The mean percentage of SA β-gal-positive cells was calculated, and error bars indicate SD (n = 3). *P < 0.001 vs. control siRNA. (I) Western blot analysis showing overexpression of FOXM1 in control or SIRT6 siRNA-treated endothelial cells. HUVECs were infected with 10 MOI of lentivirus vector encoding FLAG-tagged SIRT6. One day later, cells received the first transfection with 25 nM control or SIRT6 siRNA. Next, cells were transfected with the same siRNA 3 d after the first transfection. Six days after the first transfection, cells were analyzed for SIRT6 and FLAG-tagged FOXM1 expression. β-Actin was used as a loading control. (J) Representative images showing that overexpression of FOXM1 inhibited SIRT6 knockdown-induced endothelial cell senescence. Cells were stained for SA β-gal. (K) Quantification of data from (J). Data are expressed as the mean ± SD (n = 3). *P < 0.001 vs. control siRNA. #P < 0.01 vs. SIRT6 siRNA.

References

    1. Donato AJ, Machin DR, Lesniewski LA. Mechanisms of dysfunction in the aging vasculature and role in age-related disease. Circ Res. 2018; 123:825–48. 10.1161/CIRCRESAHA.118.312563 - DOI - PMC - PubMed
    1. Lakatta EG, Levy D. Arterial and cardiac aging: major shareholders in cardiovascular disease enterprises: part II: the aging heart in health: links to heart disease. Circulation. 2003; 107:346–54. 10.1161/01.cir.0000048893.62841.f7 - DOI - PubMed
    1. van Bussel BC, Schouten F, Henry RM, Schalkwijk CG, de Boer MR, Ferreira I, Smulders YM, Twisk JW, Stehouwer CD. Endothelial dysfunction and low-grade inflammation are associated with greater arterial stiffness over a 6-year period. Hypertension. 2011; 58:588–95. 10.1161/HYPERTENSIONAHA.111.174557 - DOI - PubMed
    1. Jia G, Aroor AR, Jia C, Sowers JR. Endothelial cell senescence in aging-related vascular dysfunction. Biochim Biophys Acta Mol Basis Dis. 2019; 1865:1802–09. 10.1016/j.bbadis.2018.08.008 - DOI - PubMed
    1. Uryga AK, Bennett MR. Ageing induced vascular smooth muscle cell senescence in atherosclerosis. J Physiol. 2016; 594:2115–24. 10.1113/JP270923 - DOI - PMC - PubMed

Publication types