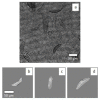
Learning Diatoms Classification from a Dry Test Slide by Holographic Microscopy
- PMID: 33171757
- PMCID: PMC7664373
- DOI: 10.3390/s20216353
Learning Diatoms Classification from a Dry Test Slide by Holographic Microscopy
Abstract
Diatoms are among the dominant phytoplankters in marine and freshwater habitats, and important biomarkers of water quality, making their identification and classification one of the current challenges for environmental monitoring. To date, taxonomy of the species populating a water column is still conducted by marine biologists on the basis of their own experience. On the other hand, deep learning is recognized as the elective technique for solving image classification problems. However, a large amount of training data is usually needed, thus requiring the synthetic enlargement of the dataset through data augmentation. In the case of microalgae, the large variety of species that populate the marine environments makes it arduous to perform an exhaustive training that considers all the possible classes. However, commercial test slides containing one diatom element per class fixed in between two glasses are available on the market. These are usually prepared by expert diatomists for taxonomy purposes, thus constituting libraries of the populations that can be found in oceans. Here we show that such test slides are very useful for training accurate deep Convolutional Neural Networks (CNNs). We demonstrate the successful classification of diatoms based on a proper CNNs ensemble and a fully augmented dataset, i.e., creation starting from one single image per class available from a commercial glass slide containing 50 fixed species in a dry setting. This approach avoids the time-consuming steps of water sampling and labeling by skilled marine biologists. To accomplish this goal, we exploit the holographic imaging modality, which permits the accessing of a quantitative phase-contrast maps and a posteriori flexible refocusing due to its intrinsic 3D imaging capability. The network model is then validated by using holographic recordings of live diatoms imaged in water samples i.e., in their natural wet environmental condition.
Keywords: classification; deep learning; diatoms; digital holography; environmental monitoring; marine pollution; microplankton; phase-contrast microscopy; taxonomy; water quality sensors.
Conflict of interest statement
The authors declare no conflict of interest.
Figures


References
-
- Shyamala G., Saravanakumar N. Water quality assessment–a review. Int. J. Mod. Trends Eng. Sci. 2017;4:39–43.
-
- Wua N., Dong X., Liu Y., Wang C., Baattrup-Pedersen A., Riis T. Using river microalgae as indicators for freshwater biomonitoring: Review of published research and future directions. Ecol. Indic. 2017;81:124–131. doi: 10.1016/j.ecolind.2017.05.066. - DOI
-
- Piper J. A review of high-grade imaging of diatoms and radiolarians in light microscopy optical- and software-based techniques. Diatom Res. 2011;26:57–72. doi: 10.1080/0269249X.2011.587377. - DOI
-
- Bedoshvili Y.D., Popkova T.P., Likhoshway Y.V. Chloroplast structure of diatoms of different classes. Cell Tiss. Biol. 2009;3:297–310. doi: 10.1134/S1990519X09030122. - DOI
MeSH terms
Grants and funding
LinkOut - more resources
Full Text Sources

