. 2021 Feb 1;27(3):852-864.
doi: 10.1158/1078-0432.CCR-20-1192. Epub 2020 Nov 10.

Proteogenomic Analysis of Salivary Adenoid Cystic Carcinomas Defines Molecular Subtypes and Identifies Therapeutic Targets

Affiliations

Proteogenomic Analysis of Salivary Adenoid Cystic Carcinomas Defines Molecular Subtypes and Identifies Therapeutic Targets

Renata Ferrarotto et al. Clin Cancer Res. .

Erratum in

Abstract

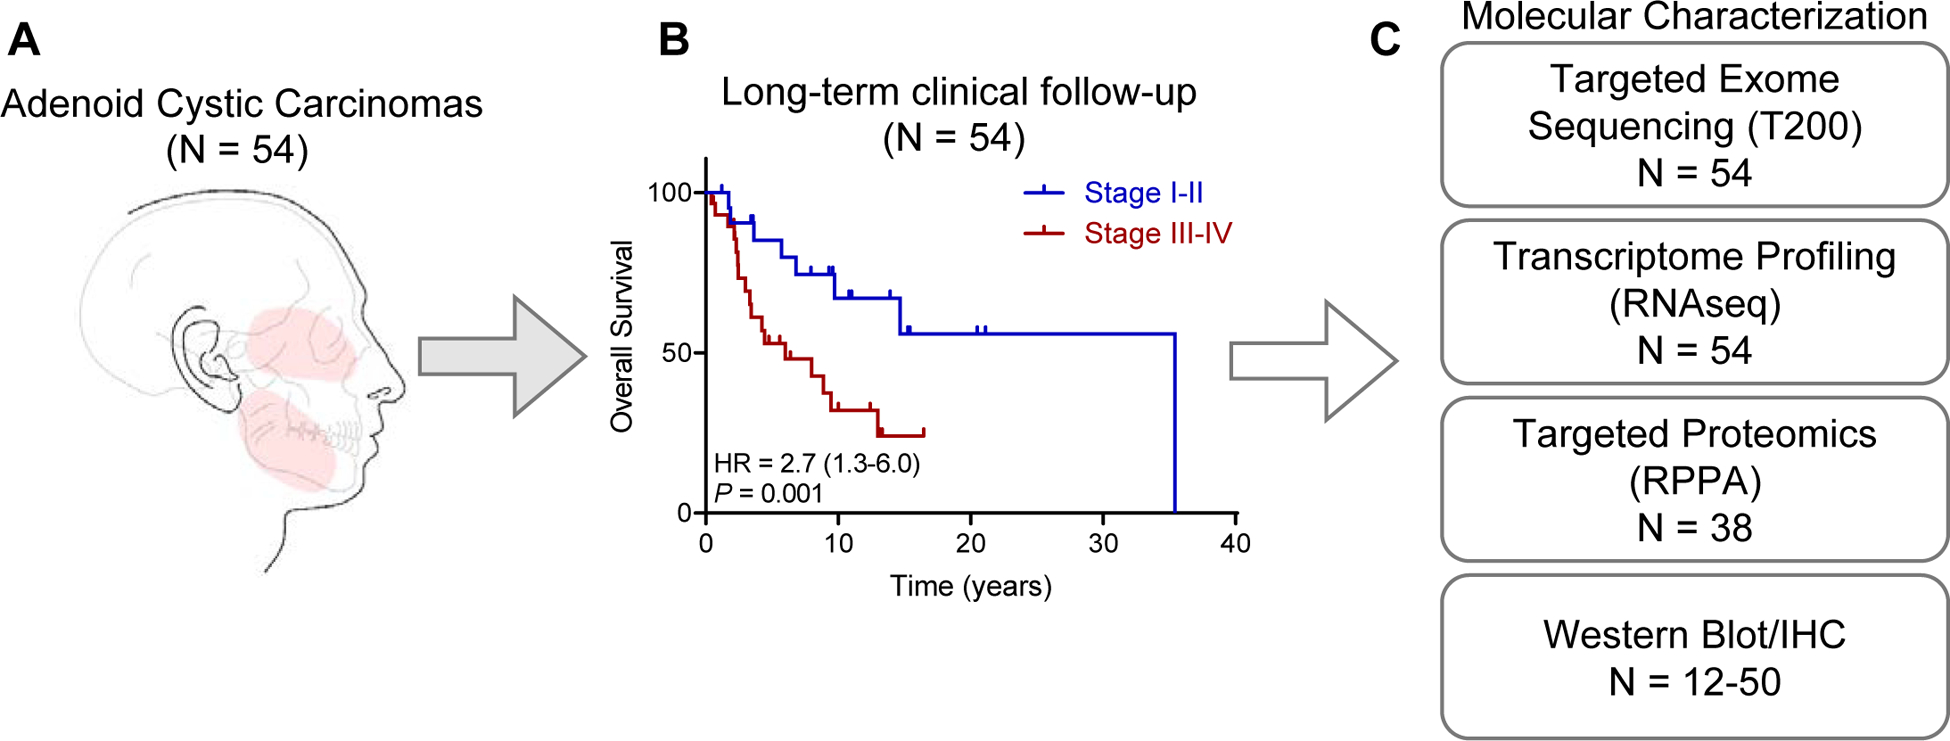
Purpose: Salivary gland adenoid cystic carcinoma (ACC) has heterogeneous clinical behavior. Currently, all patients are treated uniformly, and no standard-of-care systemic therapy exists for metastatic ACC. We conducted an integrated proteogenomic analyses of ACC tumors to identify dysregulated pathways and propose a classification with therapeutic implications.

Experimental design: RNA/DNA sequencing of 54 flash-frozen salivary ACCs and reverse phase protein array (RPPA) in 38 specimens were performed, with validation by Western blotting and/or IHC. Three independent ACC cohorts were used for validation.

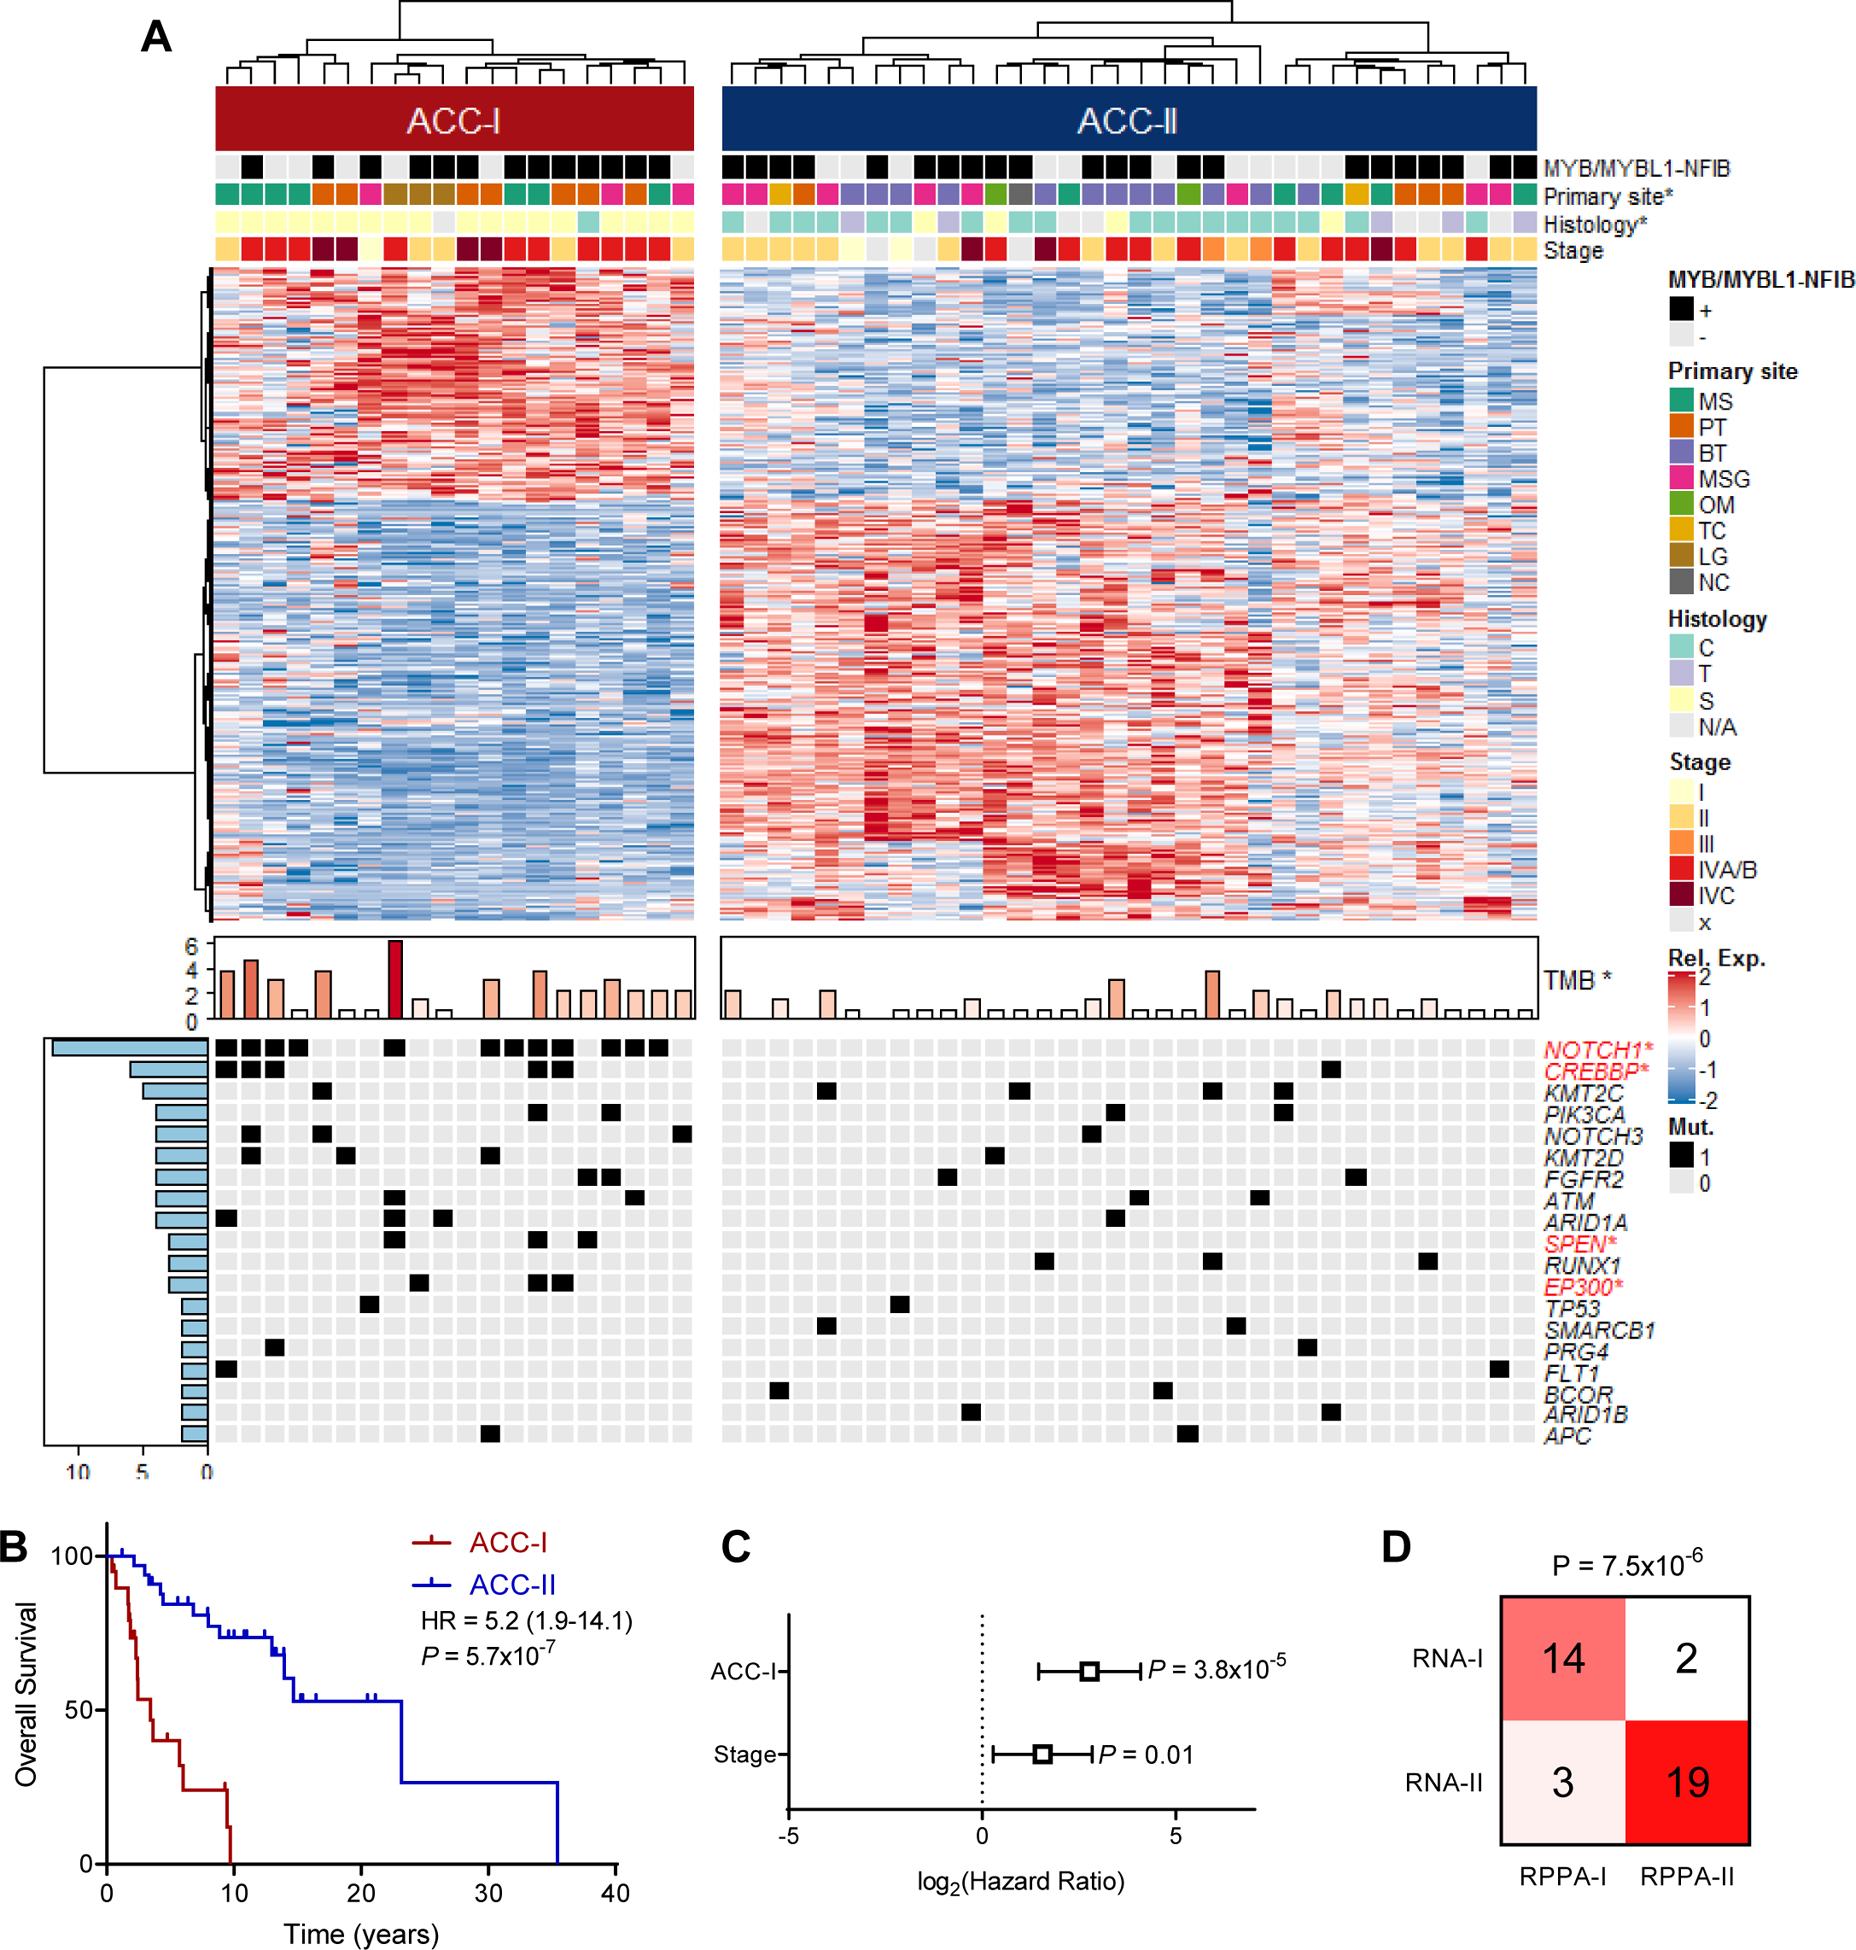
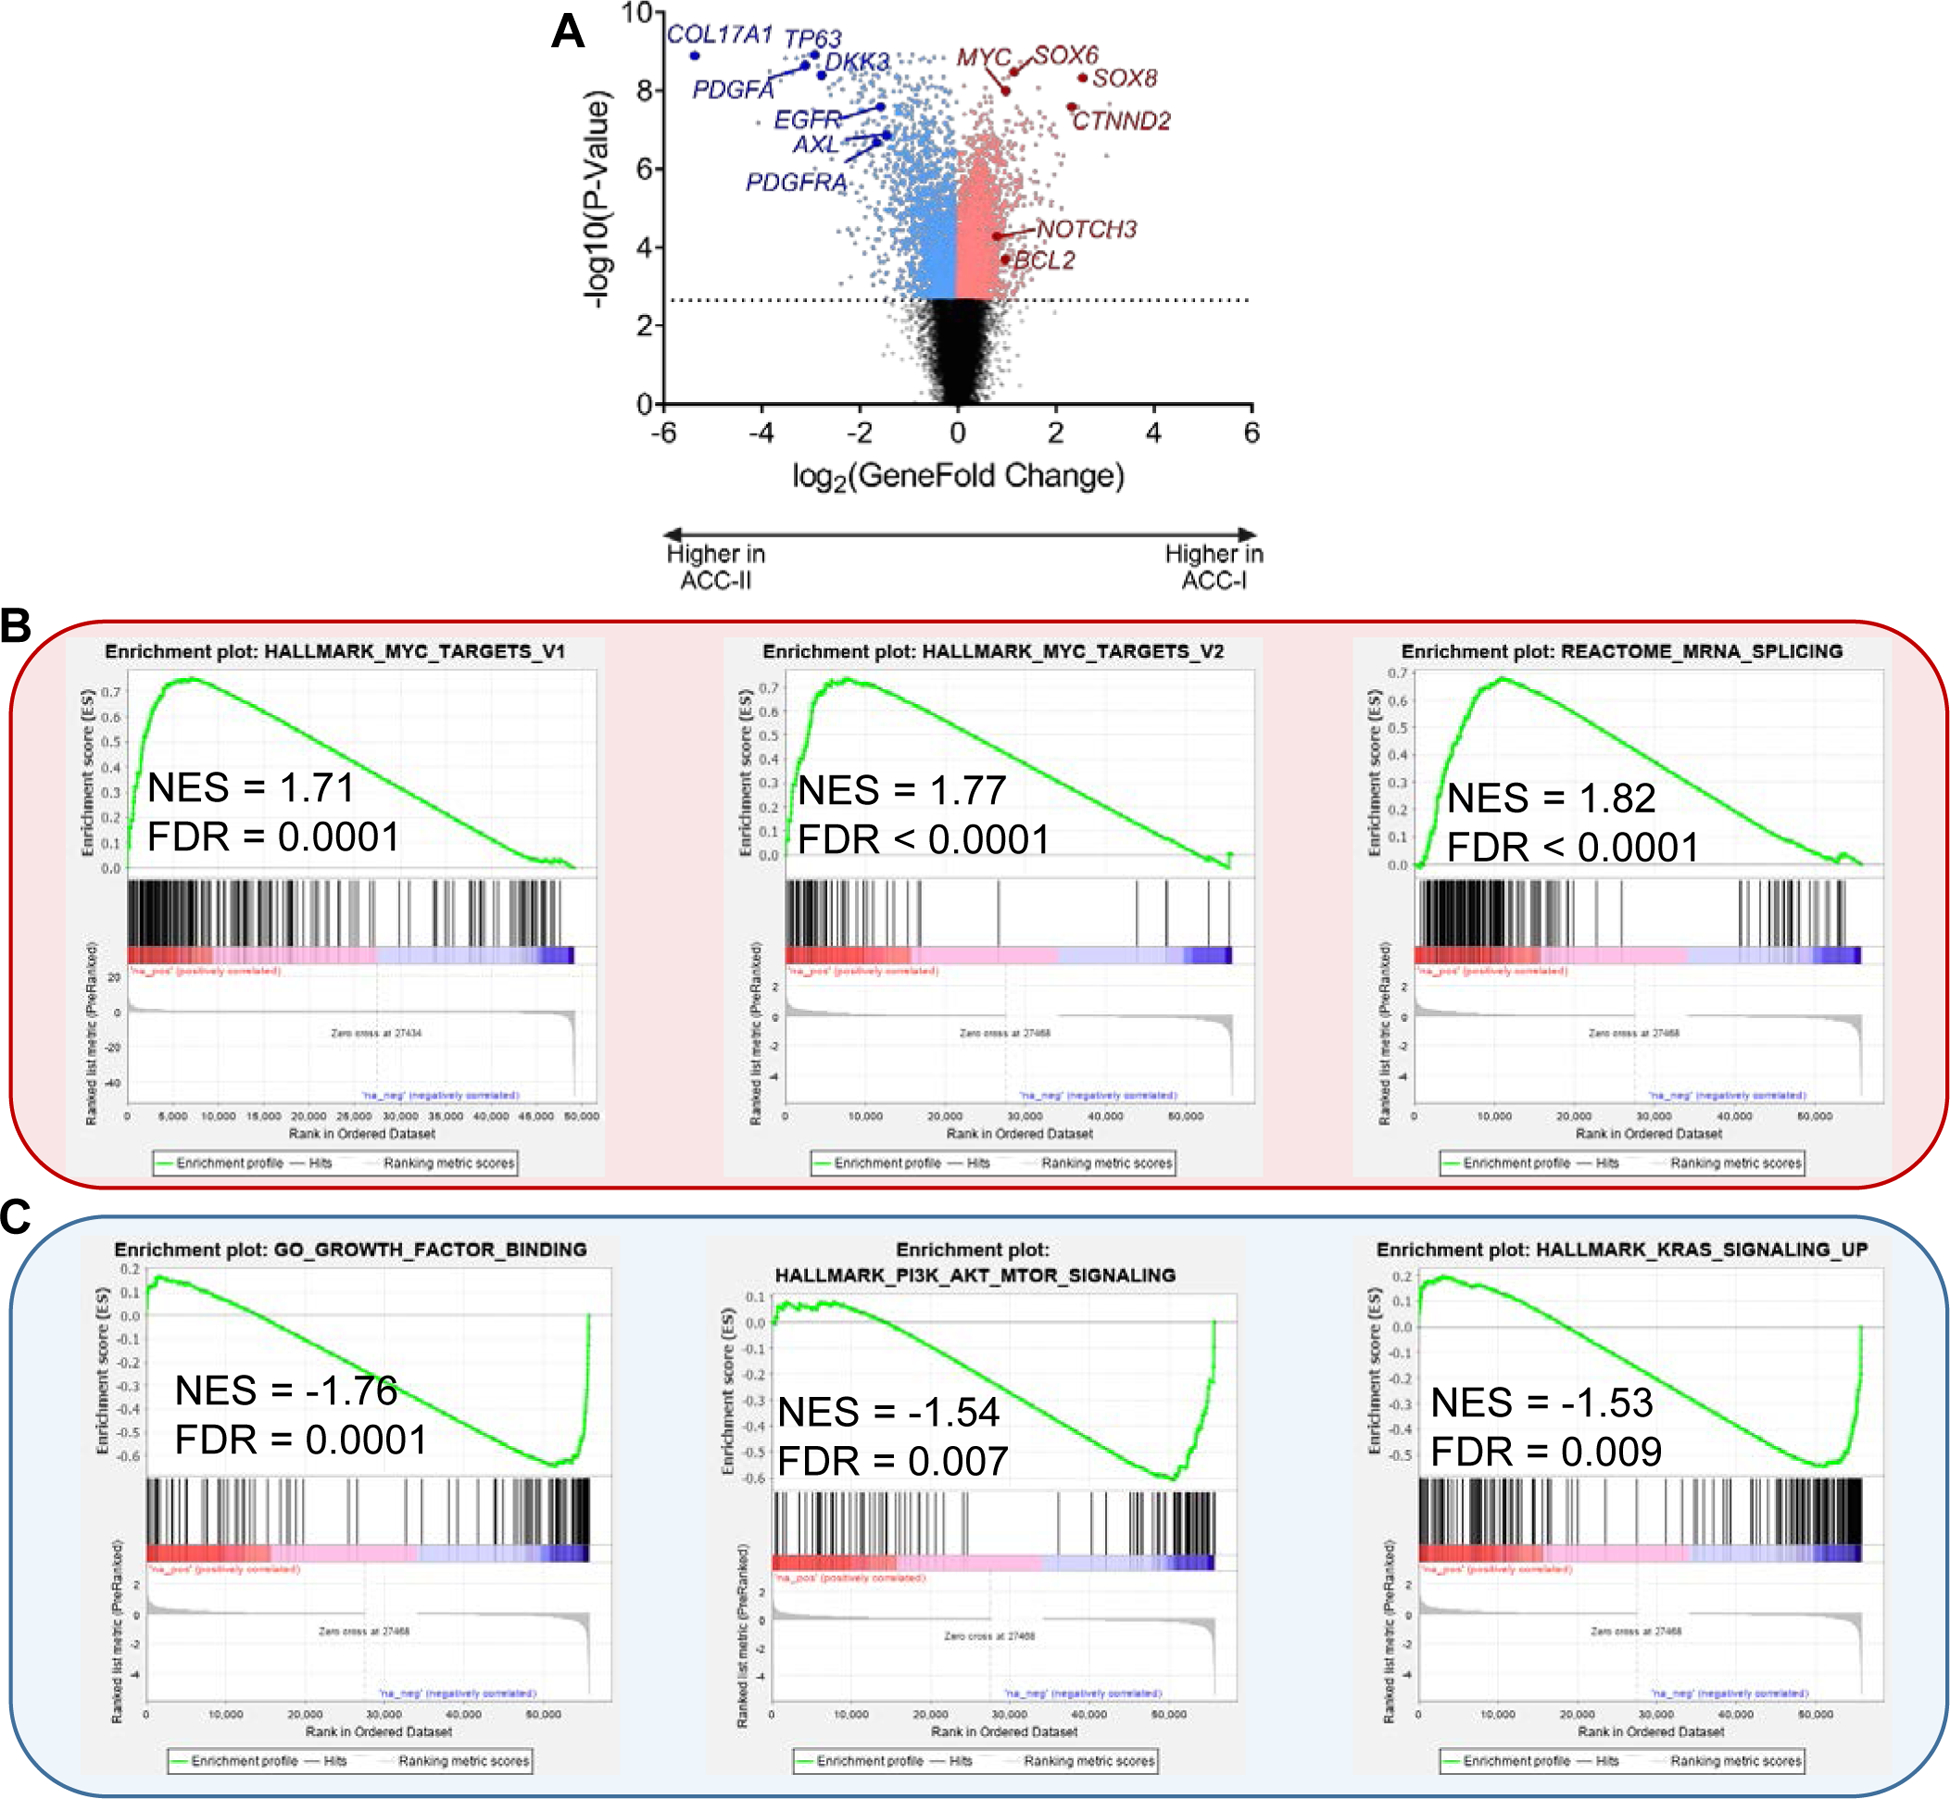
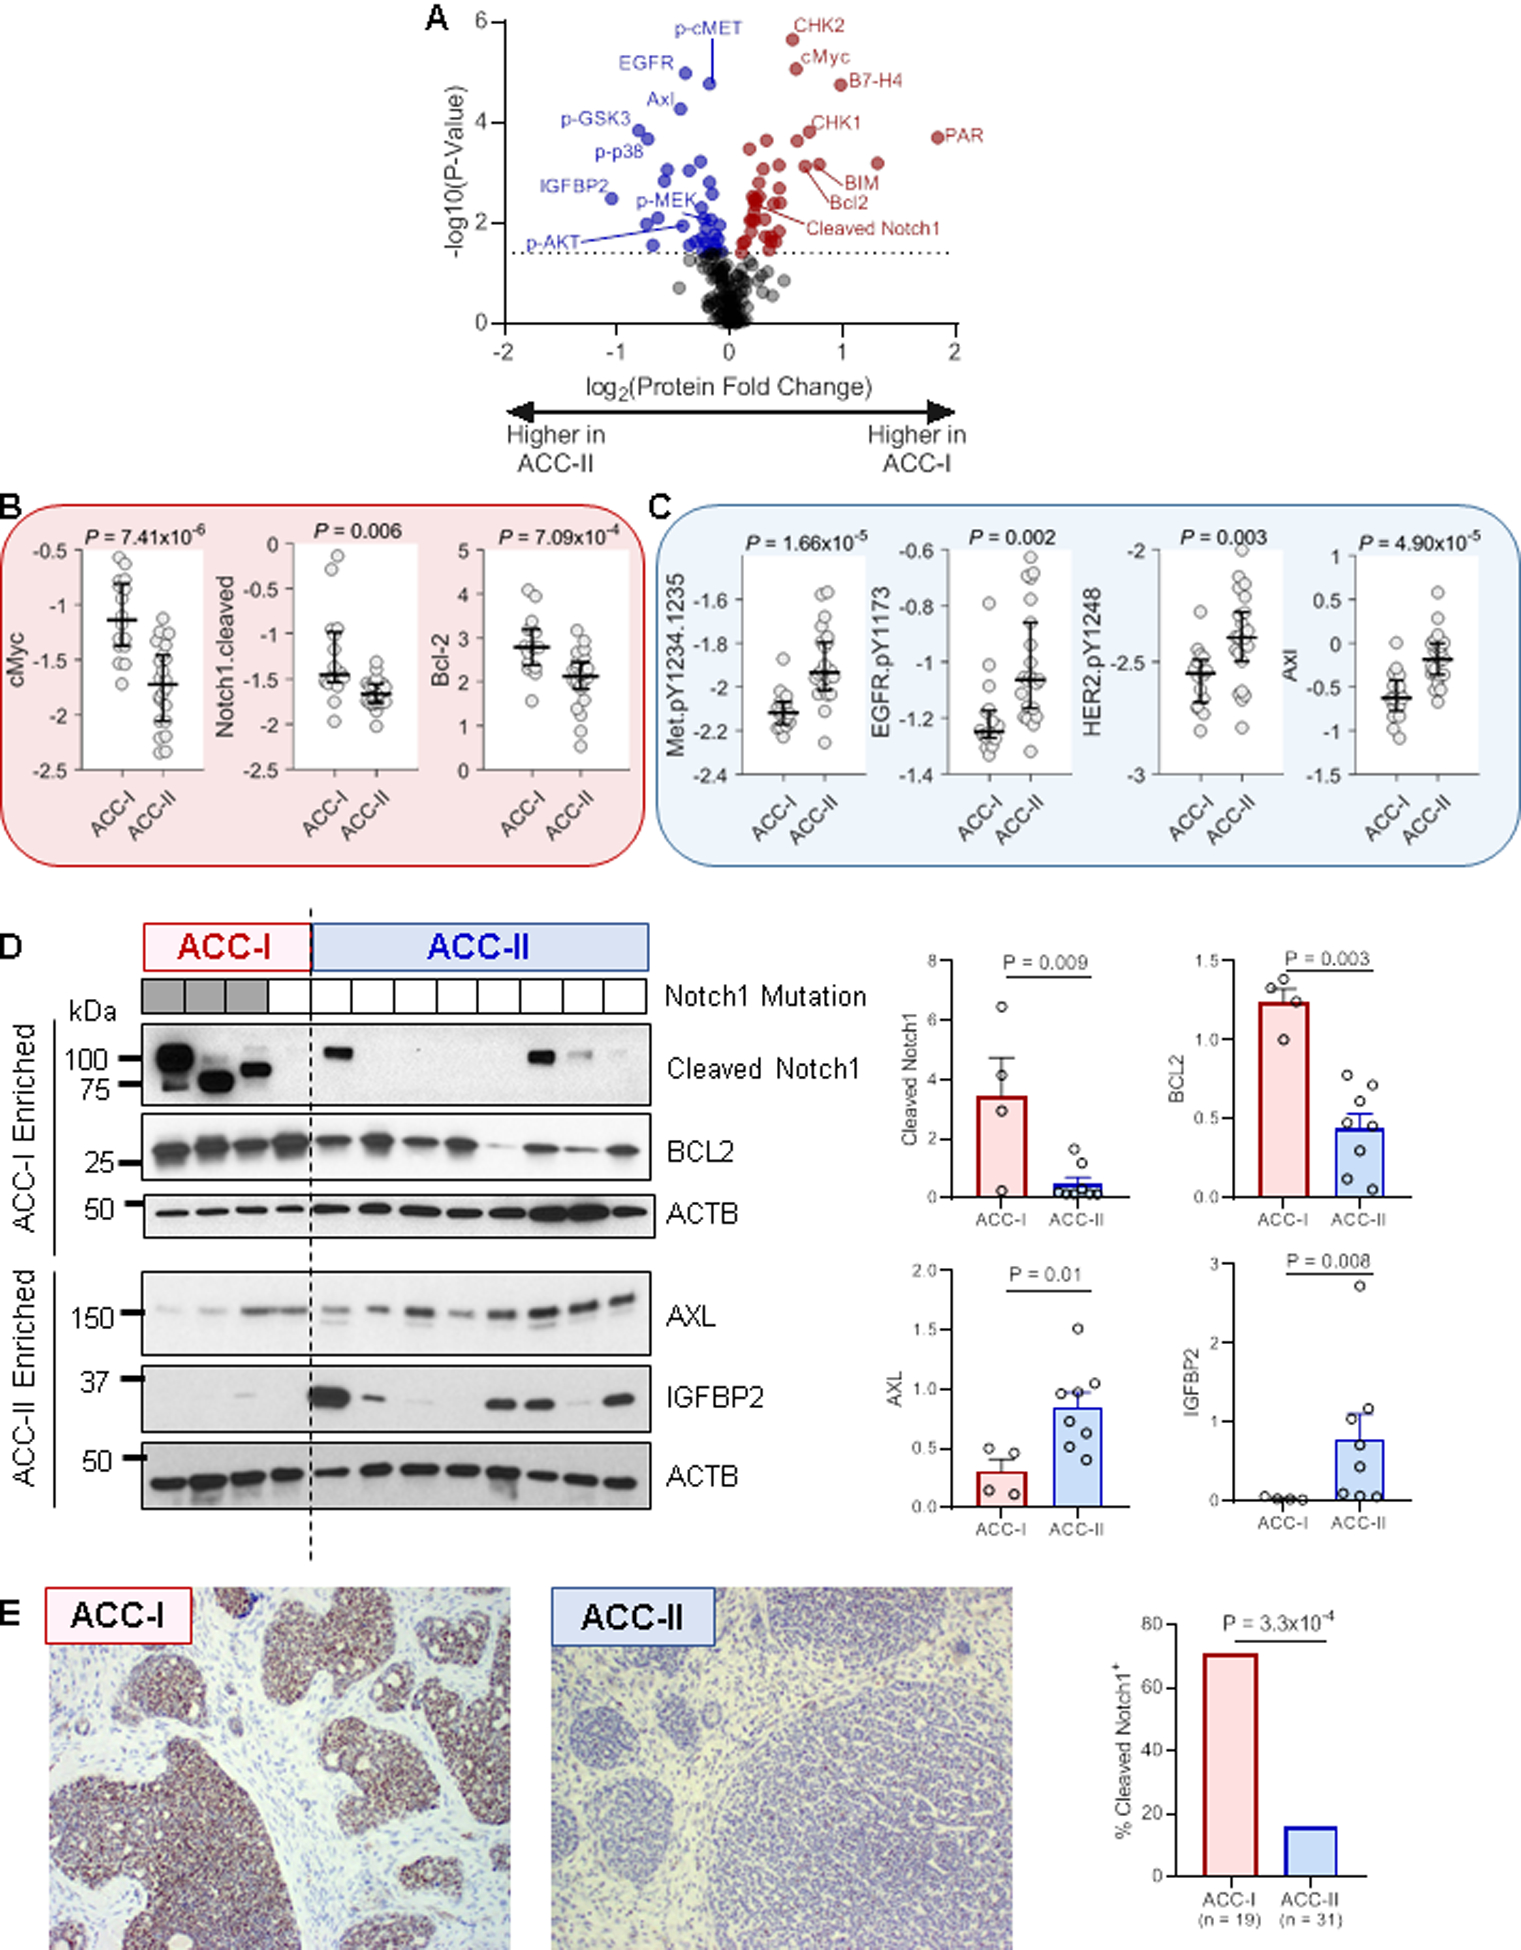
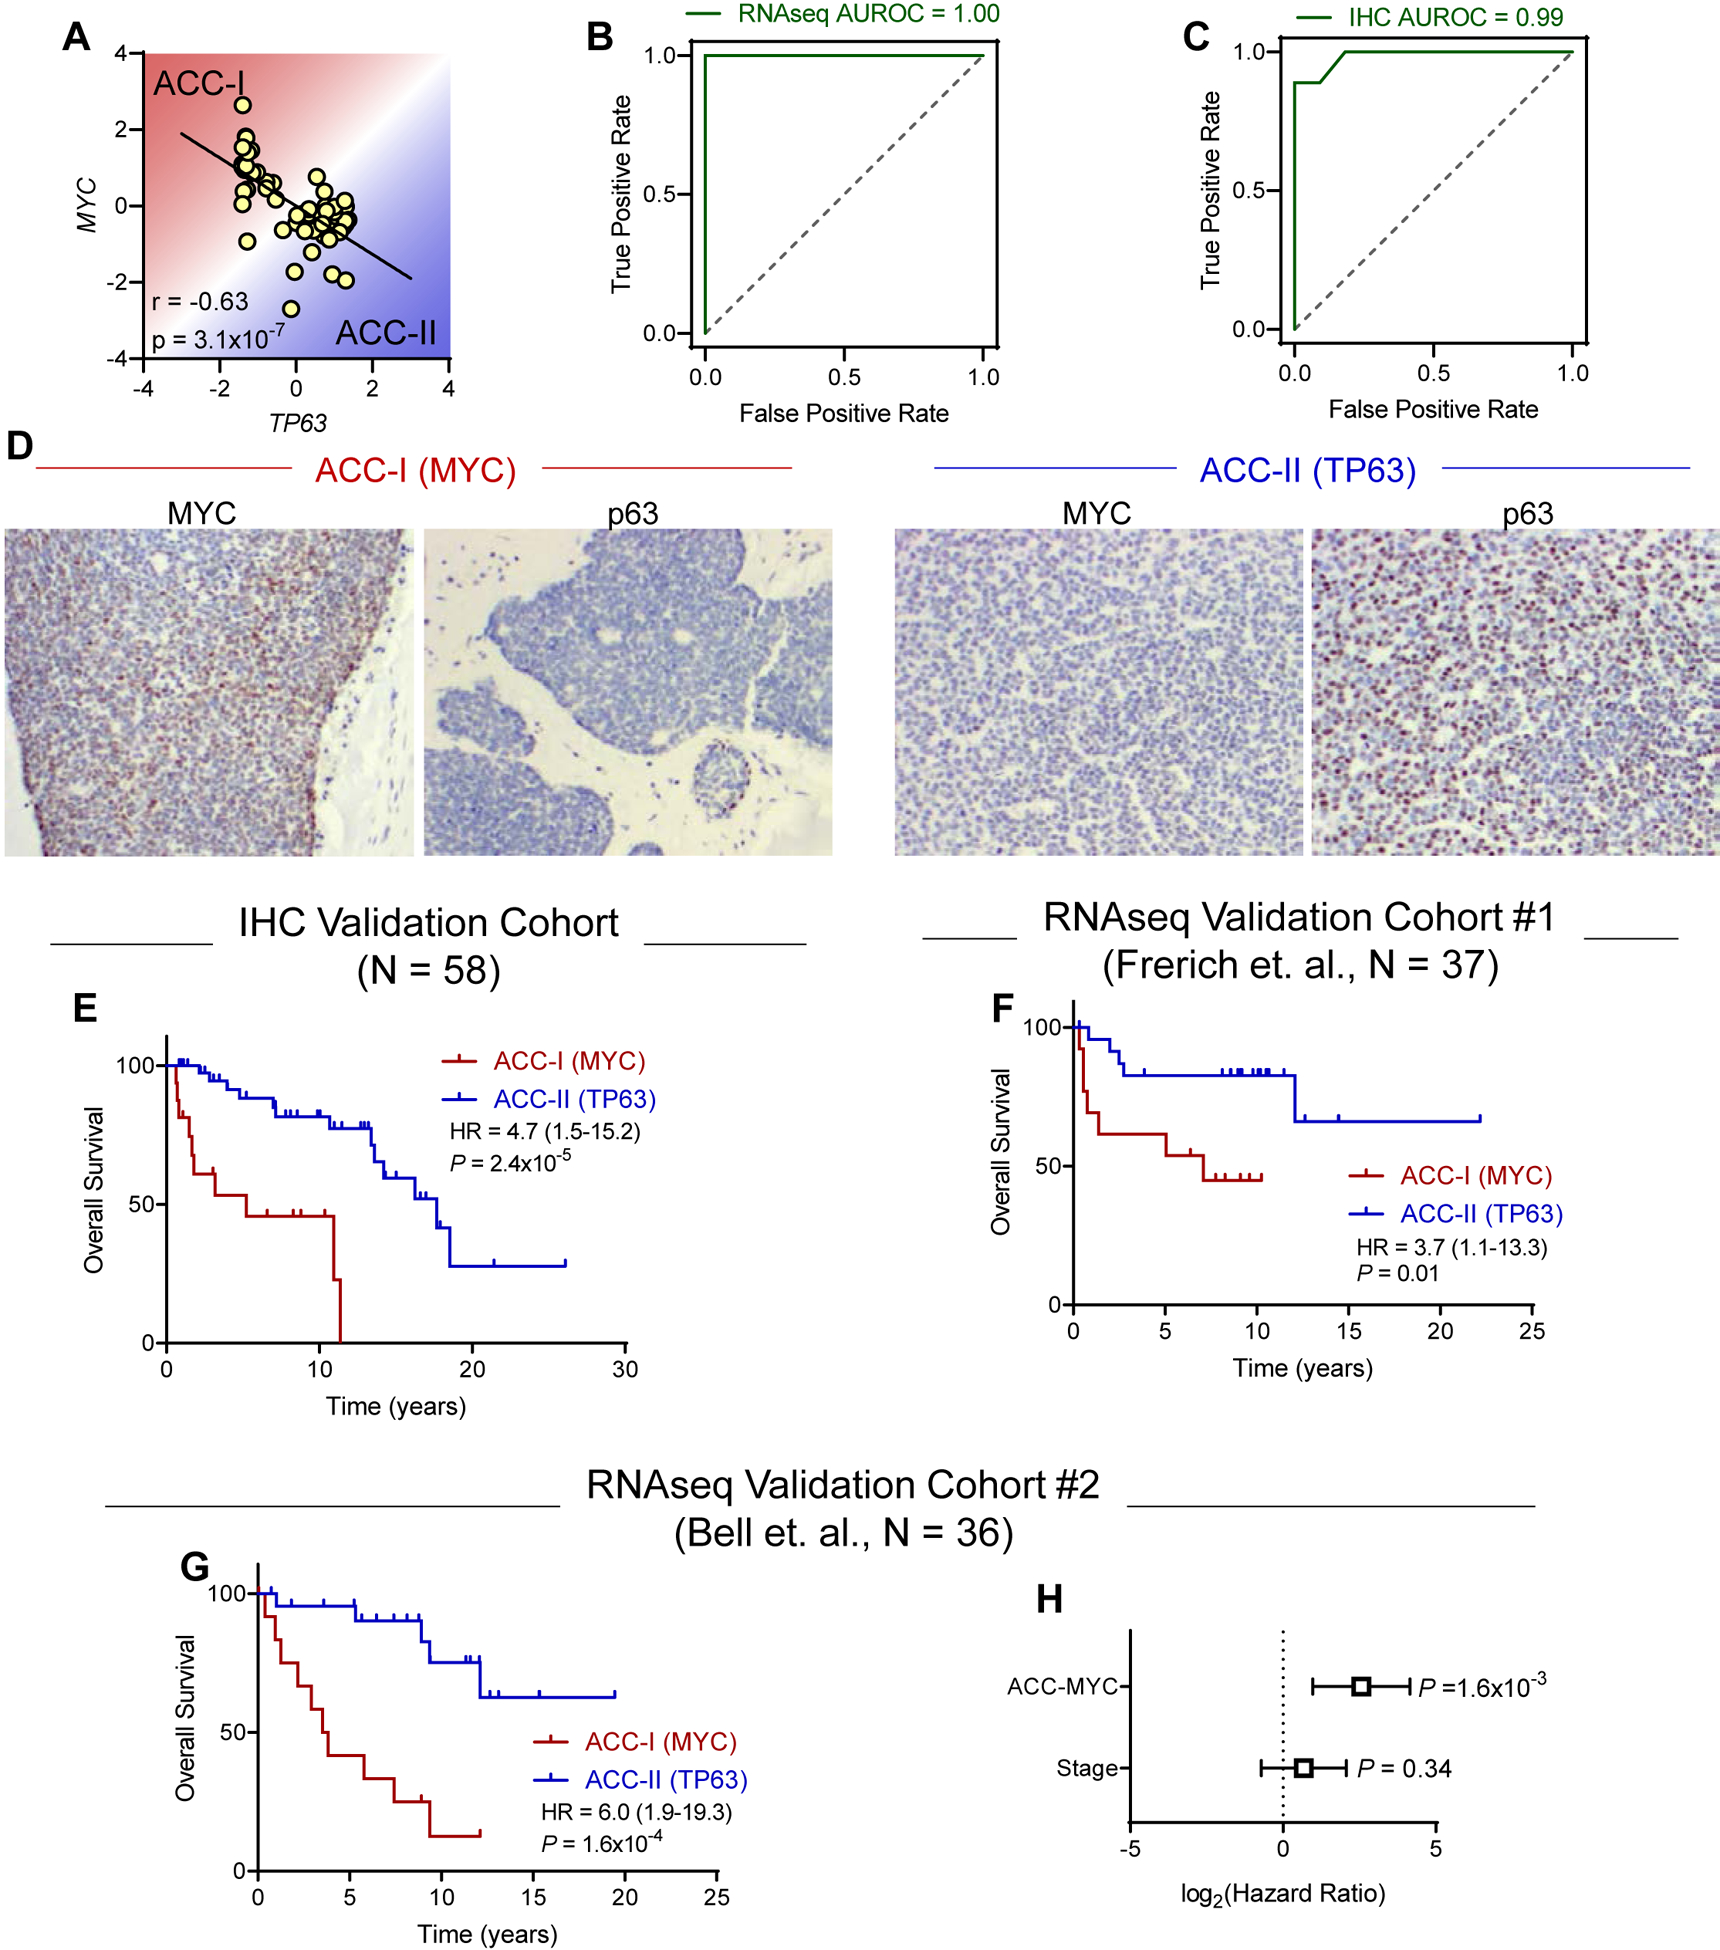
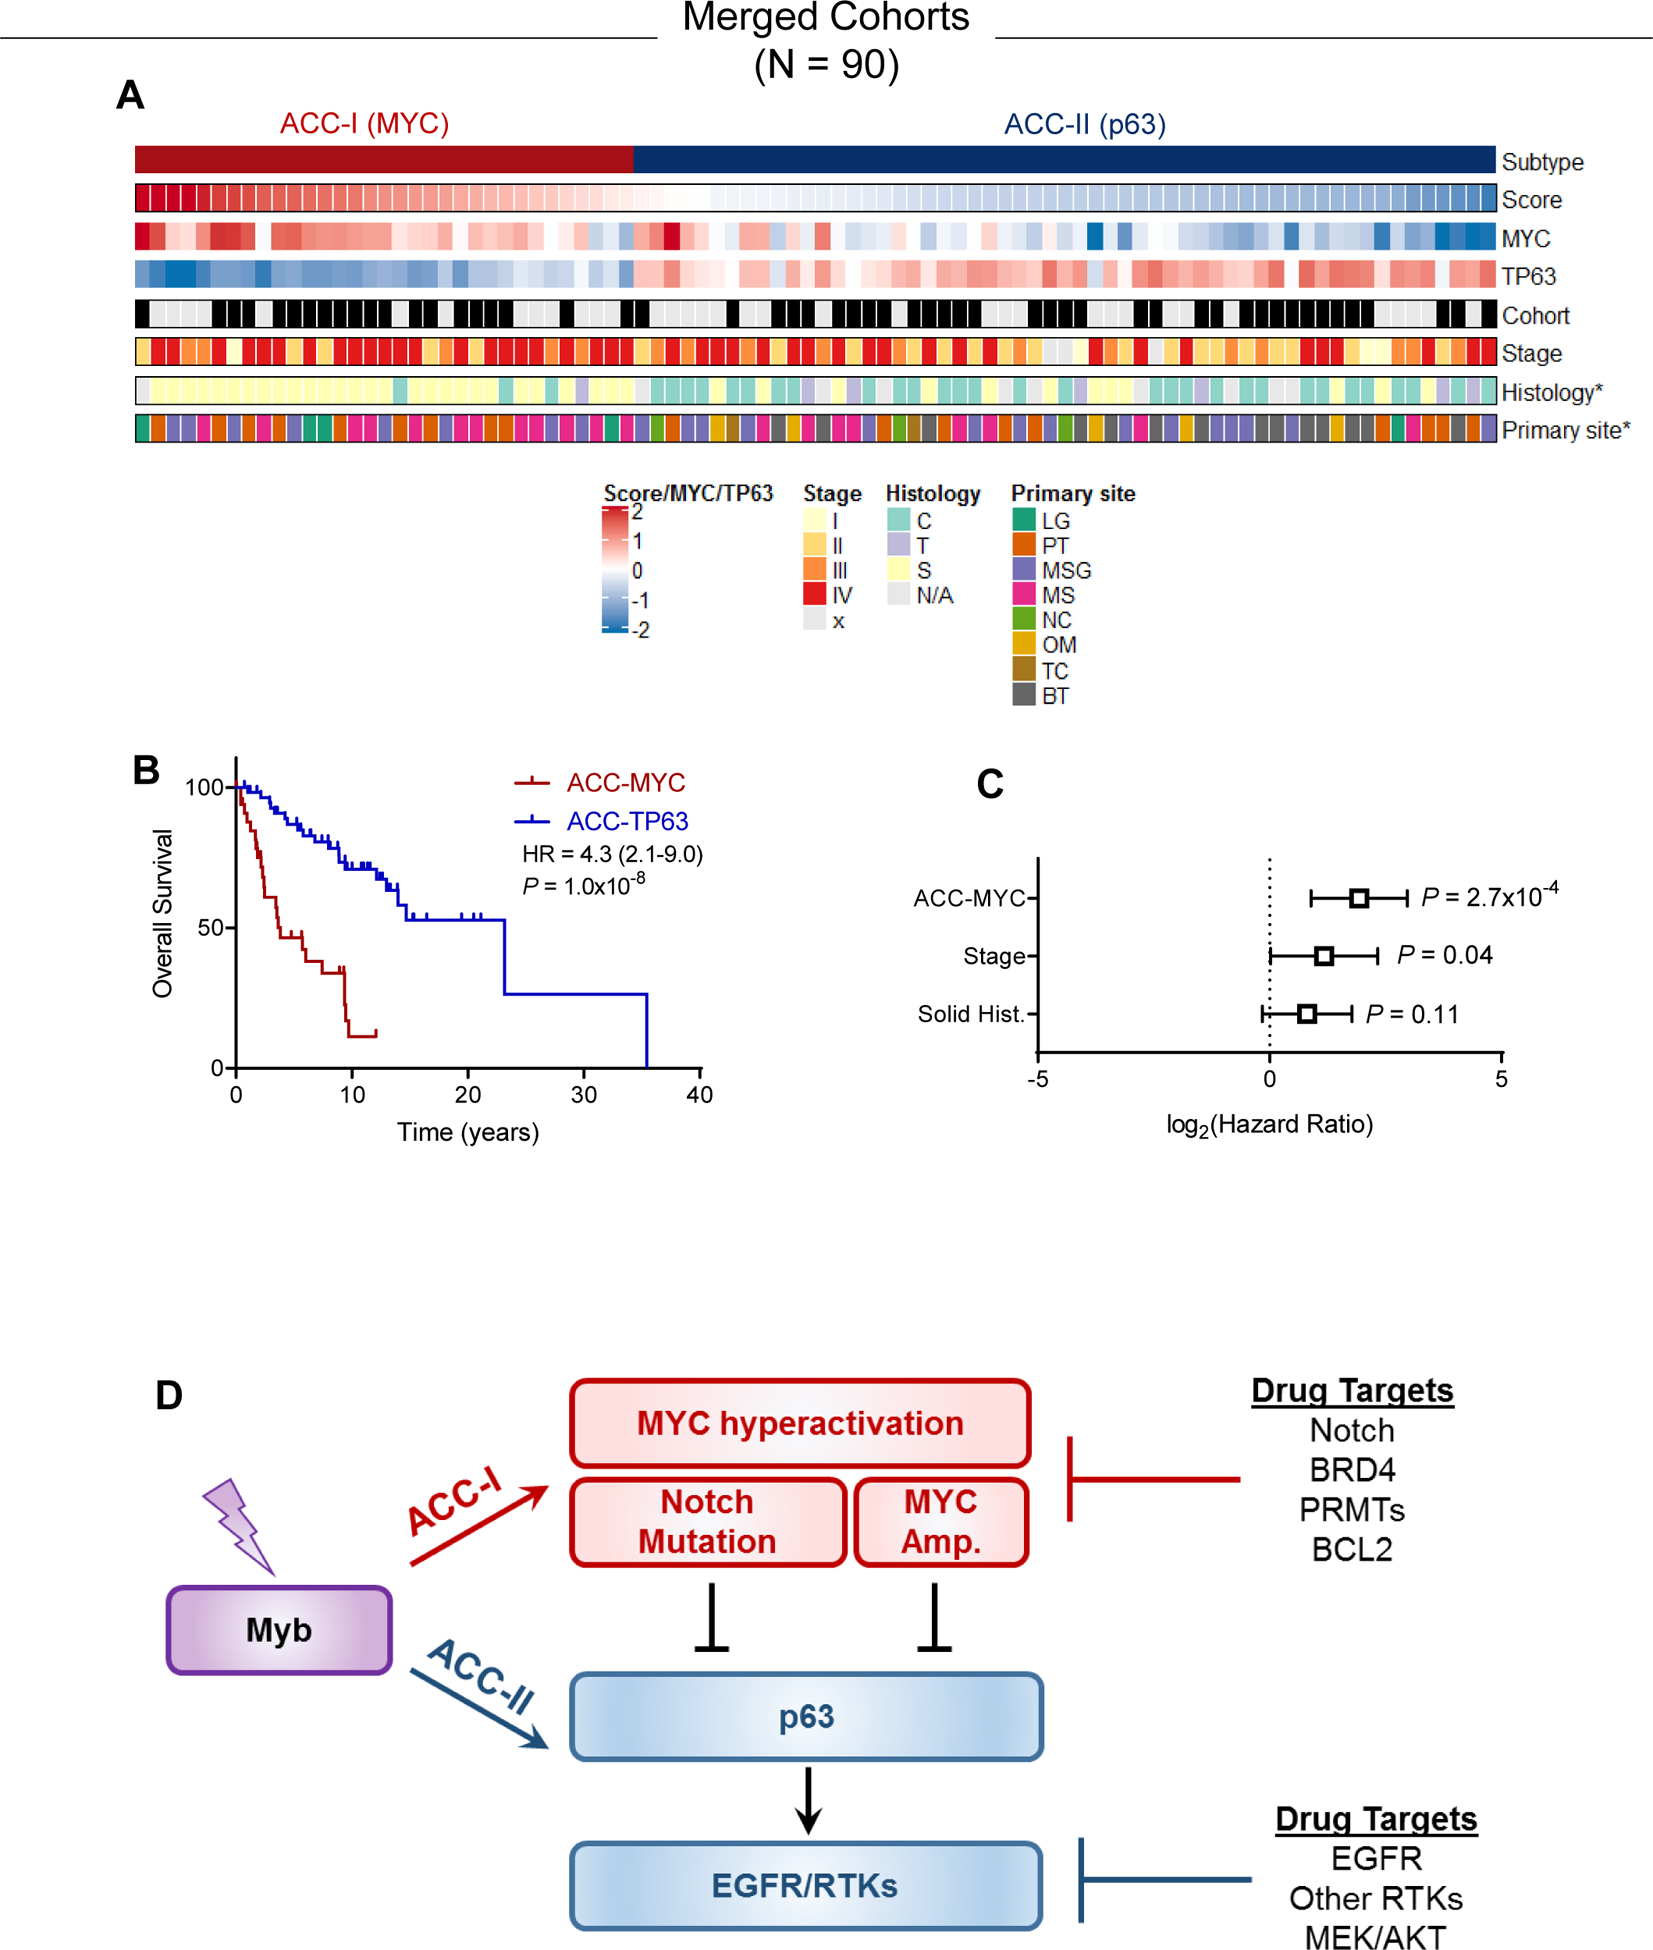
Results: Both unbiased RNA sequencing (RNA-seq) and RPPA analysis revealed two molecular subtypes: ACC-I (37%) and ACC-II (63%). ACC-I had strong upregulation of MYC, MYC target genes, and mRNA splicing, enrichment of NOTCH-activating mutations, and dramatically worse prognosis. ACC-II exhibited upregulation of TP63 and receptor tyrosine kinases (AXL, MET, and EGFR) and less aggressive clinical course. TP63 and MYC were sufficient to assign tumors to ACC subtypes, which was validated in one independent cohort by IHC and two additional independent cohorts by RNA-seq. Furthermore, IHC staining for MYC and P63 protein levels can be used to identify ACC subtypes, enabling rapid clinical deployment to guide therapeutic decisions. Our data suggest a model in which ACC-I is driven by MYC signaling through either NOTCH mutations or direct amplification, which in turn suppress P63 signaling observed in ACC-II, producing unique therapeutic vulnerabilities for each subtype.

Conclusions: Cooccurrence of multiple actionable protein/pathways alterations in each subtype indicates unique therapeutic vulnerabilities and opportunities for optimal combination therapy for this understudied and heterogeneous disease.


Conflict of interest statement

Conflict of Interest Disclosures: Dr. Ferrarotto reports personal fees from Regeneron-Sanofi, Ayala Pharma, Klus Pharma, Medscape, Cellestia Biotech, Carevive, and Prelude; grants from AstraZeneca, Merck, Gennentech, Pfizer, Oropharynx Program Stiefel clinical trials, ASCO Career Development Award, and MD Anderson Khalifa Award within the past two years.

Figures

Figure 1.
Figure 1.. Study overview.
(A) A cohort of 54 patients with adenoid cystic carcinomas and available tumor was interrogated for proteogenomic characterization. Most tumors (52 out of 54 [96%], arose in the major and minor salivary glands (highlighted in red). (B) Long-term overall survival is stratified by tumor stage, with a median overall survival of 13.0 years (95% CI 6.8–23.2 years) for the entire cohort. (C) Description of assays used to characterize ACC tumors.
Figure 2.
Figure 2.. Consensus clustering identifies two distinct ACC subtypes.
(A) Heatmap of differentially expressed (FDR<0.05, log2(FC)>0.75) genes between two ACC subtypes identified by consensus clustering with MYB/MYBL1-NFIB fusion status determined by FISH, primary site, tumor histology, and stage indicated on top and tumor mutation burden (TMB), as well as all mutations that occur in 2 or more patients indicated on bottom. Legend included to right of heatmap. *p<0.05. See Figure S2A. S: solid, C: cribriform, T: tubular, MS: maxillary sinus, PT: palate, BT: base of tongue, MSG: major salivary gland, OM: other minor salivary gland, TC: trachea, LG: lacrimal gland, NC: nasal cavity. (B) Overall survival stratified by ACC subtype. Log-rank test. (C) Multivariate Cox proportional hazards model for overall survival based on both subtype and tumor stage. (D) Concordance between ACC subtypes based on gene expression (RNA) and targeted proteomics (RPPA). Fisher’s exact test.
Figure 3.
Figure 3.. Gene expression alterations between ACC subtypes.
(A) Volcano plot showing genes with increased expression in ACC-I (positive fold changes, red) or ACC-II (negative fold changes, blue). Dotted line indicates 1% FDR. (B) Pathways enriched in ACC-I by gene set enrichment analysis. NES, net enrichment score. (C) Pathways enriched in ACC-II by gene set enrichment analysis. NES, net enrichment score.
Figure 4.
Figure 4.. Protein expression alterations between ACC subtypes.
(A) Volcano plot showing proteins with increased expression in ACC-I (positive fold changes, red) or ACC-II (negative fold changes, blue) determined by RPPA. Dotted line indicates 5% FDR. (B) Select up-regulated proteins in ACC-I. Y-axis indicates protein level determined by RPPA. Rank-sum test. (C) Select up-regulated proteins in ACC-II. Y-axis indicates protein level determined by RPPA. Rank-sum test. (D) Validation of select proteins by western blot. Values were normalized to beta actin (ACTB) for quantification. Note that altered cleaved Notch1 band sizes are likely due to mutations altering protein size (full length of NICD1 is 110 kD). Rank-sum test. (E) Validation of cleaved Notch1 by IHC. Fisher’s exact test.
Figure 5.
Figure 5.. MYC and p63 are sufficient to identify patients with poor prognosis across multiple independent ACC cohorts.
(A) Correlation of MYC and TP63 gene expression levels. Pearson correlation coefficient. N = 54. (B-C) Receiver-operator characteristic (ROC) curve for the ability of MYC/TP63 gene expression (C) or IHC (D) levels to identify ACC subtypes. Area under ROC curve (AUROC) of 1.0 indicates perfect classification. Dotted line indicates random chance. (D) Representative immunohistochemical staining for MYC and p63 in tumors from each subtype. (E) Validation of MYC/TP63 IHC classification in independent cohort of ACC samples (N = 58). Log-rank test. (F) Validation of MYC/TP63 classification in independent Frerich cohort (N = 37). Samples were divided based on optimal threshold value determined in the original cohort. Log-rank test. (G) Validation of MYC/TP63 classification in independent Bell cohort (N = 36). Samples were divided based on optimal threshold value determined in the original cohort. Log-rank test. (H) Multivariate survival analysis using Cox proportional hazards model in Bell validation cohort.
Figure 6.
Figure 6.. Summary of proposed ACC subtypes.
(A) Combination of the original and validation cohort showing subtype, score, MYC/TP63 gene expression levels, tumor stage, histology, and primary site. *p<0.05 association with subtype. (B) Overall survival in combined cohort. Log-rank test. (C) Multivariate survival analysis using Cox proportional hazards model in the combined cohort accounting for subtype, tumor stage, and tumor histology. (D) ACC-I is characterized by MYC hyperactivation via Notch or direct amplification, both of which can suppress p63. In absence of these events, p63 drives EGFR or other RTKs to promote proliferation.

References

    1. Bell D, Bell AH, Bondaruk J, Hanna EY, Weber RS. In-depth characterization of the salivary adenoid cystic carcinoma transcriptome with emphasis on dominant cell type. Cancer 2016;122(10):1513–22 doi 10.1002/cncr.29959. - DOI - PubMed
    1. Bell D, Roberts D, Kies M, Rao P, Weber RS, El-Naggar AK. Cell type-dependent biomarker expression in adenoid cystic carcinoma: biologic and therapeutic implications. Cancer 2010;116(24):5749–56 doi 10.1002/cncr.25541. - DOI - PMC - PubMed
    1. Ferrarotto R, Heymach JV, Glisson BS. MYB-fusions and other potential actionable targets in adenoid cystic carcinoma. Curr Opin Oncol 2016;28(3):195–200 doi 10.1097/CCO.0000000000000280. - DOI - PubMed
    1. Stephens PJ, Davies HR, Mitani Y, Van Loo P, Shlien A, Tarpey PS, et al. Whole exome sequencing of adenoid cystic carcinoma. The Journal of clinical investigation 2013;123(7):2965–8 doi 10.1172/JCI67201. - DOI - PMC - PubMed
    1. Kulis M, Heath S, Bibikova M, Queiros AC, Navarro A, Clot G, et al. Epigenomic analysis detects widespread gene-body DNA hypomethylation in chronic lymphocytic leukemia. Nat Genet 2012;44(11):1236–42 doi 10.1038/ng.2443. - DOI - PubMed

Publication types

MeSH terms

Substances