

Simulation study to demonstrate biases created by diagnostic criteria of mental illnesses: major depressive episodes, dysthymia, and manic episodes
- PMID: 33172939
- PMCID: PMC7656951
- DOI: 10.1136/bmjopen-2020-037022
Simulation study to demonstrate biases created by diagnostic criteria of mental illnesses: major depressive episodes, dysthymia, and manic episodes
Abstract
Objectives: Composite diagnostic criteria alone are likely to create and introduce biases into diagnoses that subsequently have poor relationships with input symptoms. This study aims to understand the relationships between the diagnoses and the input symptoms, as well as the magnitudes of biases created by diagnostic criteria and introduced into the diagnoses of mental illnesses with large disease burdens (major depressive episodes, dysthymic disorder, and manic episodes).
Settings: General psychiatric care.
Participants: Without real-world data available to the public, 100 000 subjects were simulated and the input symptoms were assigned based on the assumed prevalence rates (0.05, 0.1, 0.3, 0.5 and 0.7) and correlations between symptoms (0, 0.1, 0.4, 0.7 and 0.9). The input symptoms were extracted from the diagnostic criteria. The diagnostic criteria were transformed into mathematical equations to demonstrate the sources of biases and convert the input symptoms into diagnoses.
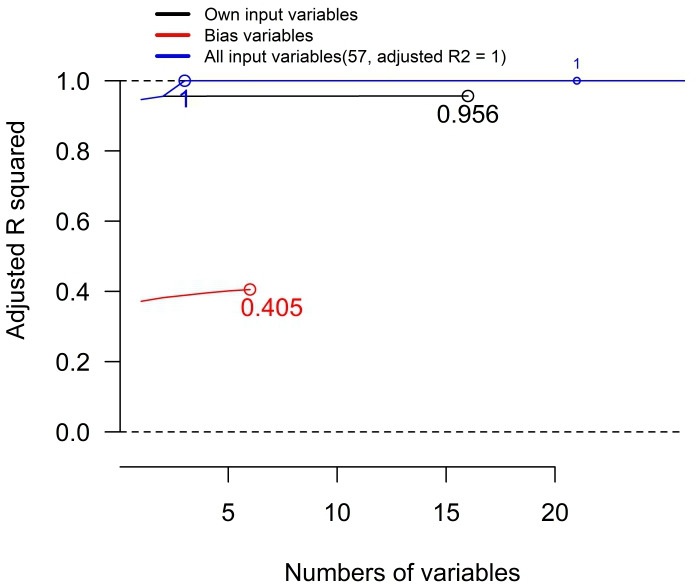
Primary and secondary outcomes: The relationships between the input symptoms and diagnoses were interpreted using forward stepwise linear regressions. Biases due to data censoring or categorisation introduced into the intermediate variables, and the three diagnoses were measured.
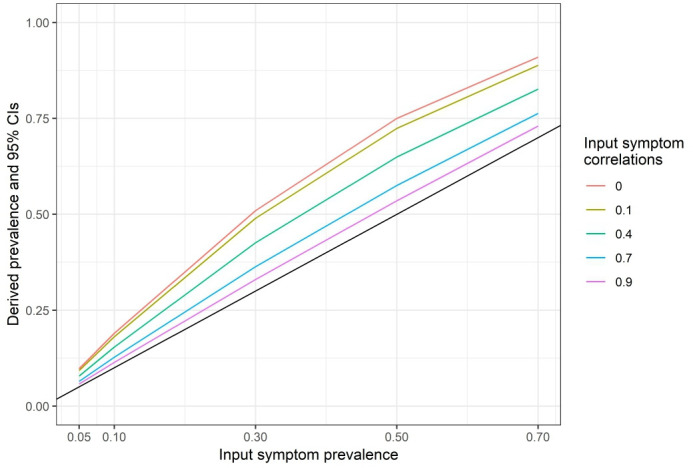
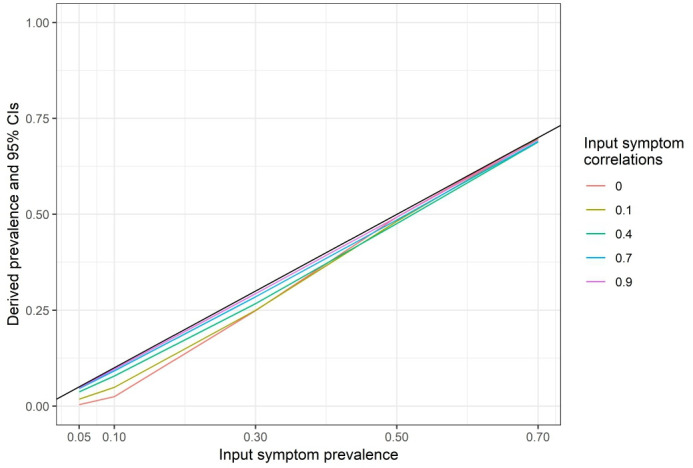
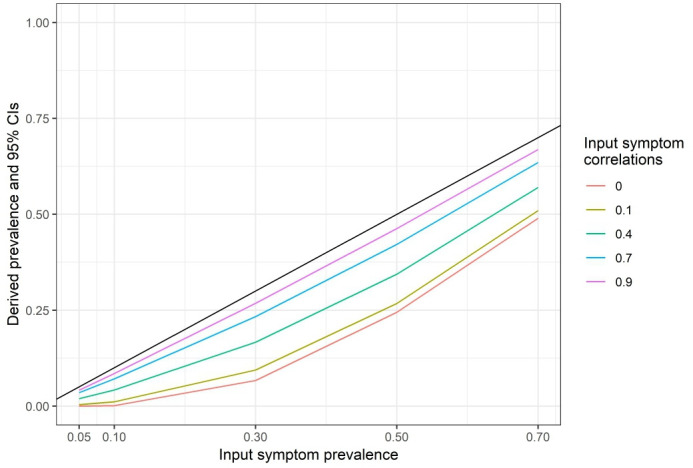
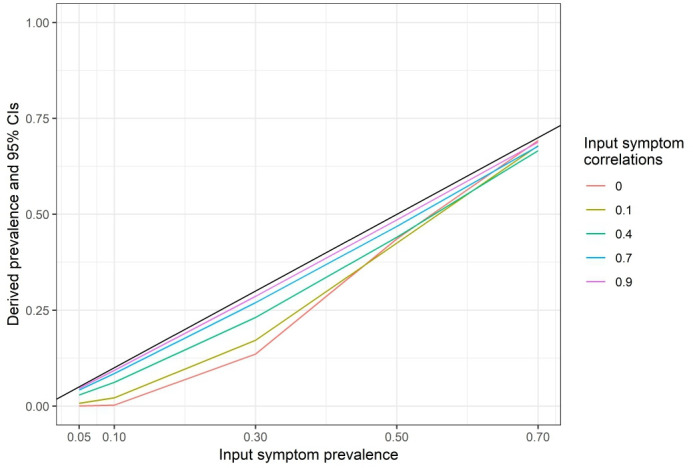
Results: The prevalence rates of the diagnoses were lower than those of the input symptoms and proportional to the assumed prevalence rates and the correlations between the input symptoms. Certain input or bias variables consistently explained the diagnoses better than the others. Except for 0 correlations and 0.7 prevalence rates of the input symptoms for the diagnosis of dysthymic disorder, the input symptoms could not fully explain the diagnoses.
Conclusions: There are biases created due to composite diagnostic criteria and introduced into the diagnoses. The design of the diagnostic criteria determines the prevalence of the diagnoses and the relationships between the input symptoms, the diagnoses, and the biases. The importance of the input symptoms has been distorted largely by the diagnostic criteria.
Keywords: bias; forward-stepwise regression; frailty; index mining; the health and retirement study.
© Author(s) (or their employer(s)) 2020. Re-use permitted under CC BY-NC. No commercial re-use. See rights and permissions. Published by BMJ.
Conflict of interest statement
Competing interests: Y-SC is currently employed by the Canadian Agency for Drugs and Technologies in Health. The other authors declare that there is no conflict of interest.
Figures
References
-
- American Psychiatric Association Diagnostic and Statistical Manual of Mental Disorders : Text revision (DSM-IV-TR®). Fourth ed Washington, DC: American Psychiatric Association Publishing, 2010.
-
- Center for Substance Abuse Treatment Managing depressive symptoms in substance abuse clients during early recovery. Rockville, MD: Substance Abuse and Mental Health Services Administration (US), 2008. - PubMed
MeSH terms
LinkOut - more resources
Full Text Sources