. 2021 Feb;376(2):294-305.
doi: 10.1124/jpet.120.000309. Epub 2020 Nov 10.

Lysosomal Biogenesis and Implications for Hydroxychloroquine Disposition

Affiliations

Lysosomal Biogenesis and Implications for Hydroxychloroquine Disposition

Keagan P Collins et al. J Pharmacol Exp Ther. 2021 Feb.

Abstract

Lysosomes act as a cellular drug sink for weakly basic, lipophilic (lysosomotropic) xenobiotics, with many instances of lysosomal trapping associated with multiple drug resistance. Lysosomotropic agents have also been shown to activate master lysosomal biogenesis transcription factor EB (TFEB) and ultimately lysosomal biogenesis. We investigated the role of lysosomal biogenesis in the disposition of hydroxychloroquine (HCQ), a hallmark lysosomotropic agent, and observed that modulating the lysosomal volume of human breast cancer cell lines can account for differences in disposition of HCQ. Through use of an in vitro pharmacokinetic (PK) model, we characterized total cellular uptake of HCQ within the duration of static equilibrium (1 hour), as well as extended exposure to HCQ that is subject to dynamic equilibrium (>1 hour), wherein HCQ increases the size of the lysosomal compartment through swelling and TFEB-induced lysosomal biogenesis. In addition, we observe that pretreatment of cell lines with TFEB-activating agent Torin1 contributed to an increase of whole-cell HCQ concentrations by 1.4- to 1.6-fold, which were also characterized by the in vitro PK model. This investigation into the role of lysosomal volume dynamics in lysosomotropic drug disposition, including the ability of HCQ to modify its own disposition, advances our understanding of how chemically similar agents may distribute on the cellular level and examines a key area of lysosomal-mediated multiple drug resistance and drug-drug interaction. SIGNIFICANCE STATEMENT: Hydroxychloroquine is able to modulate its own cellular pharmacokinetic uptake by increasing the cellular lysosomal volume fraction through activation of lysosomal biogenesis master transcription factor EB and through lysosomal swelling. This concept can be applied to many other lysosomotropic drugs that activate transcription factor EB, such as doxorubicin and other tyrosine kinase inhibitor drugs, as these drugs may actively increase their own sequestration within the lysosome to further exacerbate multiple drug resistance and lead to potential acquired resistance.


Conflict of interest statement

The authors declare that no conflict of interest exists.

Figures

Fig. 1.
Fig. 1.
Whole-cell uptake of HCQ is proportional to basal lysosomal volume fraction. The in vitro whole-cell PK of HCQ was assessed in four hBC cell lines (MDA-MB-231, MDA-MB-468, T47D, and MCF7) at 1, 5, 15, 30, 60, 240, and 1440 minutes after incubating with 10 µM HCQ (A). Cell lysosomal volume fraction was calculated as outlined in Supplemental Fig. 2 (B). Lysosomal volume fraction closely followed the ranking of AUC0–24 hour of the whole-cell PK data (C). Mean whole-cell HCQ concentrations at each time point, except 1 minute, were significantly correlated with cellular lysosome volume fraction (D). This correlation was also significant when comparing the mean AUC0–24 hour of each cell line to the cellular lysosome volume fraction (E). Applicable data are shown as means ± S.D., and significance is defined as P < 0.05 (*) and P < 0.01 (**).
Fig. 2.
Fig. 2.
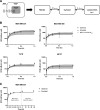
Basal lysosome PK model of HCQ accounts for uptake by adjusting lysosomal volume fraction. To further investigate the in vitro PK of HCQ in the 4 hBC lines, we used a previously published base model of lysosomotropic drug uptake into cells. The compartmental model is outlined, in which compartments considered are culture media, cytosol, and lysosome, with the lysosome contained within the cytosolic compartment (A). Mathematically, the three compartments are separate; HCQ diffuses freely from media (M) ↔ cytosol (C) ↔ lysosomes (L), and diffusion is represented by a net flux term (∆J) that is the sum of permeability of each HCQ ionization state (neutral, +, ++). The lysosomal compartment has a dynamic pH feedback term that was representative of the proposed mechanism of HCQ to increase the pH of the lysosome based on free drug concentration. The model was used to simulate HCQ uptake in each cell line based on lysosomal volume fractions and other parameters in Table 1. The output of the model simulation for each cell line is shown as the observed mean ± 95% CI bounds in conjunction with the simulated mean ± 95% CI bounds of the cellular lysosomal volume fraction (B). The model only considered time points out to the 1st hour, which were labeled as short-term static equilibrium. In the experimental data, it is observed that concentrations continue to increase after 1 hour, which is characterized as the long-term dynamic system (C), and this is investigated in later figures.
Fig. 3.
Fig. 3.
HCQ increases the size of the lysosomal compartment. We investigated the ability of HCQ to change the size of the lysosomal compartment. TFEB activity in the nucleus was significantly increased in all cell lines treated with 10 µM HCQ for 24 hours and with 250 nM Torin1, a molecular TFEB-activating agent, for 16 hours (A). GSEA of all four cell lines treated with 20 µM HCQ for 24 hours also caused a significant enrichment of TFEB lysosome targets, as determined by the normalized enrichment score (NES) and false discovery rate (FDR) (B). Fluorescence microscopy imaging of all four cell lines with ETP showed a significant increase in lysosome accumulation within all cell lines treated with 10 µM HCQ for 24 hours or 250 nM Torin1 for 16 hours (C). Representative images of MCF7 cells imaged with ETP under the treatment conditions are shown in in (D). Zooming in on MCF7 cells treated with HCQ shows a visual increase in lysosomal size in comparison with the Torin1 treatment. Significance is defined as P < 0.05 (*). To prepare figures for publication, the raw image threshold was adjusted to the same upper and lower bounds across the entire image for all images shown.
Fig. 4.
Fig. 4.
HCQ increases the size of the lysosome compartment, which should increase its whole-cell drug uptake. This figure outlines the process by which HCQ increases its volume of distribution within the cell. 1) HCQ is initially added to the cell culture, after which 2) it immediately begins to accumulate within the lysosomes of the cells until it reaches chemical equilibrium between 30 and 60 minutes. 3) After reaching chemical equilibrium, the lysosomes begin to swell and simultaneously activate TFEB. 4) TFEB triggers the formation of new lysosomes, which undergo the same swelling process under static extracellular concentrations of HCQ. This hypothesized mechanism describes the rapid chemical equilibrium of HCQ within the cell, until it starts causing a dynamic increase in the size of the lysosome compartment, ultimately leading to this positive-feedback loop in which HCQ increases its own cellular volume of distribution.
Fig. 5.
Fig. 5.
Dynamic lysosome volume accounts for simulation error in long-term HCQ uptake. To investigate HCQ whole-cell uptake past 1 hour, we incorporated a growing lysosomal component into the model for all cell lines. Lysosomal growth is represented by a linear increase as a function of time, out to a maximum lysosomal volume of the fold increase observed with HCQ treatment of each cell line in Fig. 3C. The dynamic system model is shown (A) for MDA-MB-231, MDA-MB-468, T47D, and MCF7, respectively. MDA-MB-231 and MDA-MB-468 simulated uptake is shown as the mean increase in experimental lysosomal volume after HCQ treatment, the upper value of the lysosomal volume, and with no growth incorporated. T47D is shown as the mean, upper, and lower increase in lysosomal volume as well as the value we would expect based on the PK data (realistic) and no growth. MCF7 is shown as the mean, upper, lower, and no growth. It should be noted that the time-based increase in lysosomal volume in the dynamic model does not affect earlier time points and thus would not affect model fit vs. the static model out to 1 hour (B).
Fig. 6.
Fig. 6.
Torin1 increases the size of the lysosomal compartment, increasing whole-cell uptake of HCQ. Cell lines were pretreated with T1 using the same concentration and time as in Fig. 3. After Torin1 pretreatment, the HCQ PK studies from 1 minute to 24 hours were repeated in Torin1(+) vs. Torin1(−) cells (Obs). Torin1 pretreatment resulted in an average increase of HCQ whole-cell concentrations at all time points by an average of 1.4- to 1.6-fold. The mathematical PK model of HCQ (Sim) was tested at basal lysosomal volume fractions vs. Torin1-modified starting lysosomal volume fractions by multiplying the basal lysosomal volume fraction in each cell line by the mean increase by Torin1 treatment from Fig. 4D (A). MDA-MB-231 [(A), top-left] fit the data well using mean values of Torin1. MDA-MB-468 used the starting lysosomal volume fraction value of the lower 95% CI (0.753%) and mean value of Torin1 increase [(A), top-right]. T47D used the mean starting Vflys (0.783%) and was tested against the mean Torin1 increase in lysosomes (10.5×) as well as the lowest observed ratio within the replicates (3×) [(A), bottom-left]. MCF7 was tested against the mean lysosomal increase by Torin1 and the lowest observed ratio within the replicates (3.8×) [(A), bottom-right]. To test whether the increase in uptake by Torin1 was only due to the increase in lysosomes, MDA-MB-231 HCQ uptake was tested at 1 hour with no pretreatment, Torin1 pretreatment, monensin pretreatment, or Torin1 and monensin pretreatment. No significant change in the ratio between T1:Ctrl and MN + T1:MN HCQ uptake was observed (B) with a two-tailed unpaired t test (P = 0.573). Comparing the simulated lysosomal concentrations vs. the whole-cell uptake concentrations in MDA-MB-231 cells with T1(+) or (−) shows a minimal difference in lysosomal concentration in both scenarios (C).

References

    1. Abeywickrama CS, Wijesinghe KJ, Stahelin RV, Pang Y. (2019) Lysosome imaging in cancer cells by pyrene-benzothiazolium dyes: an alternative imaging approach for LAMP-1 expression based visualization methods to avoid background interference. Bioorg Chem 91:103144. - PMC - PubMed
    1. Barnard RA, Wittenburg LA, Amaravadi RK, Gustafson DL, Thorburn A, Thamm DH. (2014) Phase I clinical trial and pharmacodynamic evaluation of combination hydroxychloroquine and doxorubicin treatment in pet dogs treated for spontaneously occurring lymphoma. Autophagy 10:1415–1425. - PMC - PubMed
    1. Belhoussine R, Morjani H, Sharonov S, Ploton D, Manfait M. (1999) Characterization of intracellular pH gradients in human multidrug-resistant tumor cells by means of scanning microspectrofluorometry and dual-emission-ratio probes. Int J Cancer 81:81–89. - PubMed
    1. Burger H, den Dekker AT, Segeletz S, Boersma AW, de Bruijn P, Debiec-Rychter M, Taguchi T, Sleijfer S, Sparreboom A, Mathijssen RH, et al. (2015) Lysosomal sequestration determines intracellular imatinib levels. Mol Pharmacol 88:477–487. - PubMed
    1. Duvvuri M, Krise JP. (2005) A novel assay reveals that weakly basic model compounds concentrate in lysosomes to an extent greater than pH-partitioning theory would predict. Mol Pharm 2:440–448. - PubMed

Publication types

LinkOut - more resources