

The influence of induction speed on the frontal (processed) EEG
- PMID: 33173114
- PMCID: PMC7655958
- DOI: 10.1038/s41598-020-76323-8
The influence of induction speed on the frontal (processed) EEG
Abstract
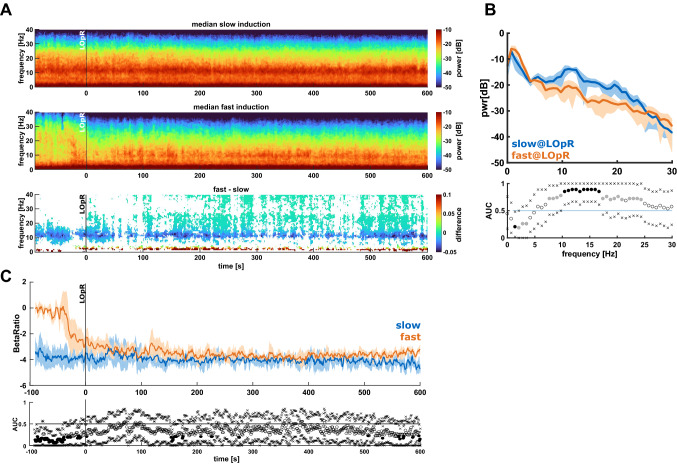
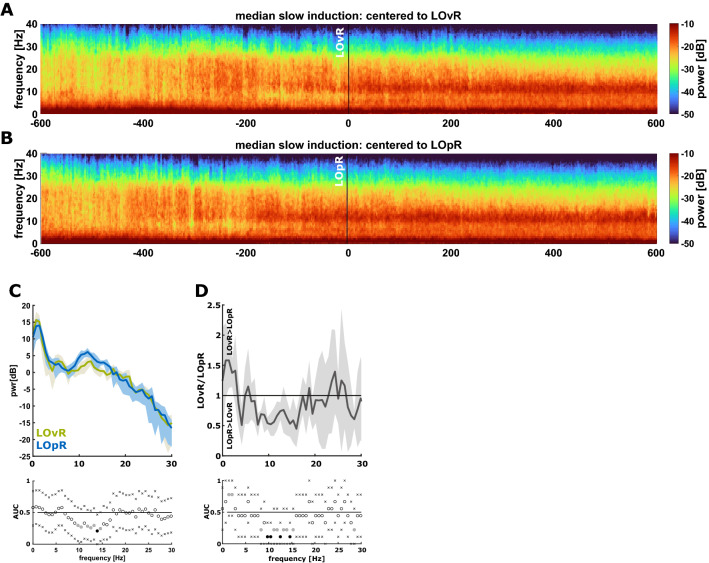
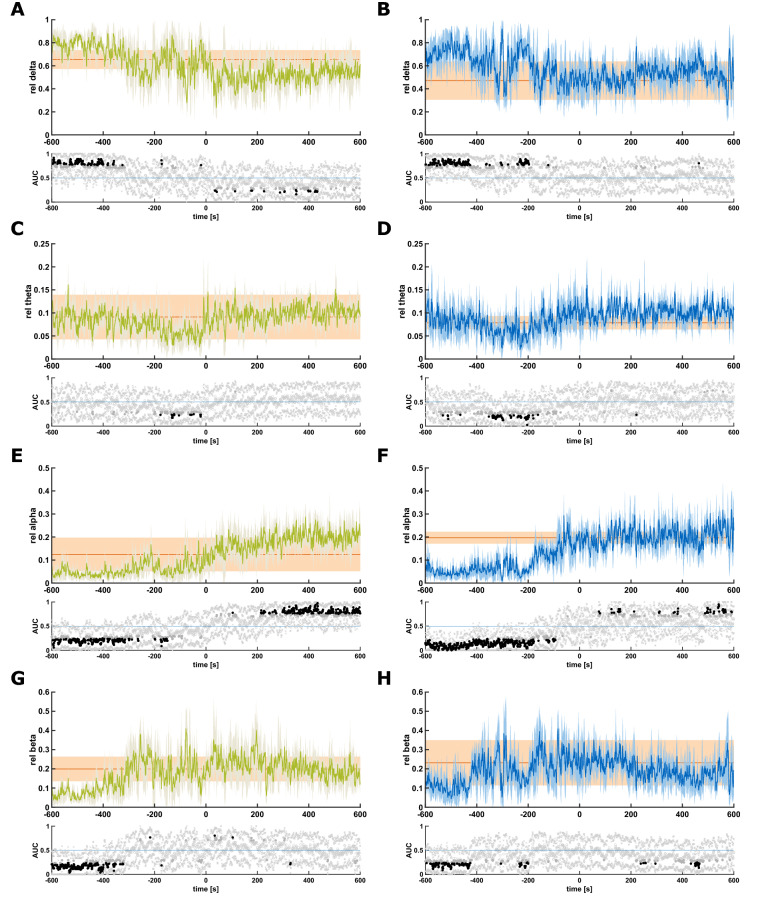
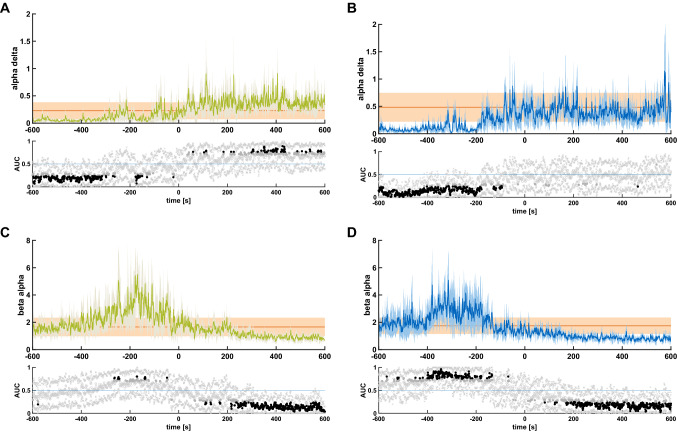
The intravenous injection of the anaesthetic propofol is clinical routine to induce loss of responsiveness (LOR). However, there are only a few studies investigating the influence of the injection rate on the frontal electroencephalogram (EEG) during LOR. Therefore, we focused on changes of the frontal EEG especially during this period. We included 18 patients which were randomly assigned to a slow or fast induction group and recorded the frontal EEG. Based on this data, we calculated the power spectral density, the band powers and band ratios. To analyse the behaviour of processed EEG parameters we calculated the beta ratio, the spectral entropy, and the spectral edge frequency. Due to the prolonged induction period in the slow injection group we were able to distinguish loss of responsiveness to verbal command (LOvR) from loss of responsiveness to painful stimulus (LOpR) whereas in the fast induction group we could not. At LOpR, we observed a higher relative alpha and beta power in the slow induction group while the relative power in the delta range was lower than in the fast induction group. When concentrating on the slow induction group the increase in relative alpha power pre-LOpR and even before LOvR indicated that frontal EEG patterns, which have been suggested as an indicator of unconsciousness, can develop before LOR. Further, LOvR was best reflected by an increase of the alpha to delta ratio, and LOpR was indicated by a decrease of the beta to alpha ratio. These findings highlight the different spectral properties of the EEG at various levels of responsiveness and underline the influence of the propofol injection rate on the frontal EEG during induction of general anesthesia.
Conflict of interest statement
The authors declare no competing interests.
Figures
Similar articles
-
Permutation Entropy Does Not Track the Electroencephalogram-Related Manifestations of Paradoxical Excitation During Propofol-Induced Loss of Responsiveness: Results From a Prospective Observational Cohort Study.Anesth Analg. 2025 Jan 1;140(1):136-144. doi: 10.1213/ANE.0000000000006919. Epub 2024 Feb 27. Anesth Analg. 2025. PMID: 38412114
-
Correlation of Narcotrend Index, entropy measures, and spectral parameters with calculated propofol effect-site concentrations during induction of propofol-remifentanil anaesthesia.J Clin Monit Comput. 2004 Aug;18(4):231-40. doi: 10.1007/s10877-005-2917-6. J Clin Monit Comput. 2004. PMID: 15779834 Clinical Trial.
-
Frequency- and state-dependent dynamics of EEG microstates during propofol anesthesia.Neuroimage. 2025 Apr 15;310:121159. doi: 10.1016/j.neuroimage.2025.121159. Epub 2025 Mar 18. Neuroimage. 2025. PMID: 40113116
-
The neural correlates of psychosocial stress: A systematic review and meta-analysis of spectral analysis EEG studies.Neurobiol Stress. 2022 Apr 26;18:100452. doi: 10.1016/j.ynstr.2022.100452. eCollection 2022 May. Neurobiol Stress. 2022. PMID: 35573807 Free PMC article. Review.
-
General anesthesia, sleep, and coma.N Engl J Med. 2010 Dec 30;363(27):2638-50. doi: 10.1056/NEJMra0808281. N Engl J Med. 2010. PMID: 21190458 Free PMC article. Review. No abstract available.
Cited by
-
Perioperative Brain Function Monitoring with Electroencephalography in Horses Anesthetized with Multimodal Balanced Anesthetic Protocol Subjected to Surgeries.Animals (Basel). 2022 Oct 20;12(20):2851. doi: 10.3390/ani12202851. Animals (Basel). 2022. PMID: 36290236 Free PMC article.
-
Quantitative relationship between anteriorization of alpha oscillations and level of general anesthesia.J Clin Monit Comput. 2023 Apr;37(2):609-618. doi: 10.1007/s10877-022-00932-z. Epub 2022 Nov 1. J Clin Monit Comput. 2023. PMID: 36316519
-
Unveiling age-independent spectral markers of propofol-induced loss of consciousness by decomposing the electroencephalographic spectrum into its periodic and aperiodic components.Front Aging Neurosci. 2023 Jan 18;14:1076393. doi: 10.3389/fnagi.2022.1076393. eCollection 2022. Front Aging Neurosci. 2023. PMID: 36742202 Free PMC article.
-
Linear thinking does not reflect the newer 21st-century anesthesia concepts. A narrative review.J Clin Monit Comput. 2023 Oct;37(5):1133-1144. doi: 10.1007/s10877-023-01021-5. Epub 2023 May 2. J Clin Monit Comput. 2023. PMID: 37129792 Review.
-
Age-dependent changes in the power spectrum conflate composite scores to assess brain frailty.Clin Neurophysiol Pract. 2025 Jun 19;10:209-217. doi: 10.1016/j.cnp.2025.06.002. eCollection 2025. Clin Neurophysiol Pract. 2025. PMID: 40655488 Free PMC article.
References
-
- Snow JD. On the Inhalation of the Vapour of Ether in Surgical Operations. London: John Churchill; 1847.
-
- Guedel AE. Stages of anesthesia and a re-classification of the signs of anesthesia*. Anesth. Analg. 1927;6:157–162. doi: 10.1213/00000539-192708000-00001. - DOI
-
- Lundy J. Balanced anaesthesia. Minn. Med. 1926;9:399.
-
- Garoud F, Lequeux PY, Bejjani G, Barvais L. The influence of the dose on the time to peak effect of propofol: Preliminary results: A-528. Eur. J. Anaesthesiol. 2006;23:137. doi: 10.1097/00003643-200606001-00490. - DOI
Publication types
MeSH terms
Substances
LinkOut - more resources
Full Text Sources
