. 2020 Nov 10;10(1):19457.
doi: 10.1038/s41598-020-76257-1.

Modeling and forecasting the early evolution of the Covid-19 pandemic in Brazil

Affiliations

Modeling and forecasting the early evolution of the Covid-19 pandemic in Brazil

Saulo B Bastos et al. Sci Rep. .

Abstract

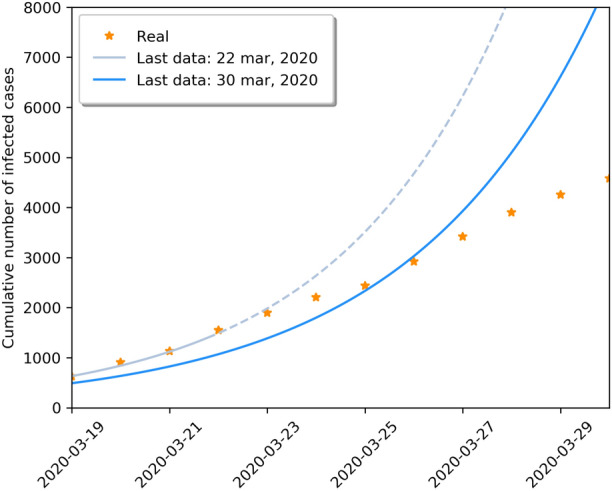
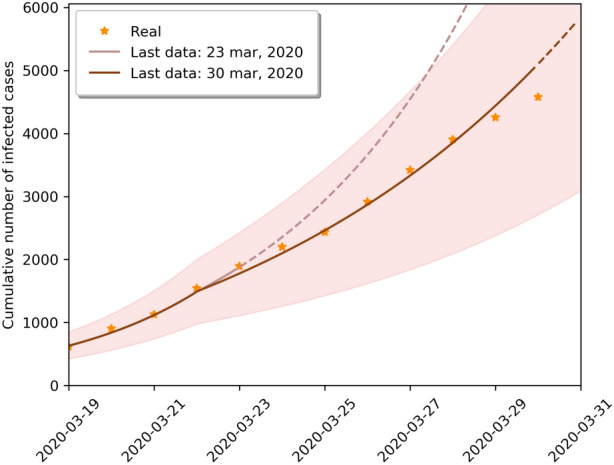
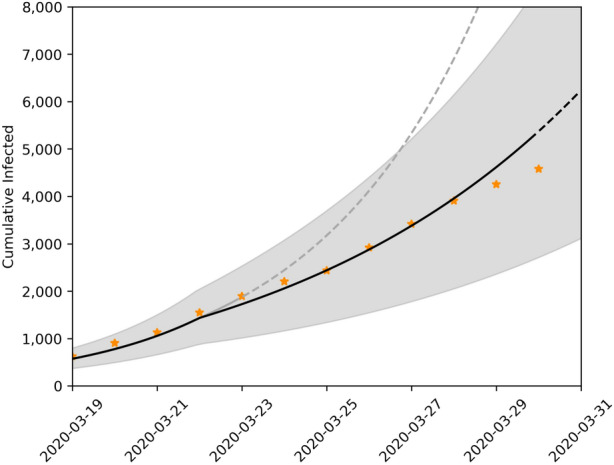
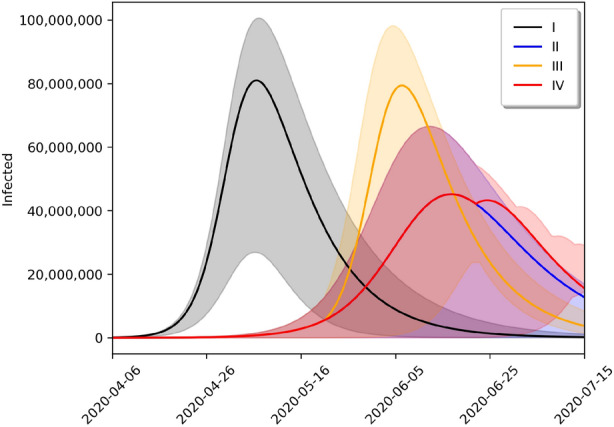
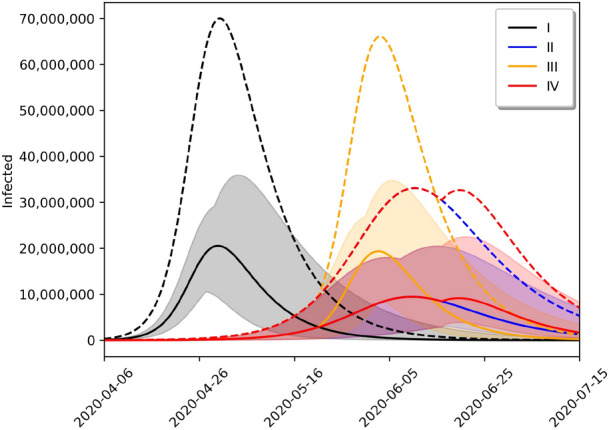
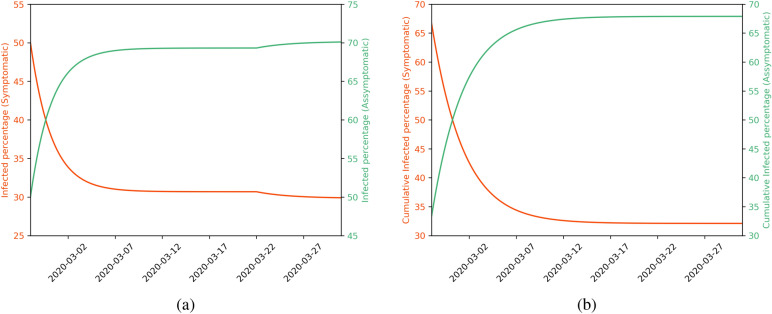
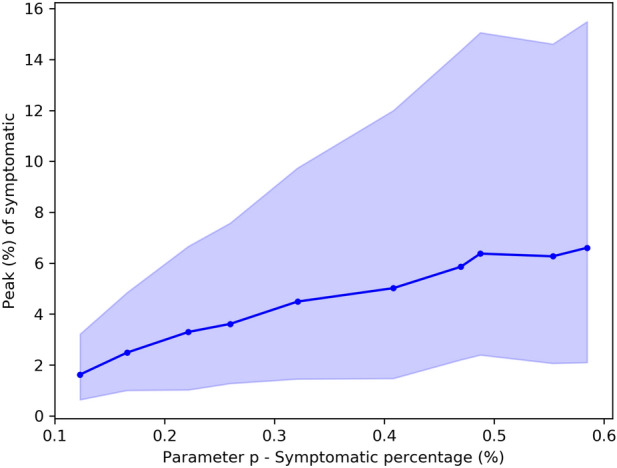
We model and forecast the early evolution of the COVID-19 pandemic in Brazil using Brazilian recent data from February 25, 2020 to March 30, 2020. This early period accounts for unawareness of the epidemiological characteristics of the disease in a new territory, sub-notification of the real numbers of infected people and the timely introduction of social distancing policies to flatten the spread of the disease. We use two variations of the SIR model and we include a parameter that comprises the effects of social distancing measures. Short and long term forecasts show that the social distancing policy imposed by the government is able to flatten the pattern of infection of the COVID-19. However, our results also show that if this policy does not last enough time, it is only able to shift the peak of infection into the future keeping the value of the peak in almost the same value. Furthermore, our long term simulations forecast the optimal date to end the policy. Finally, we show that the proportion of asymptomatic individuals affects the amplitude of the peak of symptomatic infected, suggesting that it is important to test the population.


Conflict of interest statement

The authors declare no competing interests.

Figures

Figure 1
Figure 1
Estimations of the SIRD model for different final date points. The solid line corresponds to the last date which the model was estimated, and the dashed line are model predictions. We represent the real data as points.
Figure 2
Figure 2
Short term forecast of the SIRD model taking into account government social distance measures. The solid line corresponds to the last date which the model was estimated, and the dashed line are model predictions. We show the evolution of the cumulative number of infected with 95% confidence interval. We represent the real data as points.
Figure 3
Figure 3
Short term forecast of the SIRASD model taking into account government social distance measures. The solid line corresponds to the last date which the model was estimated, and the dashed line are model predictions. We show the evolution of the infected (assymptomatic, symptomatic and both) with 95% confidence interval. We represent the real data as points.
Figure 4
Figure 4
Long term forecasts of number of infected for different scenarios using the SIRD model. Black, blue, yellow and red lines represent scenarios I–IV, respectively.
Figure 5
Figure 5
Long term forecasts of number of infected for different scenarios using the SIRASD model. Black, blue, yellow and red lines represent scenarios I–IV, respectively. While solid lines represent the symptomatic infected individuals, dashed lines represent total infected individuals.
Figure 6
Figure 6
Proportions of asymptomatic and symptomatic over time using IA,0=1. We show the instant proportion of infected (left) and the cumulative number of infected (right). Approximately 70% are asymptomatic in March 30, 2020, which corresponds to 68% cumulatively or (1-p).
Figure 7
Figure 7
The effect of symptomatic percentage (parameter p) in the proportion of symptomatic in the peak.

References

    1. World Heath Organization. Coronavirus overview. https://www.who.int/health-topics/coronavirus (2020).
    1. Adam D. The simulations driving the world’s response to covid-19. How epidemiologists rushed to model the coronavirus pandemic? Nature. 2020;20:20. doi: 10.1038/s41586-020-2678-x. - DOI - PubMed
    1. Grassly N, Fraser C. Mathematical models of infectious disease transmission. Nat. Rev. Microbiol. 2008;6:477–487. doi: 10.1038/nrmicro1845. - DOI - PMC - PubMed
    1. Keeling, M. J. & Rohani, P. Modeling infectious diseases in humans and animals (2011).
    1. Brauer, F., Castillo-Chavez, C. & Feng, Z. Mathematical models in epidemiology (2019).

Publication types