. 2020 Nov 10;10(1):19417.
doi: 10.1038/s41598-020-76474-8.

Gut microbiota and metabolic health among overweight and obese individuals

Affiliations

Gut microbiota and metabolic health among overweight and obese individuals

Mi-Hyun Kim et al. Sci Rep. .

Abstract

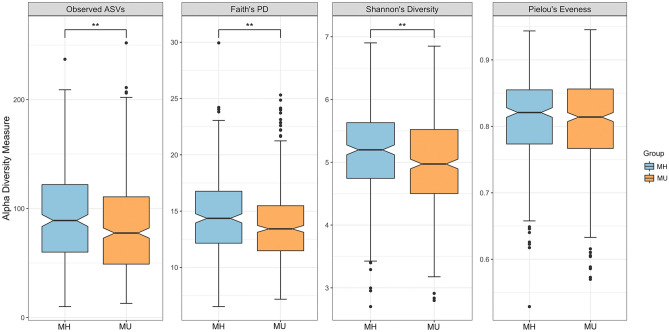
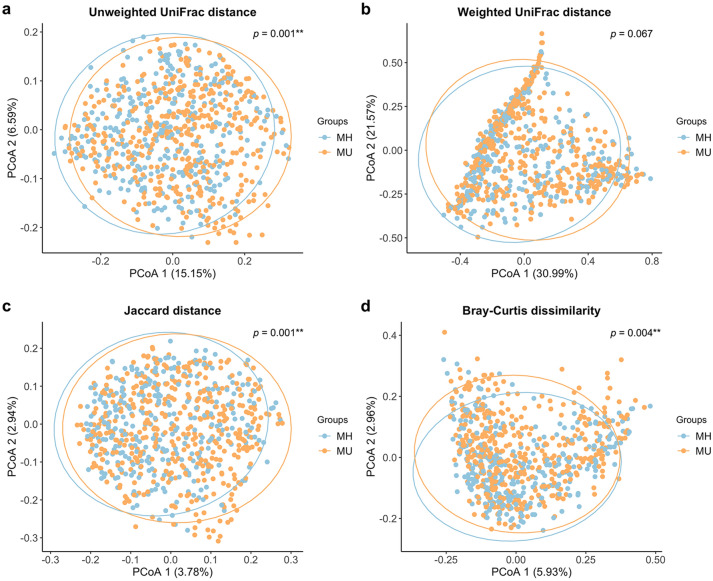
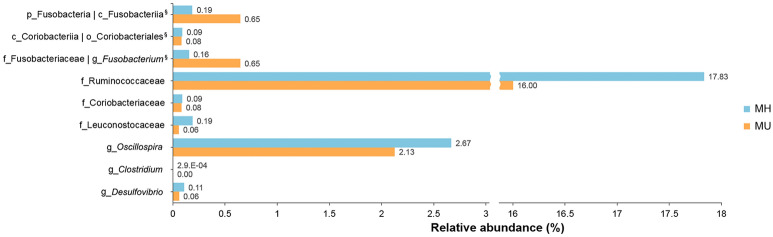
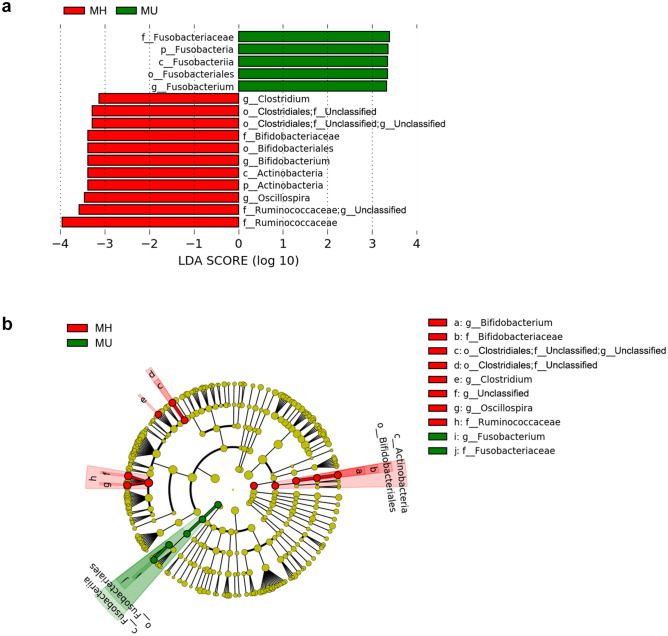
Although obesity is associated with numerous diseases, the risks of disease may depend on metabolic health. Associations between the gut microbiota, obesity, and metabolic syndrome have been reported, but differences in microbiomes according to metabolic health in the obese population have not been explored in previous studies. Here, we investigated the composition of gut microbiota according to metabolic health status in obese and overweight subjects. A total of 747 overweight or obese adults were categorized by metabolic health status, and their fecal microbiota were profiled using 16S ribosomal RNA gene sequencing. We classified these adults into a metabolically healthy group (MH, N = 317) without any components of metabolic syndrome or a metabolically unhealthy group (MU, N = 430) defined as having at least one metabolic abnormality. The phylogenetic and non-phylogenetic alpha diversity for gut microbiota were lower in the MU group than the MH group, and there were significant differences in gut microbiota bacterial composition between the two groups. We found that the genus Oscillospira and the family Coriobacteriaceae were associated with good metabolic health in the overweight and obese populations. This is the first report to describe gut microbial diversity and composition in metabolically healthy and unhealthy overweight and obese individuals. Modulation of the gut microbiome may help prevent metabolic abnormalities in the obese population.


Conflict of interest statement

The authors declare no competing interests.

Figures

Figure 1
Figure 1
Alpha diversity among groups. Diversity was significant for observed features (ASVs) (p = 3.63 × 10–3, Kruskal–Wallis test), phylogenetic diversity (p = 1.96 × 10–4, Kruskal–Wallis test), Shannon index (p = 1.03 × 10–3, Kruskal–Wallis test), and Pielou’s evenness (p = 0.512, Kruskal–Wallis test). *p < 0.05, **p < 0.01. Notched boxes indicate interquartile range (IQR) of 25th to 75th percentiles. The median value is shown as a line within the box, and the notch indicates the 95% confidence interval for the median. Whiskers extend to the most extreme value within 1.5 × IQR. Possible outliers are shown as dots.
Figure 2
Figure 2
Principal Coordinate Analysis (PCoA) plots of beta diversity. Statistical significance between metabolically healthy (MH) and metabolically unhealthy (MU) groups using distance matrices for beta-diversity: (a) unweighted UniFrac distance, (b) weighted UniFrac distance, (c) Jaccard distance, and (d) Bray–Curtis dissimilarity indices. Statistics were calculated using pairwise PERMANOVA with 999 permutations. **p < 0.01. Ellipses represent 95% confidence interval for each group.
Figure 3
Figure 3
Bar plots for relative abundance of the significant taxa in metabolically healthy (MH) and metabolically unhealthy (MU) groups. The x-axis shows the means proportion of the significantly different taxa between the two groups. §The taxa showed the same relative abundance at both taxa levels.
Figure 4
Figure 4
Differentially abundant bacterial taxa in fecal samples from the MH and MU groups in overweight and obese subjects. (a) A forest plot showing taxa that were significantly differentially abundant between the MH (red) and MU (green) groups as determined using the Kruskal–Wallis test. LDA score (effect size) indicating significant differences in bacterial taxa (LDA score > 3.0; alpha value p < 0.05). (b) Cladogram generated using the LEfSe method showing the phylogenetic distribution of microbes associated with the MH and MU groups. Taxonomic levels of phylum, class, and order are labelled, while family and genus are abbreviated. Plots were depicted using LEfSe of Galaxy of the Huttenhower lab.
Figure 5
Figure 5
Prediction of metagenome functional content correlated with MH and MU groups using PICRUSt2. Extended error bar plot for each pathway indicating differences in mean proportions for each pair of groups. Two-tailed Welch’s t test produced a q < 0.05, which was adjusted using the Benjamini–Hochberg method (FDR).

References

    1. Iacobini C, Pugliese G, Blasetti Fantauzzi C, Federici M, Menini S. Metabolically healthy versus metabolically unhealthy obesity. Metab. Clin. Exp. 2019;92:51–60. doi: 10.1016/j.metabol.2018.11.009. - DOI - PubMed
    1. Phillips CM. Metabolically healthy obesity across the life course: epidemiology, determinants, and implications. Ann. N. Y. Acad. Sci. 2017;1391:85–100. doi: 10.1111/nyas.13230. - DOI - PubMed
    1. Hinnouho GM, et al. Metabolically healthy obesity and the risk of cardiovascular disease and type 2 diabetes: the Whitehall II cohort study. Eur. Heart J. 2015;36:551–559. doi: 10.1093/eurheartj/ehu123. - DOI - PMC - PubMed
    1. Phillips CM. Metabolically healthy obesity: definitions, determinants and clinical implications. Rev. Endocr. Metab. Disord. 2013;14:219–227. doi: 10.1007/s11154-013-9252-x. - DOI - PubMed
    1. Mongraw-Chaffin M, et al. Metabolically healthy obesity, transition to metabolic syndrome, and cardiovascular risk. J. Am. Coll. Cardiol. 2018;71:1857–1865. doi: 10.1016/j.jacc.2018.02.055. - DOI - PMC - PubMed

Publication types

Substances