. 2020 Nov 10;10(1):19436.
doi: 10.1038/s41598-020-76332-7.

Pulmonary surfactant inhibition of nanoparticle uptake by alveolar epithelial cells

Affiliations

Pulmonary surfactant inhibition of nanoparticle uptake by alveolar epithelial cells

M Radiom et al. Sci Rep. .

Abstract

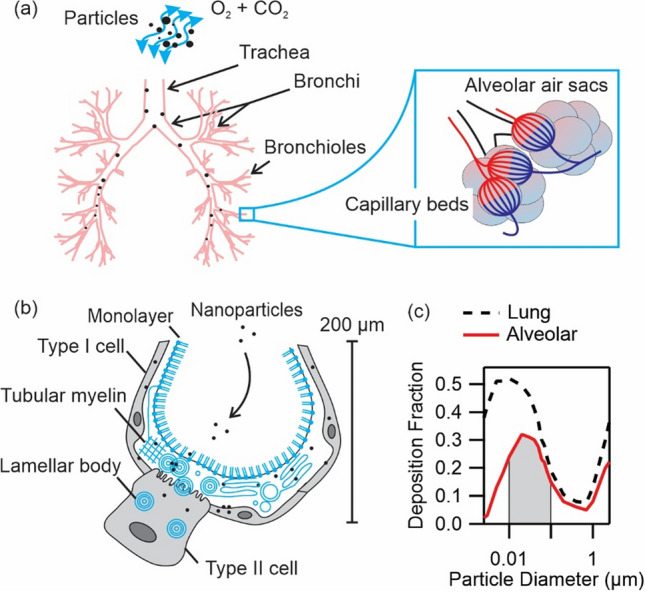
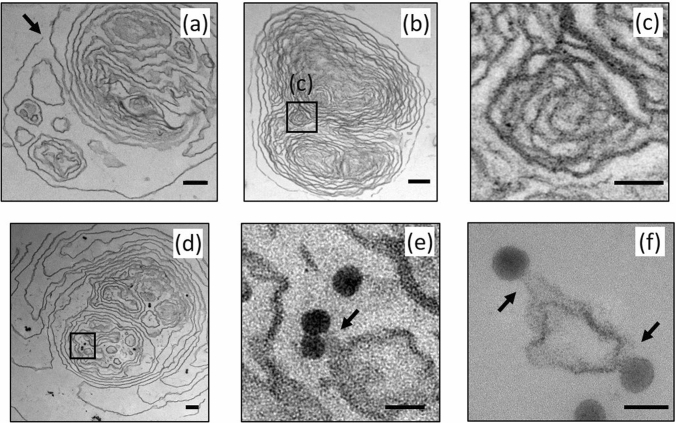
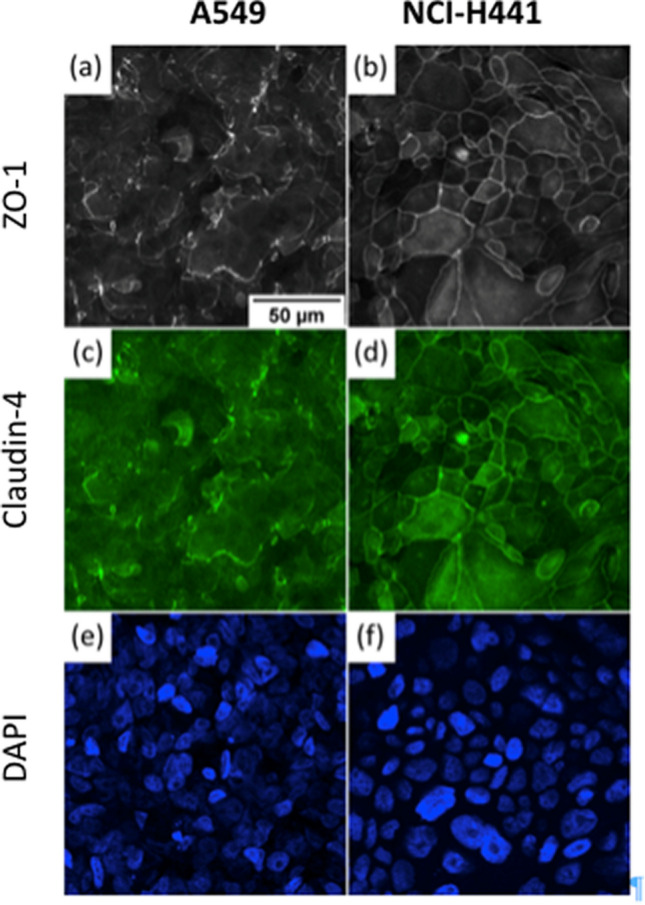
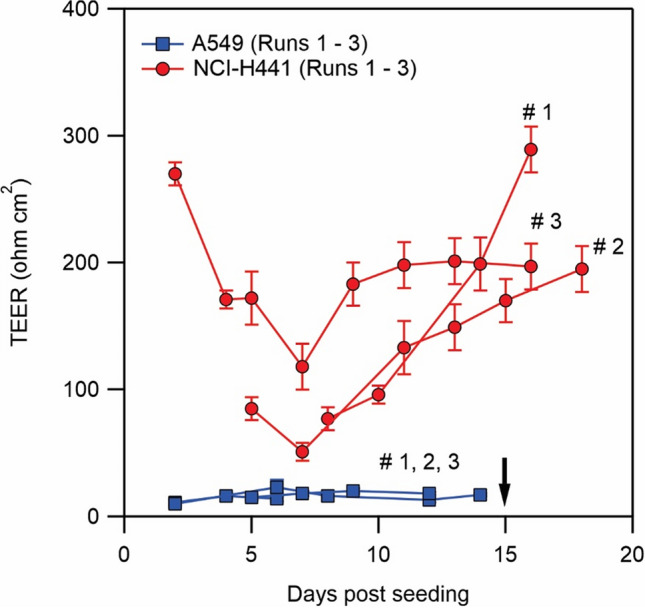
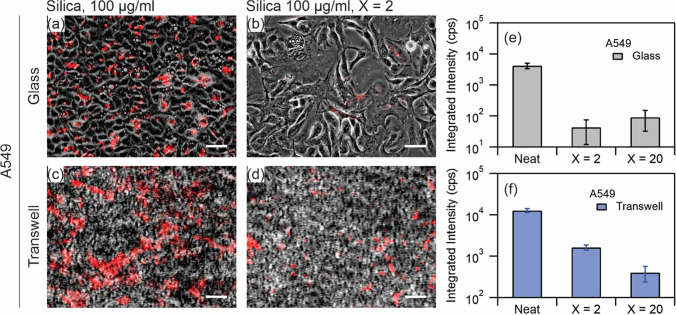
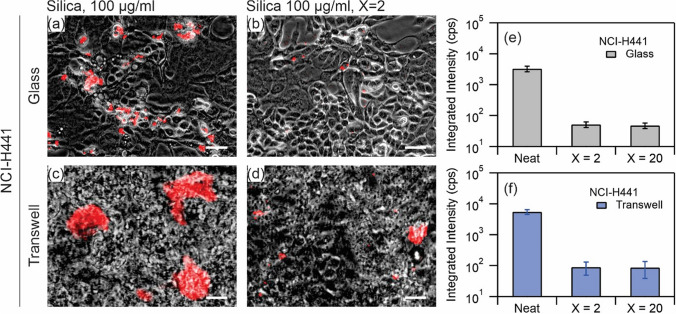
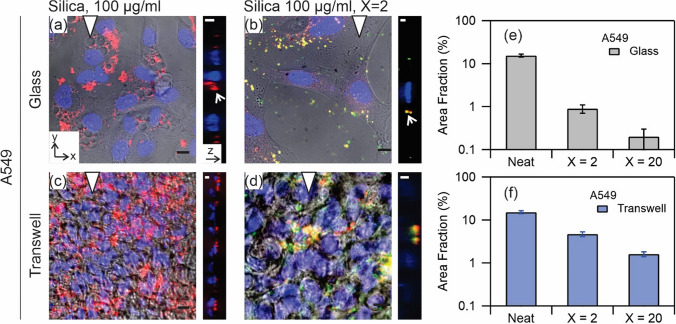
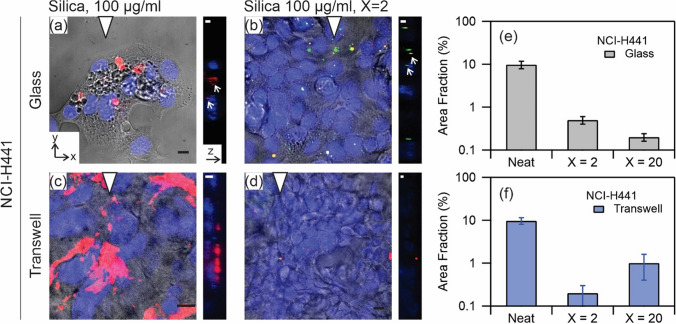
Pulmonary surfactant forms a sub-micrometer thick fluid layer that covers the surface of alveolar lumen and inhaled nanoparticles therefore come in to contact with surfactant prior to any interaction with epithelial cells. We investigate the role of the surfactant as a protective physical barrier by modeling the interactions using silica-Curosurf-alveolar epithelial cell system in vitro. Electron microscopy displays that the vesicles are preserved in the presence of nanoparticles while nanoparticle-lipid interaction leads to formation of mixed aggregates. Fluorescence microscopy reveals that the surfactant decreases the uptake of nanoparticles by up to two orders of magnitude in two models of alveolar epithelial cells, A549 and NCI-H441, irrespective of immersed culture on glass or air-liquid interface culture on transwell. Confocal microscopy corroborates the results by showing nanoparticle-lipid colocalization interacting with the cells. Our work thus supports the idea that pulmonary surfactant plays a protective role against inhaled nanoparticles. The effect of surfactant should therefore be considered in predictive assessment of nanoparticle toxicity or drug nanocarrier uptake. Models based on the one presented in this work may be used for preclinical tests with engineered nanoparticles.


Conflict of interest statement

The authors declare no competing interests.

Figures

Figure 1
Figure 1
(a) Schematic of particles entering the lungs during respiration. Lung sections including trachea, bronchi, bronchioles and alveolar air sacs are depicted. Airway diameters decrease in the same order from 12 mm to 200 µm. Nanoparticles can diffuse deeply and enter the alveolar air sacs. (b) Alveolar epithelium is composed of type I and type II cells. Type II cells secrete surfactant to alveolar lumen which then forms surfactant monolayer at air–liquid interface, tubular myelin and lamellar body structures in the surfactant film. (c) Total lung, i.e. tracheobronchial plus alveolar, and alveolar deposition fractions reproduced from IDEAL model calculations in Ref.. Shaded area marks the deposition fraction of nanoparticles, diameter in the range 10–100 nm, in the alveolar region equal to 15–32%.
Figure 2
Figure 2
Transmission electron microscopy (TEM) images of positively charged silica nanoparticle-Curosurf dispersion at a mixing ratio equal to X = 80. (a) A multivesicular structure containing single vesicles, multivesicular vesicles, and lamellar structures. Arrow points at a disintegration site. (b) A multilamellar vesicle with a size of about 2.2 µm and interlamellar spacing 20–100 nm. Boxed area is enlarged in (c). (c) An inner structure inside a multilamellar vesicle showing lipid membranes with thickness of 5 nm and interlamellar spacing of a few tens of nm. (d) A multivesicular structure enclosing several nanoparticles in singlets, doublets and triplets. Boxed area shows a single particle and a doublet in the vicinity of lipid membranes. The boxed area is enlarged in (e). A total of 18 nanoparticles is found in this 70-nm section. (e) The enlarged boxed area in d. The doublet is in contact with the neighboring lipid membrane as marked with an arrow. (f) Nanoparticles forming adhesion contacts with lipid membranes are marked with arrows. Scale bar 200 nm (a,b,d), 50 nm (c,e,f).
Figure 3
Figure 3
Distribution of tight junction proteins in A549 and NCI-H441. A549 and NCI-H441 (images on the left and right, respectively) were cultured in ALI condition for two weeks. They were then fixed and immunostained to reveal ZO-1 (a,b) and claudin-4 (c,d). Despite maintaining a compact monolayer (DAPI nuclear staining, e,f), A549 exhibits uneven formation of tight junctions where ZO1 and claudin-4 tightly colocalize along the periphery between adjacent cells. NCI-H441 demonstrates much more consistent tight junction formation. Scale bar 50 µm.
Figure 4
Figure 4
Transepithelial electrical resistance (TEER) measured for A549 and NCI-H441. ALI was stablished on day 3 post cell seeding when TEER measurements commenced. Nanoparticle exposure was performed after day 15 marked with a black arrow when TEER of NCI-H441 was above 200 Ω cm2. Independent experiments were performed on different occasions and in each occasion on at least 3 transwell. Error bar is standard deviation for several transwell in a same experiment.
Figure 5
Figure 5
(ad) Superimposed red fluorescence and phase contrast images of A549 exposed to silica nanoparticles at 100 µg ml−1 (a,c) and silica nanoparticles at 100 µg ml−1 mixed with Curosurf at 200 µg ml−1, X = 2 (b,d), on glass (a,b) and on transwell (c,d). Scale bar 50 µm (a,b) and 25 µm (c,d). (e,f) Quantitative analysis of integrated intensity of the fluorescence signal from the three exposure conditions, namely silica at 100 µg ml−1 and silica at 100 µg ml−1 mixed with Curosurf at 200 µg ml−1 (X = 2) and 2 mg ml−1 (X = 20). Each exposure condition was tested in duplicates.
Figure 6
Figure 6
(ad) Superimposed red fluorescence and phase contrast images of NCI-H441 exposed to silica nanoparticles at 100 µg ml−1 (a,c) and silica nanoparticles at 100 µg ml−1 mixed with Curosurf at 200 µg ml−1, X = 2 (b,d), on glass (a,b) and on transwell (c,d). Scale bar 50 µm (a,b) and 25 µm (c,d). (e,f) Quantitative analysis of integrated intensity of the fluorescence signal from the three exposure conditions, namely silica at 100 µg ml−1 and silica at 100 µg ml−1 mixed with Curosurf at 200 µg ml−1 (X = 2) and 2 mg ml−1 (X = 20). Each exposure condition was tested in duplicates.
Figure 7
Figure 7
Confocal microscopy images of A549 exposure to silica nanoparticles at 100 µg ml−1 (a,c) and silica at 100 µg ml−1 mixed with Curosurf at 200 µg ml−1, X = 2 (b,d) on glass (a,b) and on transwell (c,d). The x–y plane images are merges of phase contrast and red, green and blue confocal stacks. The colors are respectively from Cy3-tagged nanoparticles, PKH67-tagged Curosurf and DAPI-tagged nuclei. The presented y–z plane images are merges of red, green and blue confocal stacks, left is bottom and right is top. The triangle positions the y–z plane. Scale bar 10 µm (x–y), and 5 µm (y–z). (e,f) Semi-quantitative analysis of area fraction of nanoparticles per individual cells for three exposure conditions, namely neat silica nanoparticles, and nanoparticles mixed with Curosurf at X = 2 and X = 20.
Figure 8
Figure 8
Confocal microscopy images of NCI-H441 exposure to silica nanoparticles at 100 µg ml−1 (a,c) and silica at 100 µg ml−1 mixed with Curosurf at 200 µg ml−1, X = 2 (b,d) on glass (a,b) and on transwell (c,d). The x–y plane images are merges of phase contrast and red, green and blue confocal stacks. The colors are respectively from Cy3-tagged nanoparticles, PKH67-tagged Curosurf and DAPI-tagged nuclei. The presented y–z plane images are merges of red, green and blue confocal stacks, left is bottom and right is top. The triangle positions the y–z plane. Scale bar 10 µm (x–y), and 5 µm (y–z). (e,f) Semi-quantitative analysis of area fraction of nanoparticles per individual cells for three exposure conditions, namely neat silica nanoparticles, and nanoparticles mixed with Curosurf at X = 2 and X = 20.

References

    1. Lelieveld J, Evans JS, Fnais M, Giannadaki D, Pozzer A. The contribution of outdoor air pollution sources to premature mortality on a global scale. Nature. 2015;525:367–371. doi: 10.1038/nature15371. - DOI - PubMed
    1. Weagle CL, et al. Global sources of fine particulate matter: interpretation of PM2.5 chemical composition observed by SPARTAN using a global chemical transport model. Environ. Sci. Technol. 2018;52:11670–11681. - PubMed
    1. de Donkelaar A, Martin RV, Brauer M, Boys BL. Use of satellite observations for long-term exposure assessment of global concentrations of fine particulate matter. Environ. Health Perspect. 2015;123:135–143. doi: 10.1289/ehp.1408646. - DOI - PMC - PubMed
    1. Hofmann W. Modelling inhaled particle deposition in the human lung—a review. J. Aerosol Sci. 2011;42:693–724. doi: 10.1016/j.jaerosci.2011.05.007. - DOI
    1. Notter RH. Lung Surfactant: Basic Science and Clinical Applications. Boca Raton: CRC Press; 2000.

Publication types

Substances