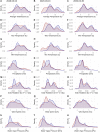
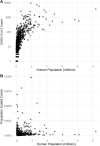
Spatial modeling could not differentiate early SARS-CoV-2 cases from the distribution of humans on the basis of climate in the United States
- PMID: 33173618
- PMCID: PMC7594635
- DOI: 10.7717/peerj.10140
Spatial modeling could not differentiate early SARS-CoV-2 cases from the distribution of humans on the basis of climate in the United States
Abstract
The SARS-CoV-2 coronavirus is wreaking havoc globally, yet, as a novel pathogen, knowledge of its biology is still emerging. Climate and seasonality influence the distributions of many diseases, and studies suggest at least some link between SARS-CoV-2 and weather. One such study, building species distribution models (SDMs), predicted SARS-CoV-2 risk may remain concentrated in the Northern Hemisphere, shifting northward in summer months. Others have highlighted issues with SARS-CoV-2 SDMs, notably: the primary niche of the virus is the host it infects, climate may be a weak distributional predictor, global prevalence data have issues, and the virus is not in population equilibrium. While these issues should be considered, we believe climate's relationship with SARS-CoV-2 is still worth exploring, as it may have some impact on the distribution of cases. To further examine if there is a link to climate, we build model projections with raw SARS-CoV-2 case data and population-scaled case data in the USA. The case data were from across March 2020, before large travel restrictions and public health policies were impacting cases across the country. We show that SDMs built from population-scaled case data cannot be distinguished from control models (built from raw human population data), while SDMs built on raw case data fail to predict the known distribution of cases in the U.S. from March. The population-scaled analyses indicate that climate did not play a central role in early U.S. viral distribution and that human population density was likely the primary driver. We do find slightly more population-scaled viral cases in cooler areas. Ultimately, the temporal and geographic constraints on this study mean that we cannot rule out climate as a partial driver of the SARS-CoV-2 distribution. Climate's role on SARS-CoV-2 should continue to be cautiously examined, but at this time we should assume that SARS-CoV-2 will continue to spread anywhere in the U.S. where governmental policy does not prevent spread.
Keywords: COVID-19; Climate; Coronavirus; SARS-CoV-2; Species distribution modeling; US.
© 2020 Harbert et al.
Conflict of interest statement
The authors have no competing interests to declare.
Figures


References
-
- Alvarez-Ramirez J, Meraz M. Role of meteorological temperature and relative humidity in the January-February 2020 propagation of 2019-nCoV in Wuhan, China. medRxiv. 2020. - DOI
-
- Araújo MB, Naimi B. Spread of SARS-CoV-2 coronavirus likely to be constrained by climate. medRxiv. 2020 doi: 10.1101/2020.03.12.20034728. - DOI
LinkOut - more resources
Full Text Sources
Miscellaneous

