[Preprint]. 2020 Dec 31:rs.3.rs-100914.
doi: 10.21203/rs.3.rs-100914/v2.

Sex differences in viral entry protein expression and host transcript responses to SARS-CoV-2

Affiliations

Sex differences in viral entry protein expression and host transcript responses to SARS-CoV-2

Mengying Sun et al. Res Sq. .

Abstract

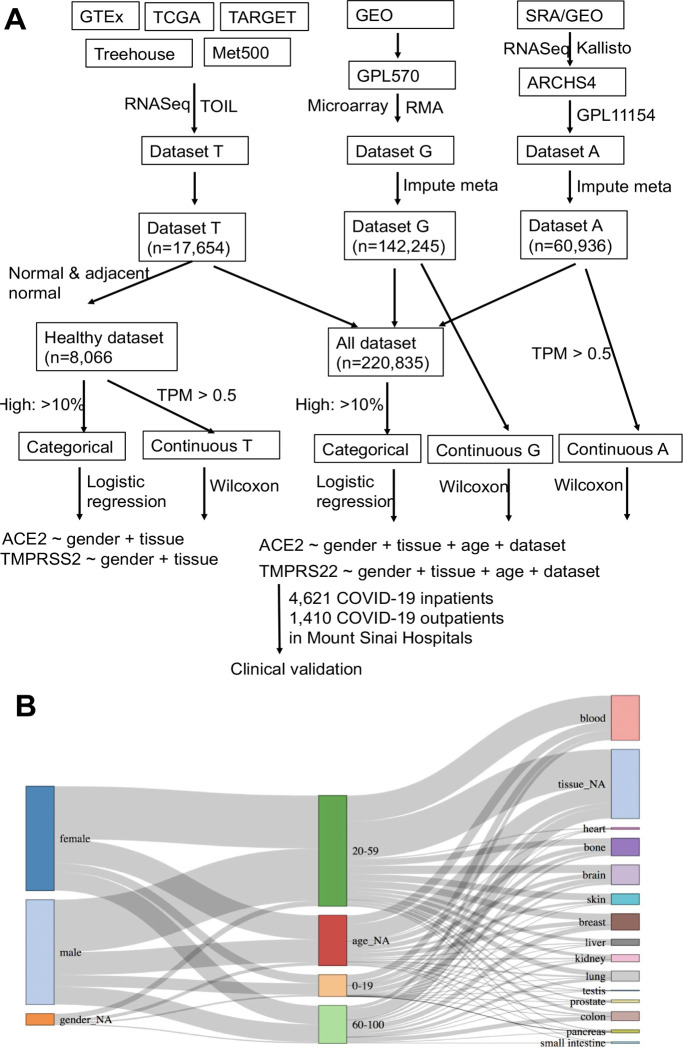
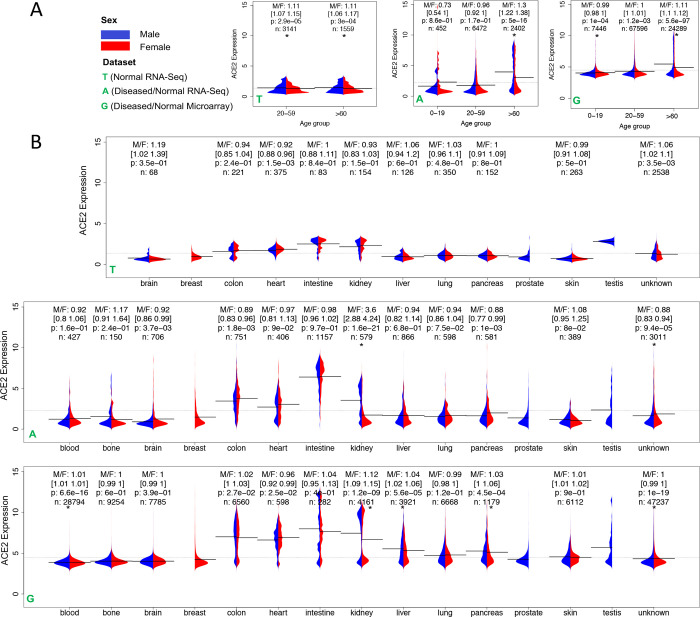
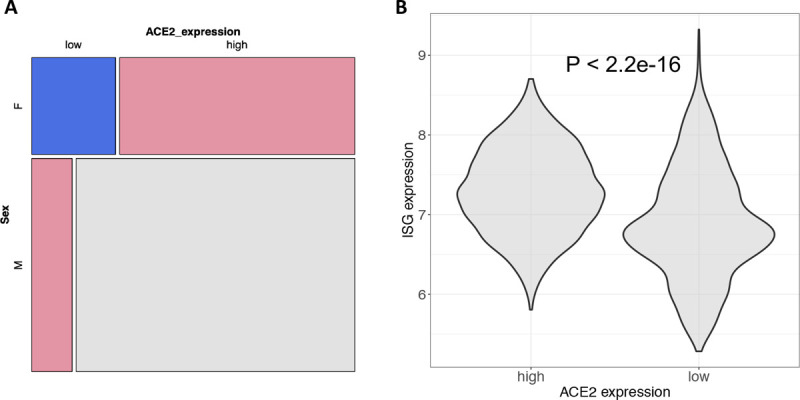
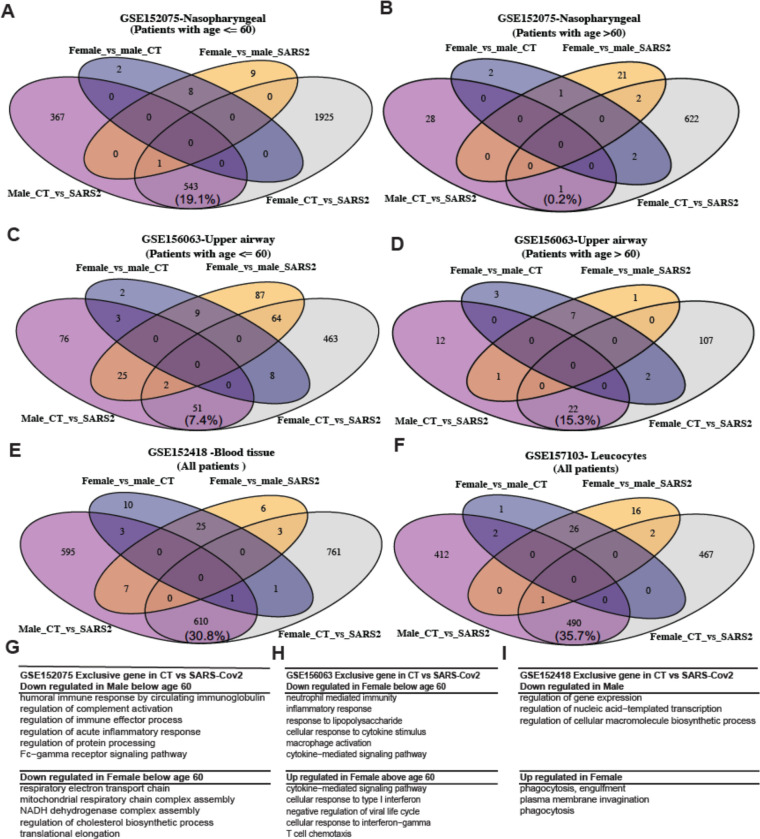
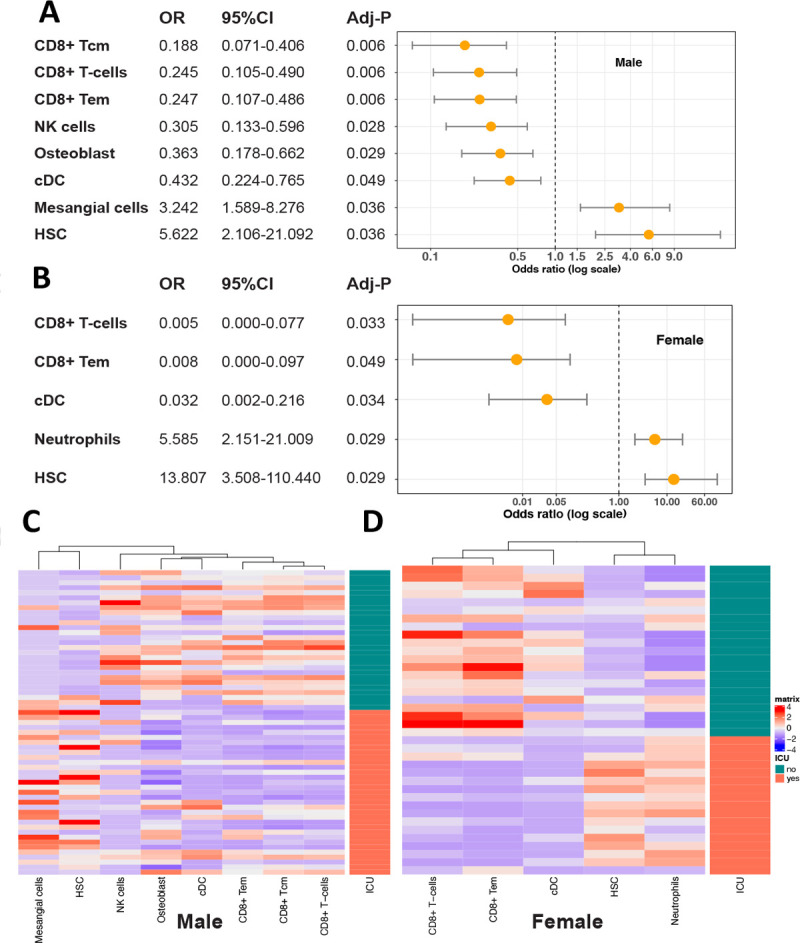
Epidemiological studies suggest that men exhibit a higher mortality rate to COVID-19 than women, yet the underlying biology is largely unknown. Here, we seek to delineate sex differences in the gene expression of viral entry proteins ACE2 and TMPRSS2, and host transcriptional responses to SARS-CoV-2 through large-scale analysis of genomic and clinical data. We first compiled 220,000 human gene expression profiles from three databases and completed the meta-information through machine learning and manual annotation. Large scale analysis of these profiles indicated that male samples show higher expression levels of ACE2 and TMPRSS2 than female samples, especially in the older group (>60 years) and in the kidney. Subsequent analysis of 6,031 COVID-19 patients at Mount Sinai Health System revealed that men have significantly higher creatinine levels, an indicator of impaired kidney function. Further analysis of 782 COVID-19 patient gene expression profiles taken from upper airway and blood suggested men and women present distinct expression changes. Computational deconvolution analysis of these profiles revealed male COVID-19 patients have enriched kidney-specific mesangial cells in blood compared to healthy patients. Together, this study suggests biological differences in the kidney between sexes may contribute to sex disparity in COVID-19.

Keywords: COVID-19; sex difference.


Conflict of interest statement

Competing interests The authors declare no competing interests.

Figures

Figure 1.
Figure 1.
Large-scale analysis of expression differences in virus entry proteins. (A) Data collection and analysis workflow. We defined high-expression as the top 10% within individual datasets (T, G, A) and explored other thresholds as well. For T and A, samples with Transcripts Per Million (TPM) < 0.5 were removed in order to reduce technical noises. ARCHS4: All RNA-seq and CHIP-Seq Signature Search Space developed by Ma’ayan Laboratory; GEO: Gene Expression Omnibus; GTEx: The Genotype-Tissue Expression; Kallisto: program for quantifying abundances of transcripts from bulk and single-cell RNA-Seq data; Meta500: 500 metastatic cancers; RMA: Robust Multi-array Average; SRA: Sequence Read Archive; TARGET: The Therapeutically Applicable Research to Generate Effective Treatments; TCGA: The Cancer Genome Atlas; TOIL: A RNASeq processing pipeline developed by UC Santa Cruz; Treehouse: Treehouse Childhood Cancer Initiative; TPM: Transcripts Per Million. (B) Sankey diagram of gender, age and tissue for the merged dataset. Predictions with low confidence remain as ‘NA’ after imputation (denoted as gender_NA, age_NA and tissue_NA in the diagram). The height of each box in a column represents the proportion of corresponding group in the dataset.
Figure 2.
Figure 2.
ACE2 expression across (A) age groups and (B) tissues in three datasets Treehouse (T), ARCHS4 (A), and GPL570 (G). In T, only normal and adjacent normal tissue samples were selected. Due to the limited sample size (n), the 0–19 age group, and the blood and bone tissues were not included in (A) and (B), respectively. M/F represents the ratio of mean expression between males and females. The 95% confidence interval of ratio was obtained using bootstrapping, i.e., sampling with replacement and calculating the ratio for 1000 times with 2.5% and 97.5% quantile reported. P-value was computed from a two-sided Wilcoxon rank-sum test on the difference of median expression between sexes. * indicates P < 0.001. The bar and the dashed line show the mean of expressions in each group and the mean of all expressions, respectively.
Figure 3:
Figure 3:
ACE2 expression in the kidney. (A) mosaic plot showing ACE2 expression differences between sexes in 2,033 kidney tissue samples with explicit information of disease status (1,654 kidney diseases and 379 normal tissues). Disease status was manually annotated based on sample characteristics provided in GEO. (B) correlation between ACE2 expression and ISG average expression. ISG genes were compiled based on the GO terms listed in Ziegler et al. 23. Wilcoxon rank-sum test was used to test the difference and GPL570 data were employed for both figures.
Figure 4.
Figure 4.
Host responses to SARS-CoV-2 in upper airway and blood. Differentially expressed (DE) genes in different comparisons (Male CT vs. SARS2, Female CT vs. SARS2, Female CT vs. Male CT, and Female SARS2 vs. Male SARS2) across multiple datasets: (A) from upper airway at age <= 60 years, (B) from upper airway at age >60 years, (C) from upper airway at age <= 60 years, (D) from upper airway at age >60 years, (E) from blood PBMC and (F) from blood leucocytes. Enriched biological processes of sex-specific genes (i.e., Male_CT_vs_SARS2, Female_CT_vs_SARS2): (G) from nasopharyngeal, (H) from upper airway, and (I) from blood leukocytes. Fold change > 2 and adjusted p-value < 0.001 were used to select DE genes and adjusted p-value < 0.1 was used to identify significantly enriched GO biological processes. Those DE gene sets without any significant GO terms were not shown. Patients were stratified into two groups (<= 60 and > 60) whenever age information was available and sample size in each group is greater than 10. The percentage of common DE genes was computed as the ratio between the number of common DE genes and the total number of distinct genes (Male_CT_vs_SARS2 plus Female_CT_vs_SARS2).
Figure 5:
Figure 5:
Odds ratio (OR) and enrichment of cells in COVID-19 patients. Odds ratios of different cells between ICU and non-ICU patients (A) in male and (B) in female. Logistic regression was performed with non-ICU patients as the reference and age adjusted. P values were corrected by a multiple hypothesis test and cell types with an adjusted p value <= 0.05 were selected. Heatmaps show the enrichment value of cells in male (C) and (D) in female.

References

    1. Cai H. Sex difference and smoking predisposition in patients with COVID-19. Lancet Respir Med 8, e20 (2020). - PMC - PubMed
    1. Scully E. P., Haverfield J., Ursin R. L., Tannenbaum C. & Klein S. L. Considering how biological sex impacts immune responses and COVID-19 outcomes. Nat. Rev. Immunol. (2020) doi: 10.1038/s41577-020-0348-8. - DOI - PMC - PubMed
    1. Klang E. et al. Sex Differences in Age and Comorbidities for COVID-19 Mortality in Urban New York City. SN Compr Clin Med 1–4 (2020) doi: 10.1007/s42399-020-00430-w. - DOI - PMC - PubMed
    1. The Sex, Gender and COVID-19 Project | Global Health 50/50. https://globalhealth5050.org/the-sex-gender-and-covid-19-project/.
    1. COVID-19 Provisional Counts - Weekly Updates by Select Demographic and Geographic Characteristics. https://www.cdc.gov/nchs/nvss/vsrr/covid_weekly/index.htm (2020).

Publication types

LinkOut - more resources