[Preprint]. 2020 Nov 5:2020.11.03.20225409.
doi: 10.1101/2020.11.03.20225409.

COVID-19 reopening strategies at the county level in the face of uncertainty: Multiple Models for Outbreak Decision Support

Katriona Shea  1 Rebecca K Borchering  1 William J M Probert  2 Emily Howerton  1 Tiffany L Bogich  1 Shouli Li  3 Willem G van Panhuis  4 Cecile Viboud  5 Ricardo Aguás  2 Artur Belov  6 Sanjana H Bhargava  7 Sean Cavany  8 Joshua C Chang  9   10 Cynthia Chen  11 Jinghui Chen  12 Shi Chen  13   14 YangQuan Chen  15 Lauren M Childs  16 Carson C Chow  17 Isabel Crooker  18 Sara Y Del Valle  18 Guido España  8 Geoffrey Fairchild  18 Richard C Gerkin  19 Timothy C Germann  18 Quanquan Gu  12 Xiangyang Guan  11 Lihong Guo  20 Gregory R Hart  21 Thomas J Hladish  7   22 Nathaniel Hupert  23 Daniel Janies  24 Cliff C Kerr  21 Daniel J Klein  21 Eili Klein  25   26 Gary Lin  25 Carrie Manore  18 Lauren Ancel Meyers  27 John Mittler  28 Kunpeng Mu  29 Rafael C Núñez  21 Rachel Oidtman  8 Remy Pasco  30 Ana Pastore Y Piontti  29 Rajib Paul  13 Carl A B Pearson  31 Dianela R Perdomo  7 T Alex Perkins  8 Kelly Pierce  32 Alexander N Pillai  7 Rosalyn Cherie Rael  18 Katherine Rosenfeld  21 Chrysm Watson Ross  18 Julie A Spencer  18 Arlin B Stoltzfus  33 Kok Ben Toh  34 Shashaank Vattikuti  17 Alessandro Vespignani  29 Lingxiao Wang  12 Lisa White  2 Pan Xu  12 Yupeng Yang  26 Osman N Yogurtcu  6 Weitong Zhang  12 Yanting Zhao  35 Difan Zou  12 Matthew Ferrari  1 David Pannell  36 Michael Tildesley  37 Jack Seifarth  1 Elyse Johnson  1 Matthew Biggerstaff  38 Michael Johansson  38 Rachel B Slayton  38 John Levander  39 Jeff Stazer  39 Jessica Salerno  39 Michael C Runge  40
Affiliations

COVID-19 reopening strategies at the county level in the face of uncertainty: Multiple Models for Outbreak Decision Support

Katriona Shea et al. medRxiv. .

Update in

  • Multiple models for outbreak decision support in the face of uncertainty.
    Shea K, Borchering RK, Probert WJM, Howerton E, Bogich TL, Li SL, van Panhuis WG, Viboud C, Aguás R, Belov AA, Bhargava SH, Cavany SM, Chang JC, Chen C, Chen J, Chen S, Chen Y, Childs LM, Chow CC, Crooker I, Del Valle SY, España G, Fairchild G, Gerkin RC, Germann TC, Gu Q, Guan X, Guo L, Hart GR, Hladish TJ, Hupert N, Janies D, Kerr CC, Klein DJ, Klein EY, Lin G, Manore C, Meyers LA, Mittler JE, Mu K, Núñez RC, Oidtman RJ, Pasco R, Pastore Y Piontti A, Paul R, Pearson CAB, Perdomo DR, Perkins TA, Pierce K, Pillai AN, Rael RC, Rosenfeld K, Ross CW, Spencer JA, Stoltzfus AB, Toh KB, Vattikuti S, Vespignani A, Wang L, White LJ, Xu P, Yang Y, Yogurtcu ON, Zhang W, Zhao Y, Zou D, Ferrari MJ, Pannell D, Tildesley MJ, Seifarth J, Johnson E, Biggerstaff M, Johansson MA, Slayton RB, Levander JD, Stazer J, Kerr J, Runge MC. Shea K, et al. Proc Natl Acad Sci U S A. 2023 May 2;120(18):e2207537120. doi: 10.1073/pnas.2207537120. Epub 2023 Apr 25. Proc Natl Acad Sci U S A. 2023. PMID: 37098064 Free PMC article.

Abstract

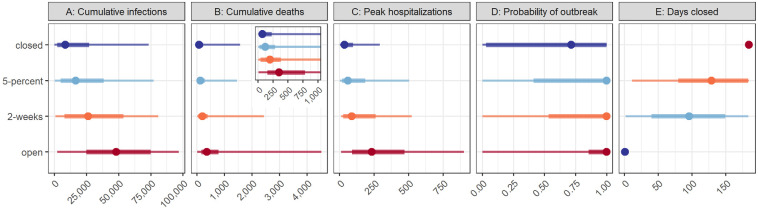
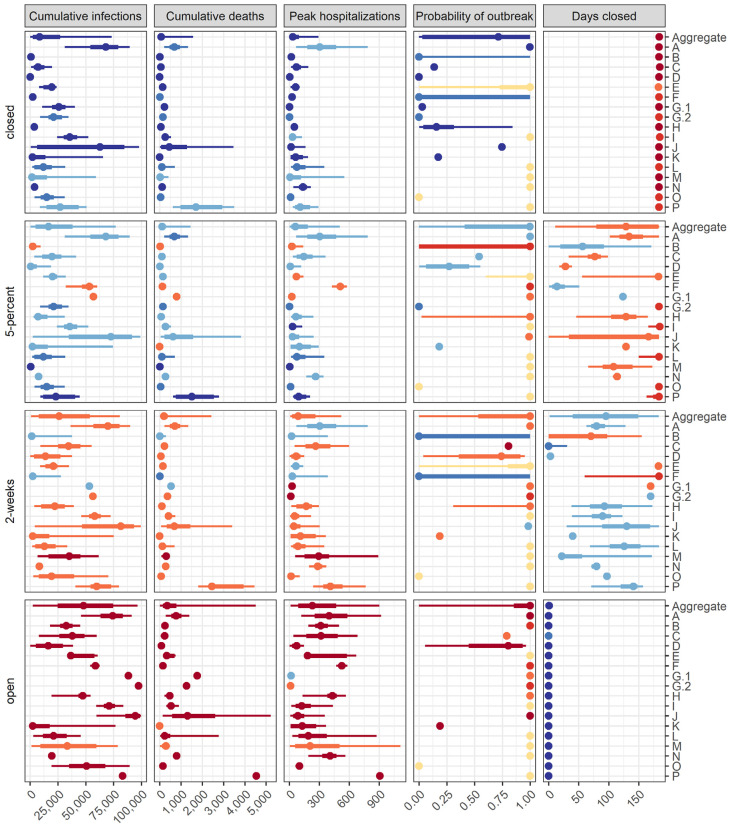
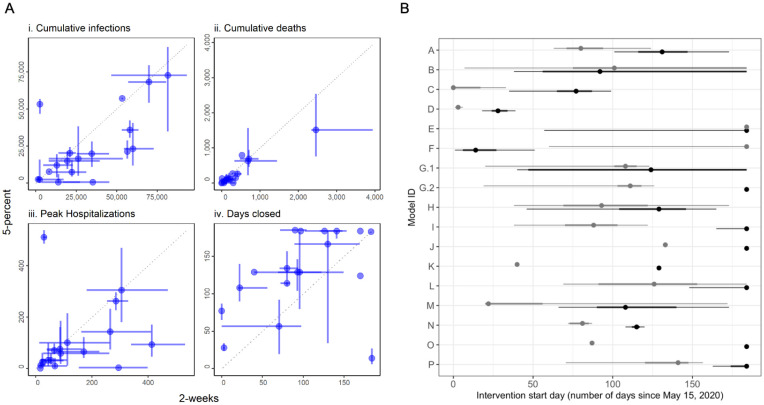
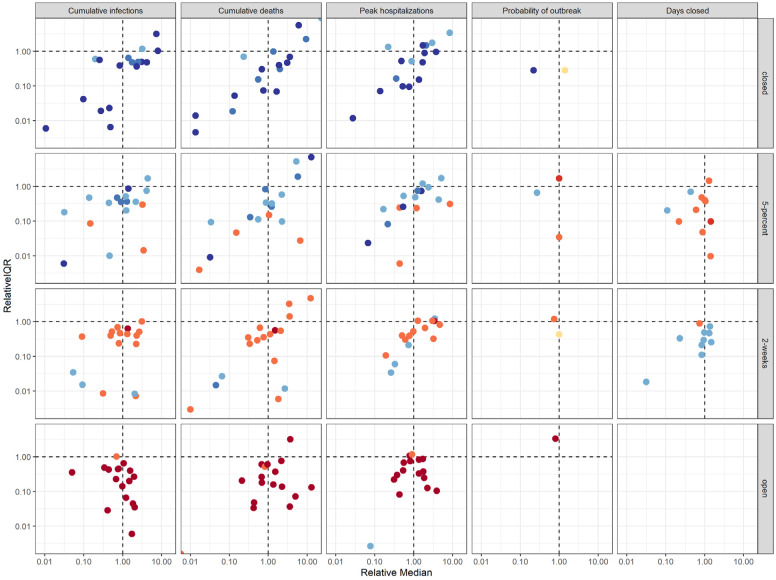
Policymakers make decisions about COVID-19 management in the face of considerable uncertainty. We convened multiple modeling teams to evaluate reopening strategies for a mid-sized county in the United States, in a novel process designed to fully express scientific uncertainty while reducing linguistic uncertainty and cognitive biases. For the scenarios considered, the consensus from 17 distinct models was that a second outbreak will occur within 6 months of reopening, unless schools and non-essential workplaces remain closed. Up to half the population could be infected with full workplace reopening; non-essential business closures reduced median cumulative infections by 82%. Intermediate reopening interventions identified no win-win situations; there was a trade-off between public health outcomes and duration of workplace closures. Aggregate results captured twice the uncertainty of individual models, providing a more complete expression of risk for decision-making purposes.


Figures

Fig. 1:
Fig. 1:. Multiple Models for Outbreak Decision Support (MMODS) framework, specifically for the elicitation in this project.
The Problem is the decision context faced by state and local officials regarding local guidance and regulations concerning the operation of non-essential workplaces, in the face of the COVID-19 pandemic during the period May 15 to November 15, 2020. The 5 Objectives addressed were to minimize: (1) cumulative infected individuals, (2) cumulative COVID-related deaths, (3) peak hospitalizations, (4) probability of a new local outbreak (more than 10 new reported cases/day), and (5) total days workplaces closed, all over the period May 15 to November 15. The four Interventions focused on strategies for re-opening non-essential workplaces, while assuming all schools remaining closed, between May 15 and November 15, 2020: (1) continue with current non-essential workplace closures, (2) open non-essential workplaces when the number of new daily cases is at 5% of peak, (3) open non-essential workplaces 2 weeks after peak, and (4) immediately relax all current restrictions on non-essential workplaces. Loop B coordinates modeling groups to reduce bias and linguistic uncertainty. First, loop B involves independent (round 1) model Projections of all objective-interaction combinations. A structured, facilitated group discussion reduces unwanted uncertainty and also prompts information on additional sources of data used, methods used to incorporate uncertainty, and assumptions made by individual groups, so that the whole collaborative can improve their models. Retention of the remaining model differences allows for a more comprehensive expression of legitimate scientific uncertainty; consensus is not required. Modelling groups then provide updated (round 2) model projections. Loop A provides an opportunity for model groups to interact with decision makers to clarify or update objectives or interventions, i.e., to reduce linguistic uncertainty. Decision Analysis is used to aggregate and analyze the model outputs to rank interventions. If decisions are implemented, then there is also an opportunity for modeling teams to learn from Implementation data and results (loop C).
Fig. 2:
Fig. 2:. Aggregate distribution for target objective and intervention scenario pairs of the 17 models.
Median, 50% prediction interval (PI), and 90% PI are indicated as points, thick lines, and thin lines respectively. The aggregate distribution was calculated as the weighted average of the individual cumulative distribution functions. Colors denote ranking of each intervention for a single objective, where dark blue signifies the lowest value (best performance) and dark red signifies the highest value (worst performance). The five panels show the results for: A) cumulative infections (rather than reported cases) between May 15 and November 15; B) cumulative deaths due to COVID-19 over the same period, with an inset displaying the results for a smaller range of values, beginning with zero and containing the 50% prediction intervals; C) the peak number of hospitalizations over the same period; D) the probability of an outbreak of greater than 10 new cases per day after May 15; and E) the number of days that non-essential workplaces are closed between May 15 and November 15. The interventions include: “closed”, workplace closure throughout the 6-month period; “5-percent”, non-essential workplace re-opening when cases decline below 5% of the peak caseload; “2-weeks”, non-essential workplace re-opening two weeks after the peak; and “open”, immediate re-opening of all workplaces. The setting is a generic US county of 100,000 people that has experienced 180 reported cases and 6 deaths as of May 15, 2020; all schools are assumed to be closed throughout the period.
Fig. 3:
Fig. 3:. Individual model results for each objective and intervention scenario pair.
Median, 50% prediction interval (PI), and 90% PI are indicated as points, thick lines, and thin lines respectively. Colors denote ranking of each intervention by model for a single objective, where dark blue signifies the lowest value (best performance) and dark red signifies the highest value (worst performance). Ties in ranks are colored as intermediate values. Ties between ranks 1 and 2 and ranks 3 and 4 are shown as an intermediate blue and red, respectively; yellow indicates a tie in ranks across all interventions. Each group was assigned a random, unique identification letter that is specified on the vertical axis.
Fig. 4:
Fig. 4:. Comparison between the 2-week and 5-percent interventions.
A) Medians (points) and 50% PIs (lines) displayed pairwise by intervention and for the following objectives: i) cumulative infections, ii) cumulative deaths, iii) peak hospitalizations, and iv) days closed for each model. B) Comparison of intervention start dates for 2-week (grey) vs. 5-percent (black) interventions for each model, where the start date is computed as the number of days from May 15 until the intervention is enacted. Intervention start times of 184 days indicate that the intervention was never triggered in that model. All plots display median (points) and 5th to 95th quantiles (lines) for each intervention. The 2-week intervention trigger to open is the first day for which the 7-day trailing moving average of the number of new daily reported cases has been lower than the maximum for at least 14 days, and has shown a day-to-day decline in smoothed case data for at least 10 of the last 14 days (or, there have been 7 days without any new cases). The 5-percent intervention trigger to open is the first day for which the 7-day trailing moving average of the number of new daily reported cases drops below 5% of the maximum.
Fig. 5:
Fig. 5:. Comparison of individual model results to aggregate results.
The y-axis shows the relative interquartile range (IQR)—the ratio of an individual model’s IQR to the aggregate IQR. The x-axis shows the ratio of an individual model’s median to the aggregate median. Both axes are presented on a log scale. Colors denote ranking of each intervention by models, where dark blue signifies the lowest value (best performance) and dark red signifies the highest value (worst performance). Ties between ranks 1 and 2 and ranks 3 and 4 are shown as an intermediate blue and red, respectively; yellow indicates a tie in ranks across all interventions.

References

    1. Burgman M.A.. Trusting judgements: how to get the best out of experts. Cambridge, UK: Cambridge University Press; 214 p. (2015).
    1. Carlson C J, Dougherty E, Boots M, Getz W, Ryan S J (2018) Consensus and conflict among ecological forecasts of Zika virus outbreaks in the United States. Scientific Reports 8:4921. - PMC - PubMed
    1. den Boon et al., BMC Medicine 17,163 (2019). - PMC - PubMed
    1. Dong E., Du H. and Gardner L., 2020. An interactive web-based dashboard to track COVID-19 in real time. The Lancet Infectious Diseases, 20(5), pp.533–534. - PMC - PubMed
    1. Drake J. (2020) America needs a national center for infectious disease intelligence. The Hill; https://thehill.com/opinion/healthcare/503793-america-needs-a-national-c...

Publication types