

Trends in Poor Health Indicators Among Black and Hispanic Middle-aged and Older Adults in the United States, 1999-2018
- PMID: 33175177
- PMCID: PMC7658737
- DOI: 10.1001/jamanetworkopen.2020.25134
Trends in Poor Health Indicators Among Black and Hispanic Middle-aged and Older Adults in the United States, 1999-2018
Abstract
Importance: Adults who belong to racial/ethnic minority groups are more likely than White adults to receive a diagnosis of chronic disease in the United States.
Objective: To evaluate which health indicators have improved or become worse among Black and Hispanic middle-aged and older adults since the Minority Health and Health Disparities Research and Education Act of 2000.
Design, setting, and participants: In this repeated cross-sectional study, a total of 4 856 326 records were extracted from the Behavioral Risk Factor Surveillance System from January 1999 through December 2018 of persons who self-identified as Black (non-Hispanic), Hispanic (non-White), or White and who were 45 years or older.
Exposure: The 1999 legislation to reduce racial/ethnic health disparities.
Main outcomes and measures: Poor health indicators and disparities including major chronic diseases, physical inactivity, uninsured status, and overall poor health.
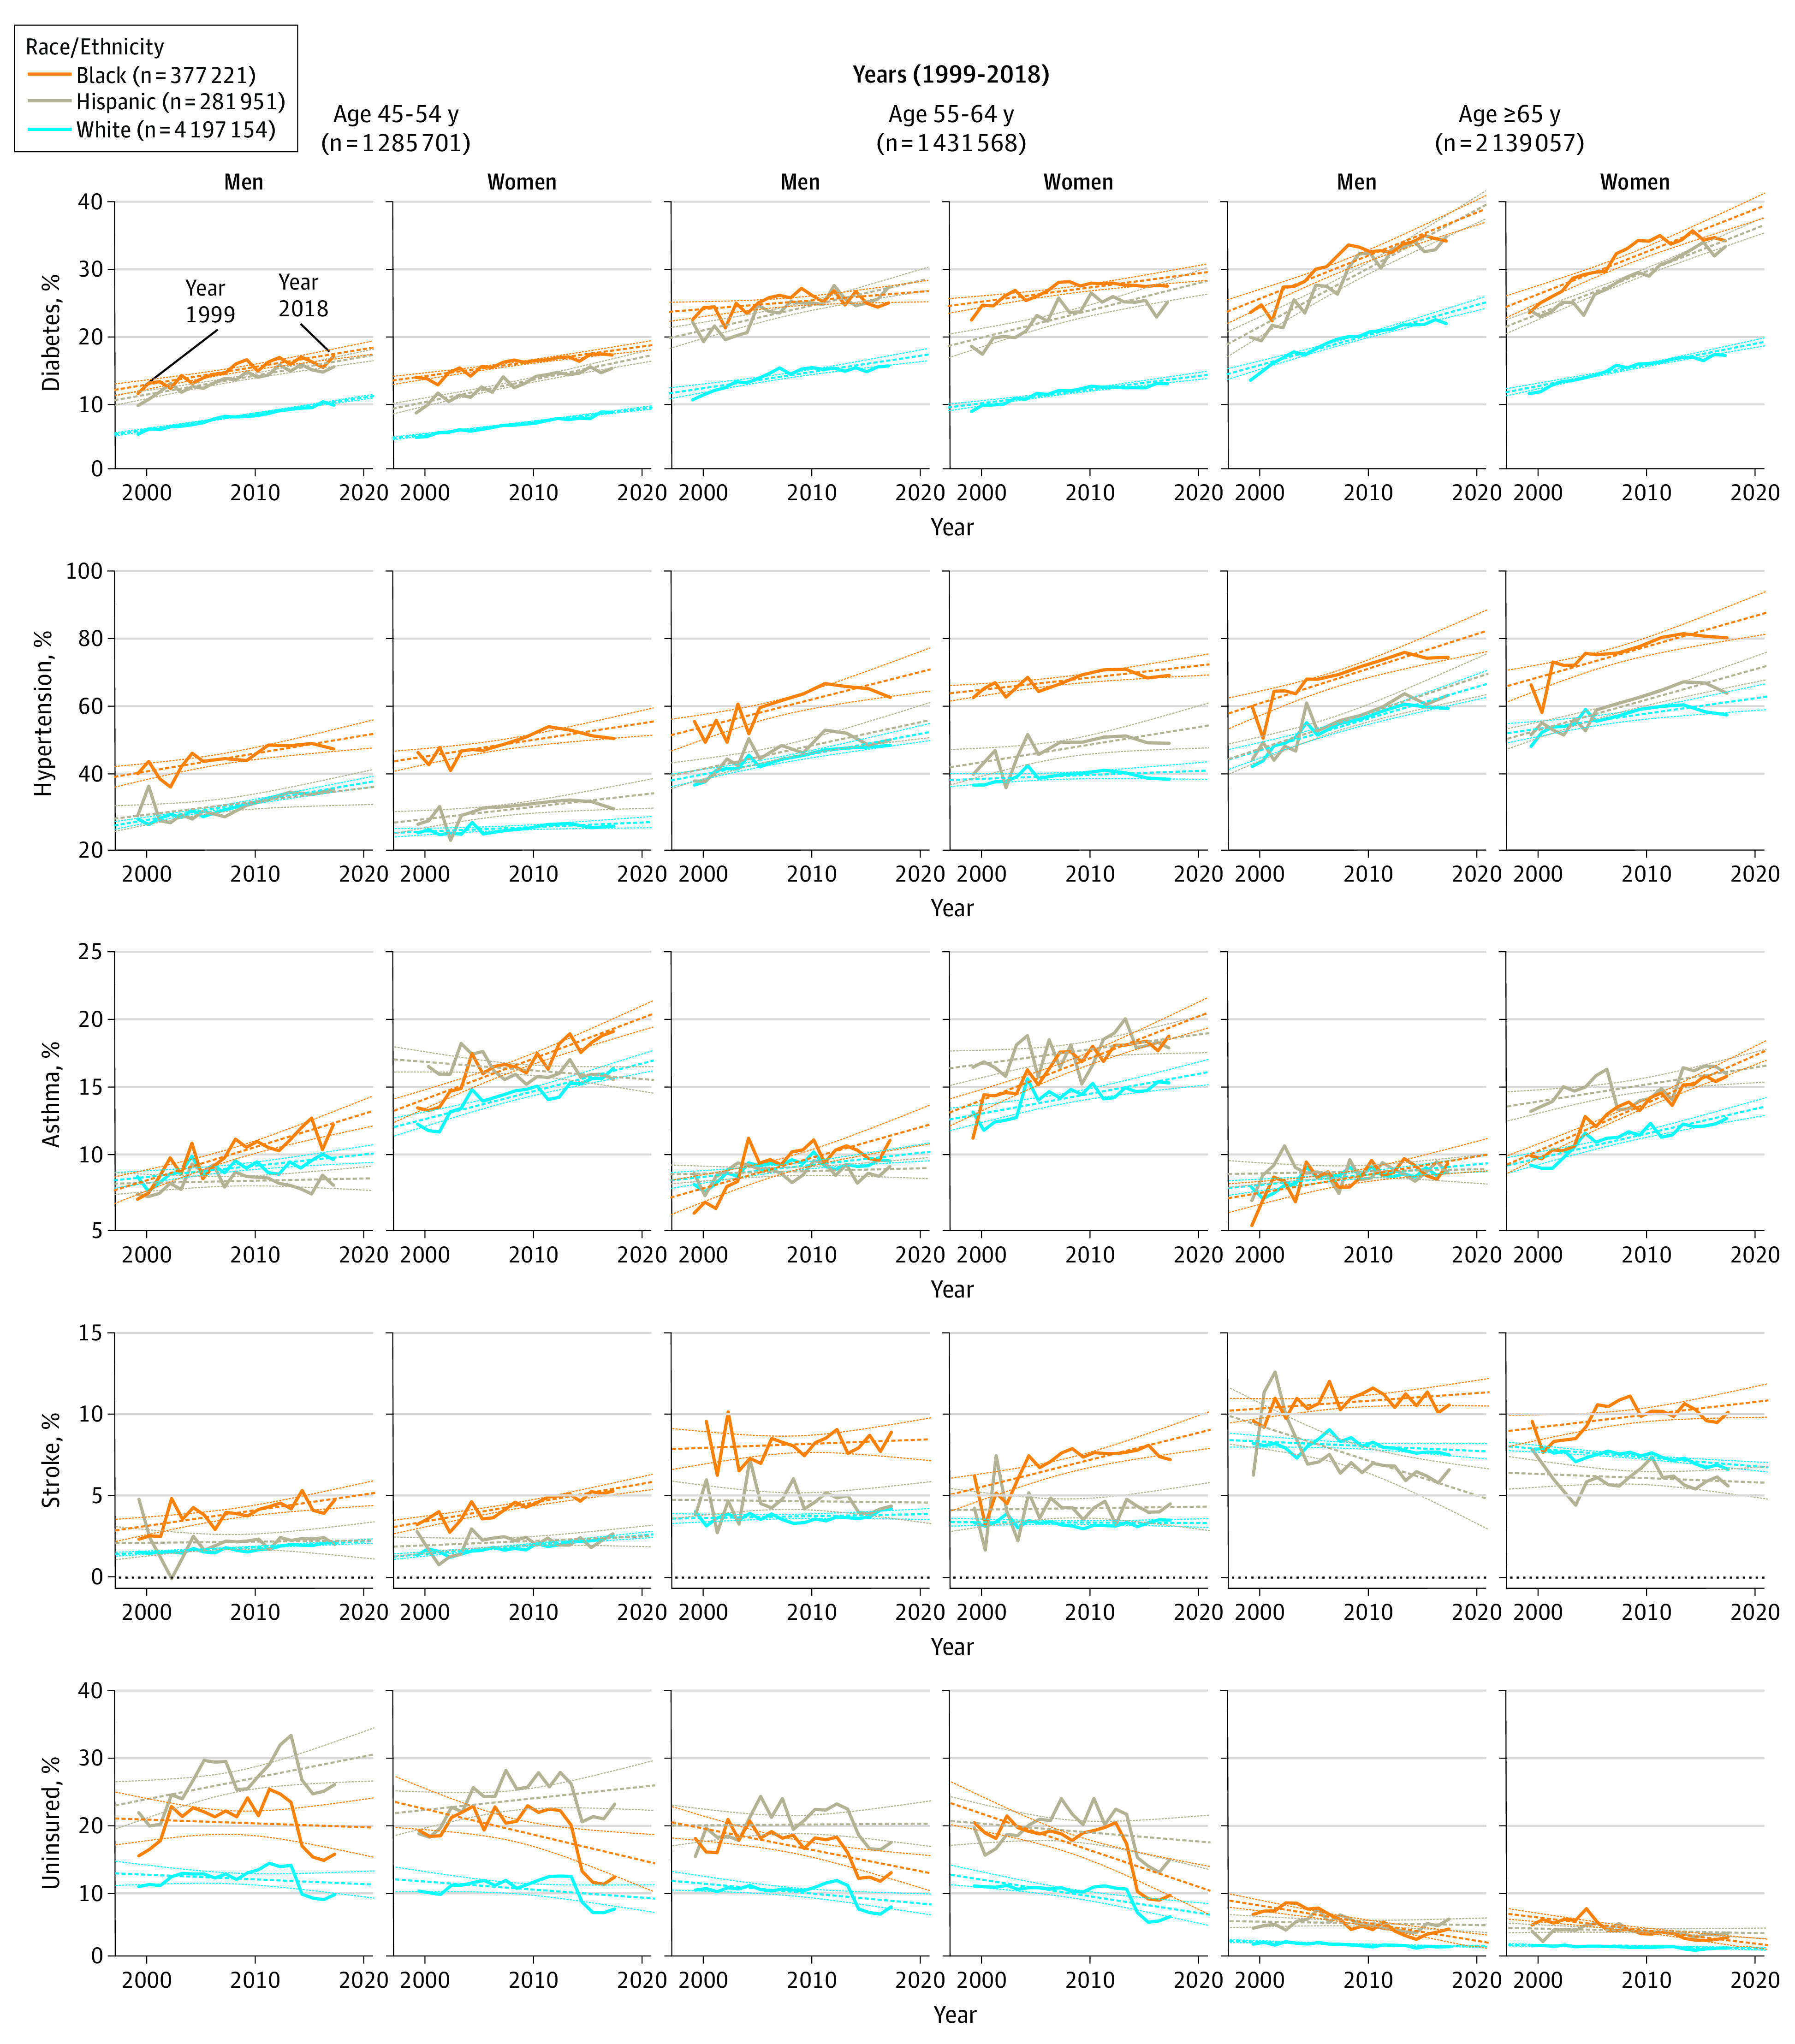
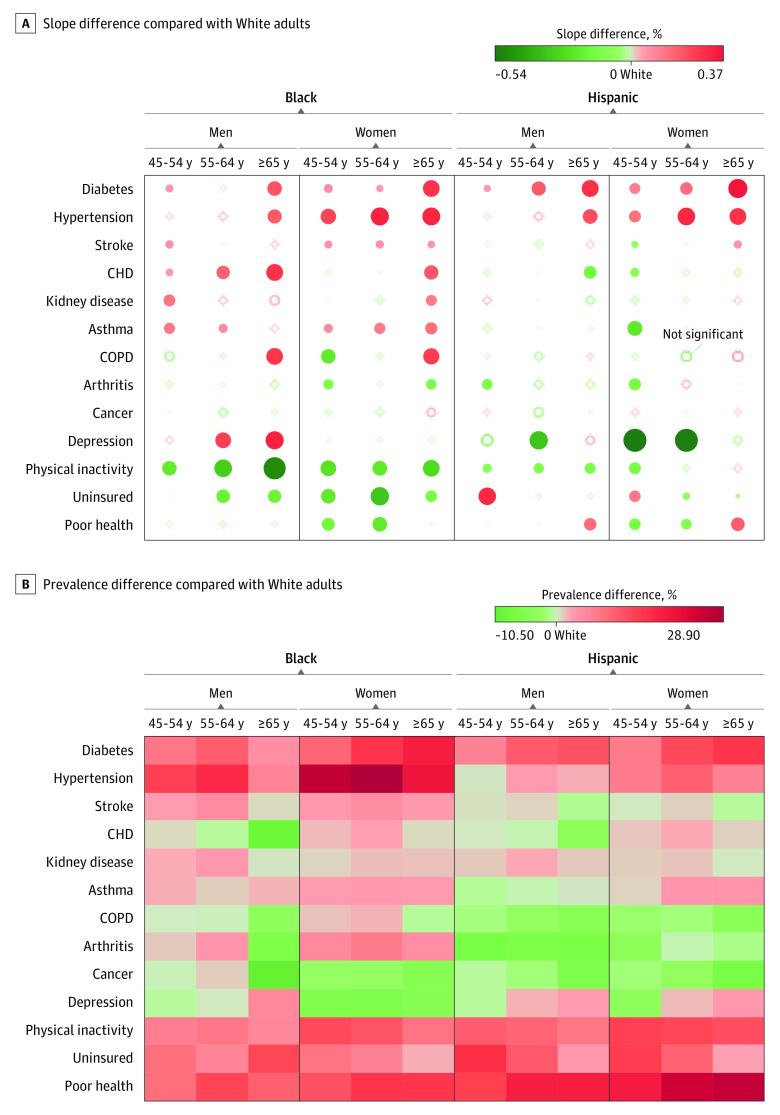
Results: Among the 4 856 326 participants (2 958 041 [60.9%] women; mean [SD] age, 60.4 [11.8] years), Black adults showed an overall decrease indicating improvement in uninsured status (β = -0.40%; P < .001) and physical inactivity (β = -0.29%; P < .001), while they showed an overall increase indicating deterioration in hypertension (β = 0.88%; P < .001), diabetes (β = 0.52%; P < .001), asthma (β = 0.25%; P < .001), and stroke (β = 0.15%; P < .001) during the last 20 years. The Black-White gap (ie, the change in β between groups) showed improvement (2 trend lines converging) in uninsured status (-0.20%; P < .001) and physical inactivity (-0.29%; P < .001), while the Black-White gap worsened (2 trend lines diverging) in diabetes (0.14%; P < .001), hypertension (0.15%; P < .001), coronary heart disease (0.07%; P < .001), stroke (0.07%; P < .001), and asthma (0.11%; P < .001). Hispanic adults showed improvement in physical inactivity (β = -0.28%; P = .02) and perceived poor health (β = -0.22%; P = .001), while they showed overall deterioration in hypertension (β = 0.79%; P < .001) and diabetes (β = 0.50%; P < .001). The Hispanic-White gap showed improvement in coronary heart disease (-0.15%; P < .001), stroke (-0.04%; P < .001), kidney disease (-0.06%; P < .001), asthma (-0.06%; P = .02), arthritis (-0.26%; P < .001), depression (-0.23%; P < .001), and physical inactivity (-0.10%; P = .001), while the Hispanic-White gap worsened in diabetes (0.15%; P < .001), hypertension (0.05%; P = .03), and uninsured status (0.09%; P < .001).
Conclusions and relevance: This study suggests that Black-White disparities increased in diabetes, hypertension, and asthma, while Hispanic-White disparities remained in diabetes, hypertension, and uninsured status.
Conflict of interest statement
Figures
References
Publication types
MeSH terms
Grants and funding
LinkOut - more resources
Full Text Sources
Medical
Miscellaneous
