. 2021 Jan 1;32(1):57-73.
doi: 10.1091/mbc.E20-06-0356. Epub 2020 Nov 11.

Insulin-promoted mobilization of GLUT4 from a perinuclear storage site requires RAB10

Affiliations

Insulin-promoted mobilization of GLUT4 from a perinuclear storage site requires RAB10

Alexandria Brumfield et al. Mol Biol Cell. .

Abstract

Insulin controls glucose uptake into muscle and fat cells by inducing a net redistribution of glucose transporter 4 (GLUT4) from intracellular storage to the plasma membrane (PM). The TBC1D4-RAB10 signaling module is required for insulin-stimulated GLUT4 translocation to the PM, although where it intersects GLUT4 traffic was unknown. Here we demonstrate that TBC1D4-RAB10 functions to control GLUT4 mobilization from a trans-Golgi network (TGN) storage compartment, establishing that insulin, in addition to regulating the PM proximal effects of GLUT4-containing vesicles docking to and fusion with the PM, also directly regulates the behavior of GLUT4 deeper within the cell. We also show that GLUT4 is retained in an element/domain of the TGN from which newly synthesized lysosomal proteins are targeted to the late endosomes and the ATP7A copper transporter is translocated to the PM by elevated copper. Insulin does not mobilize ATP7A nor does copper mobilize GLUT4, and RAB10 is not required for copper-elicited ATP7A mobilization. Consequently, GLUT4 intracellular sequestration and mobilization by insulin is achieved, in part, through utilizing a region of the TGN devoted to specialized cargo transport in general rather than being specific for GLUT4. Our results define the GLUT4-containing region of the TGN as a sorting and storage site from which different cargo are mobilized by distinct signals through unique molecular machinery.


Figures
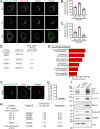
FIGURE 1:
FIGURE 1:
Proteomic analysis of GLUT4-containing perinuclear compartments. (A) Representative Airyscan confocal single plane images of cells expressing WT, F5Y-, or F5A-HA-GLUT4-GFP and labeled for STX6 and TGN46 by IF. (B) Quantification of percent overlap of WT, F5Y, and F5A GLUT4 with STX6. Individual cells ± SEM from N = 2 assays. Cells color coded by experiment. (C) Quantification of percent overlap of WT, F5Y, and F5A GLUT4 with TGN46. Individual cells ± SEM from N = 2 assays. Cells color coded by experiment. (D) Proteins identified in immunoabsorption experiments that are known to colocalize with GLUT4, rank based on summed signal intensity from four immunoabsorption experiments. (E) Panther Gene Ontology (GO) cellular component analysis for localization of proteins increased in F5Y-GLUT4 compartments immunoabsorption. (F) Representative Airyscan confocal single plane images of cells expressing F5Y-HA-GLUT4-GFP mutant and labeled for LAMP1 by IF. (G) Quantification of percent overlap of F5Y GLUT4 with LAMP1. Individual cells ± SEM from N = 2 assays. Cells color coded by experiment. (H) Fold increase of AP1 adaptin complex subunits, MPR, and copper transporter ATP7A in F5Y-GLUT4 compartments immunoabsorption. (I) Representative Western blots of immunoabsorbed WT HA-GLUT4-GFP compartments using anti-GFP beads. Elution contains proteins coimmunoabsorbed with GLUT4 compartments; flow-through contains proteins not coimmunoabsorbed. Bars, 5 µm.
FIGURE 2:
FIGURE 2:
Copper, but not insulin, stimulation results in mobilization of the copper transporter ATP7A from GLUT4-containing perinuclear compartments. (A) Representative Airyscan confocal single plane images of cells expressing HA-GLUT4-GFP and labeled for native copper transporter ATP7A and STX6 by IF. Cells treated with 200 µM BCS, followed by treatment with 200 µM copper or 1 nM insulin as described in Materials and Methods. Bars, 5 µm. (B) Quantification of percent overlap of ATP7A with GLUT4. Individual cells ± SEM from N = 6 assays. Cells color coded by experiment. (C) Quantification of percent overlap of ATP7A with STX6 under BCS, copper, insulin, and dual copper and insulin-stimulated conditions. Individual cells ± SEM from N = 3 assays. Cells color coded by experiment. *p < 0.0001 comparing BCS and CuCl2 conditions; p = 0.0023 comparing BCS and CuCl2+insulin conditions (one-way ANOVA followed by Tukey’s posttest). (D) Quantification of PM to total HA-GLUT4-GFP in cells under BCS, copper, insulin, and dual copper and insulin-stimulated conditions. N = 3 experiments ± SEM. AU, arbitrary units. *p < 0.0001 comparing BCS and insulin conditions; p < 0.0001 comparing BCS and CuCl2+insulin conditions (one-way ANOVA followed by Tukey’s posttest). (E) Quantification of percent overlap of ATP7A with STX6 under BCS and copper-stimulated conditions in cells electroporated with siRNA targeting RAB10. Individual cells ± SEM from N = 3 assays. Cells color coded by experiment. *p < 0.0001 comparing BCS and copper conditions (one-way ANOVA of conditions in C and E followed by Tukey’s posttest).
FIGURE 3:
FIGURE 3:
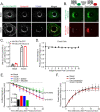
Insulin promotes mobilization of HA-GLUT4-mEos3.2 from the perinuclear region downstream of AKT. (A) Representative Airyscan confocal single plane images of basal and insulin-stimulated cells expressing HA-GLUT4-GFP and labeled for STX6 and TGN46 by IF. (B) Representative Airyscan confocal single plane images of cells expressing HA-GLUT4-mEos3.2. Green HA-GLUT4-mEos3.2 photoconverted to red HA-GLUT4-mEos3.2 in the perinuclear region (indicated by white, dashed circle) as described in Materials and Methods. *Nucleus. (C) Quantification of PM to total HA-GLUT4-GFP or HA-GLUT4-mEos3.2 as described in Materials and Methods. Serum-starved cells were stimulated with 10 nM insulin. Values were normalized to HA-GLUT4-mEos3.2 expressing, insulin condition. N = 3 assays ± SEM. (D) Quantification of average red HA-GLUT4-mEos3.2 intensity in the photoconverted perinuclear region of fixed cells for 10 successive images. Values were normalized to image 0. Mean normalized values ± SEM, N = 2 assays, 6–7 cells per assay. (E) Quantification of average red HA-GLUT4-mEos3.2 intensity in the photoconverted perinuclear region of live cells. Prior to photoconversion serum-starved cells were stimulated with 10 nM insulin, 1 µM AKT inhibitor MK2206, or equivalent volume of DMSO, where indicated, as described in Materials and Methods. Values were normalized to value at time 0. Mean normalized values ± SEM, N = 5–6 assays, 4–7 cells per assay. *p < 0.0001 comparing basal and insulin-stimulated slopes; p = 0.0002 comparing insulin + DMSO and insulin + MK2206-stimulated slopes. Inset depicts rate of transport, determined from slope. (F) Quantification of average green HA-GLUT4-mEos3.2 intensity in the photoconverted perinuclear region of live cells. Prior to photoconversion, serum-starved cells were stimulated with 10 nM insulin where indicated. Values were normalized to value at time 0. Mean normalized values ± SEM, N = 5–6 assays, 4–7 cells per assay. AU, arbitrary units. Bars, 5 µm.
FIGURE 4:
FIGURE 4:
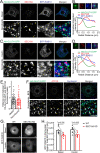
RAB10 colocalizes with HA-GLUT4-GFP and SEC16A at the perinuclear region. (A, B) Representative Airyscan confocal single plane images of (A) basal and (B) insulin-stimulated cells expressing BFP-RAB10 and HA-GLUT4-GFP and labeled for endogenous SEC16A by IF. Serum-starved cells were stimulated with 1 nM insulin. Inset (white, dashed boxed region) is displayed below. Linescan plot is BFP-RAB10, HA-GLUT4-GFP, and SEC16A fluorescence intensity along a line (indicated by white arrow). Values were normalized to each individual fluorescence maxima. Bars, 5 µm.
FIGURE 5:
FIGURE 5:
The organization of perinuclear RAB10 and SEC16A with GLUT4 has implications for their function in GLUT4 trafficking. (A, C) Representative Airyscan confocal single plane images of cells treated with 3 µM nocodazole. Cells expressing HA-GLUT4-GFP and BFP-RAB10 and stained for endogenous SEC16A by IF. Cells under (A) basal and (C) 1 nM insulin-stimulated conditions. Inset (white, dashed boxed region) is displayed below. Yellow arrows indicate the same position in each image. Bars, 5 µm. (B, D). Images of the average HA-GLUT4-GFP, SEC16A, and BFP-RAB10 fluorescence intensity from five individual fragments, centered of HA-GLUT4-GFP, resulting from nocodazole treatment from the cells in A and C, respectively. Radial linescan plot of images are displayed below. Values were normalized to each individual fluorescence maxima. Bars, 1 µm. (E) Quantification of the distance (µm) between HA-GLUT4-GFP and SEC16A fluorescence peaks in basal cells in the presence and absence of nocodazole treatment. Values are distances between peaks ± SEM. Distance measured for three separate sets of peaks per cell. N = 2 assays, 7–8 cells per assay. (F) Representative Airyscan confocal single plane images of cells treated with 3 µM nocodazole in the presence of 200 µM BCS. Cells expressing HA-GLUT4-GFP and stained for endogenous ATP7A and STX6 by IF. Inset (white, dashed boxed region) is displayed below. Yellow arrows indicate the same position in each image. Bars, 5 µm. (G) Representative images of basal and insulin-stimulated cells expressing BFP-RAB10, siRNA targeting SEC16A electroporated where indicated. Bars, 5 µm. (H) Quantification of the fraction of BFP-RAB10 in the perinuclear region of basal and 1 nM insulin-stimulated cells ± addition of siRNA targeting SEC16A. N = 7 assays ± SEM. Dashed line connects data from individual assays. *p < 0.05, two-tailed unpaired t test, nonnormalized raw data. AU, arbitrary units.
FIGURE 6:
FIGURE 6:
The TBC1D4-RAB10 module regulates insulin-stimulated mobilization of GLUT4 from the perinuclear region. (A) Quantification of average red HA-GLUT4-mEos3.2 intensity in the photoconverted perinuclear region of basal and 10 nm insulin-stimulated live cells stably expressing a control shRNA. Values were normalized to value at time 0. Mean normalized values ± SEM, N = 2 assays, 6–7 cells per assay. *p = 0.03 comparing basal and insulin-stimulated slopes. Inset depicts rate of transport, determined from slope. (B) Quantification of average red HA-GLUT4-mEos3.2 intensity in the photoconverted perinuclear region of basal live cells with stable knockdown of TBC1D4. Cells expressing exogenous TBC1D4 or TR where indicated. Values were normalized to value at time 0. Mean normalized values ± SEM, N = 3–7 assays, 5–7 cells per assay. *p = 0.01 comparing basal TBC1D4 KD and basal TBC1D4 KD + TBC1D4 slopes. Inset depicts rate of transport, determined from slope. (C) Quantification of average red HA-GLUT4-mEos3.2 intensity in the photoconverted perinuclear region of live cells with stable knockdown of RAB10 under basal and 10 nM insulin-stimulated conditions. Cells expressing exogenous BFP-RAB10 were indicated. Values were normalized to value at time 0. Mean normalized values ± SEM, N = 2–6 assays, 4–7 cells per assay. *p < 0.0001 comparing insulin-stimulated RAB10 KD and insulin-stimulated RAB10 KD + BFP-RAB10 slopes. Inset depicts rate of transport, determined from slope. (D) Quantitative RT-PCR of relative KIF13A or KIF13B mRNA expression in control 3T3-L1 adipocytes and those electroporated with KIF13A and/or KIF13B siRNAs. N = 6 assays. (E) Quantification of PM to total HA-GLUT4-GFP in serum-starved cells were stimulated with 1 nm insulin. Values were normalized to WT, insulin condition. N = 2–6 assays ± SEM. *p < 0.0001 compared with WT insulin-stimulated condition (two-way ANOVA followed by Tukey’s posttest). (F) Quantification of PM to total HA-GLUT4-GFP in serum-starved cells were stimulated with 1 nM insulin. siRNA targeting RAB10 electroporated where indicated, and 3 µM nocodazole (or an equivalent volume of DMSO) were added where indicated. Values were normalized to WT, insulin condition. N = 5 assays ± SEM. *p < 0.0001 compared with WT, insulin condition; p < 0.0001 compared with nocodazole, insulin condition; and p = 0.0003 compared with RAB10 KD, insulin condition (two-way ANOVA followed by Tukey’s posttest). AU, arbitrary units.
FIGURE 7:
FIGURE 7:
Model of GLUT4 trafficking in 3T3-L1 adipocytes. In 3T3-L1 adipocytes, the biogenesis of GLUT4-containing vesicles (IRVs), copper transporter ATP7A-containing vesicles, and vesicles containing lysosomal enzymes occurs at a regulated domain of the TGN; traffic of constitutive recycling proteins through the TGN occurs at an independent domain. Mobilization of ATP7A from the TGN is promoted by copper stimulation. The diversion of vesicles containing lysosomal enzymes away from traffic from the PM is mediated by the AP1 clathrin adaptor. The exocytosis of GLUT4 to the PM is accelerated by insulin. Insulin accelerates the recruitment, docking, and fusion of GLUT4-containing IRVs with the PM. Insulin also promotes the mobilization of GLUT4 from the perinuclear TGN, replenishing the IRV pool. This is important because GLUT4 in the PM is rapidly trafficked back to the TGN via the endosomal pathway. Mobilization of GLUT4 from the perinuclear region is regulated by TBC1D4, and insulin-stimulated acceleration of GLUT4 mobilization requires RAB10. Inset, SEC16A-labeled structures reside adjacent to GLUT4-containing membranes, and SEC16A organizes RAB10 at the perinuclear region.

References

    1. Ashburner M, Ball CA, Blake JA, Botstein D, Butler H, Cherry JM, Davis AP, Dolinski K, Dwight SS, Eppig JT, et al. (2000). Gene ontology: tool for the unification of biology. The Gene Ontology Consortium. Nat Genet 25, 25–29. - PMC - PubMed
    1. Babbey CM, Bacallao RL, Dunn KW (2010). Rab10 associates with primary cilia and the exocyst complex in renal epithelial cells. Am J Physiol Renal Physiol 299, F495–F506. - PMC - PubMed
    1. Bai L, Wang Y, Fan J, Chen Y, Ji W, Qu A, Xu P, James DE, Xu T (2007). Dissecting multiple steps of GLUT4 trafficking and identifying the sites of insulin action. Cell Metab 5, 47–57. - PubMed
    1. Blot V, McGraw TE (2006). GLUT4 is internalized by a cholesterol-dependent nystatin-sensitive mechanism inhibited by insulin. EMBO J 25, 5648–5658. - PMC - PubMed
    1. Blot V, McGraw TE (2008a). Molecular mechanisms controlling GLUT4 intracellular retention. Mol Biol Cell 19, 3477–3487. - PMC - PubMed

Publication types

MeSH terms