. 2020 Nov 11;15(11):e0241825.
doi: 10.1371/journal.pone.0241825. eCollection 2020.

Development and validation of a 30-day mortality index based on pre-existing medical administrative data from 13,323 COVID-19 patients: The Veterans Health Administration COVID-19 (VACO) Index

Affiliations

Development and validation of a 30-day mortality index based on pre-existing medical administrative data from 13,323 COVID-19 patients: The Veterans Health Administration COVID-19 (VACO) Index

Joseph T King Jr et al. PLoS One. .

Abstract

Background: Available COVID-19 mortality indices are limited to acute inpatient data. Using nationwide medical administrative data available prior to SARS-CoV-2 infection from the US Veterans Health Administration (VA), we developed the VA COVID-19 (VACO) 30-day mortality index and validated the index in two independent, prospective samples.

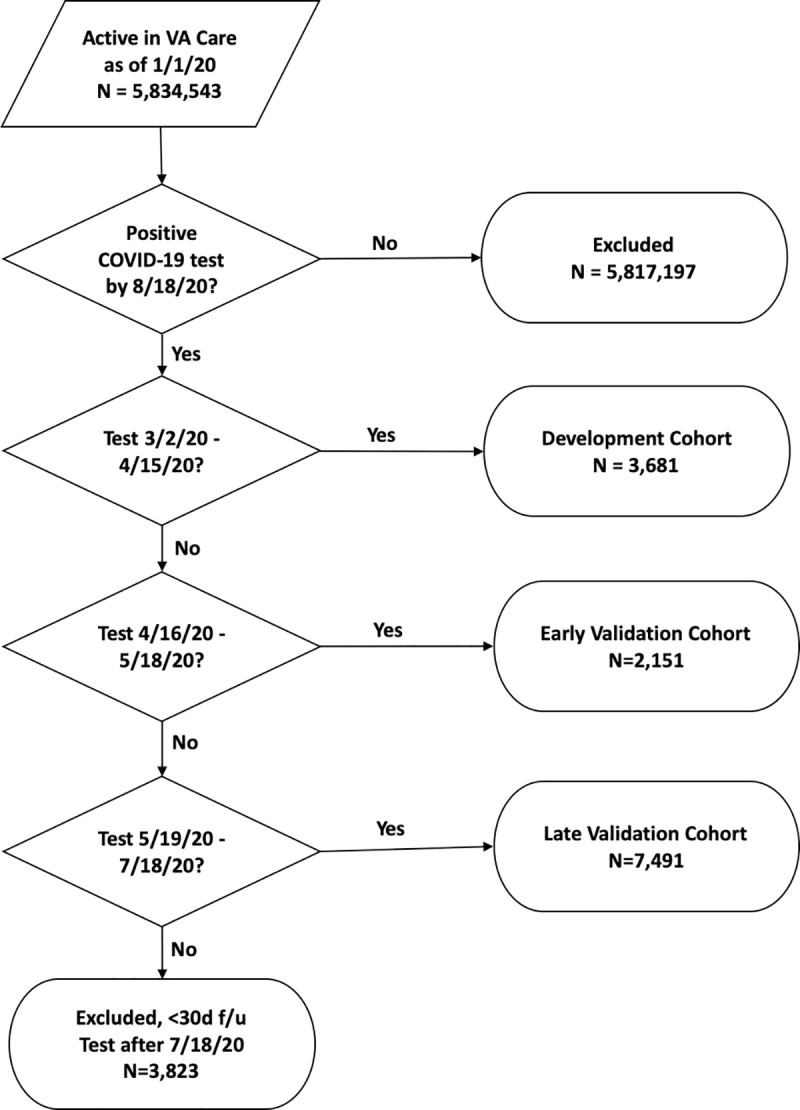
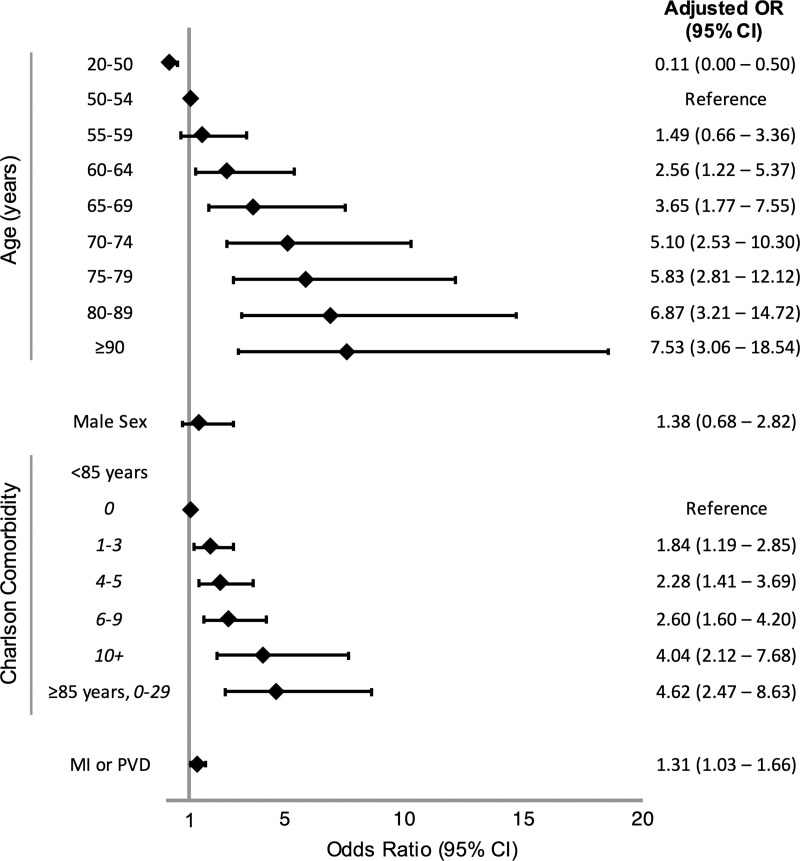
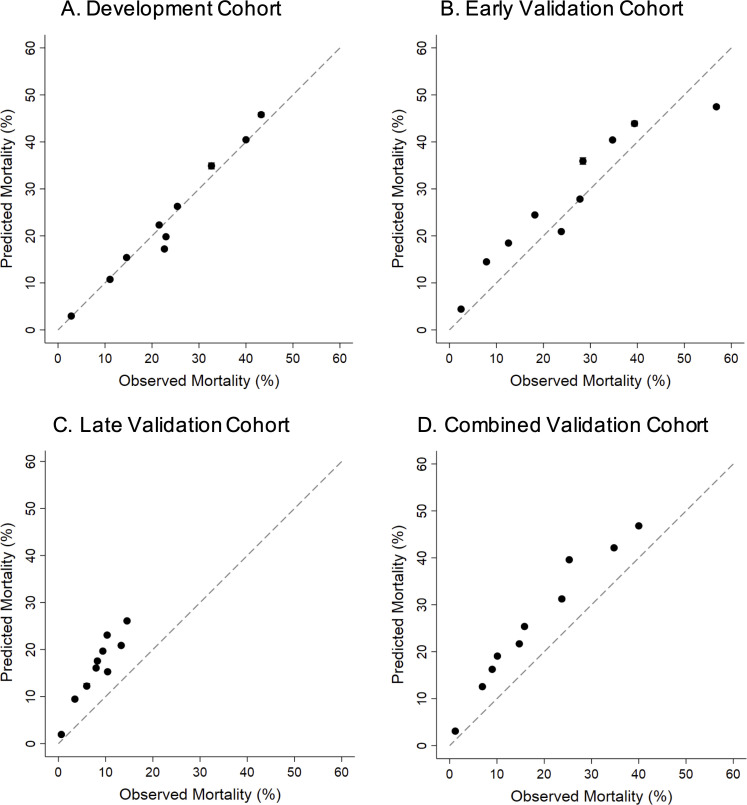
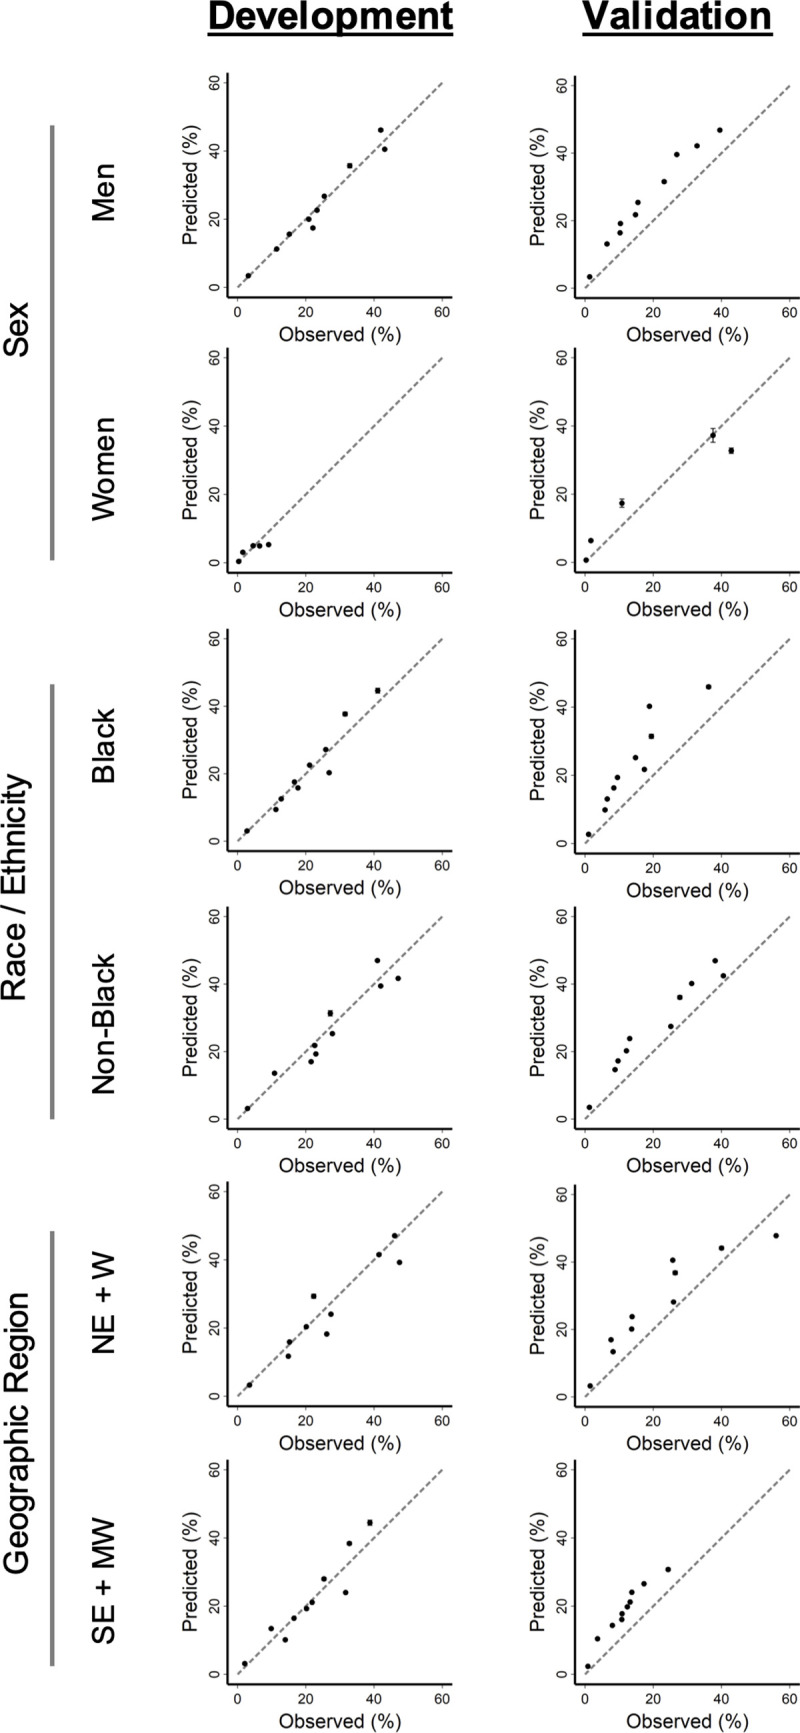
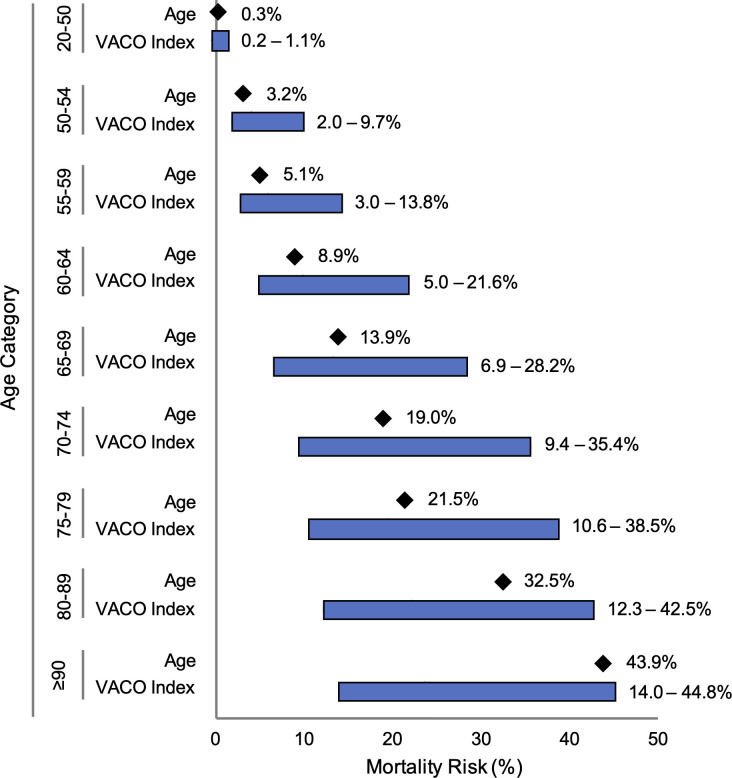
Methods and findings: We reviewed SARS-CoV-2 testing results within the VA between February 8 and August 18, 2020. The sample was split into a development cohort (test positive between March 2 and April 15, 2020), an early validation cohort (test positive between April 16 and May 18, 2020), and a late validation cohort (test positive between May 19 and July 19, 2020). Our logistic regression model in the development cohort considered demographics (age, sex, race/ethnicity), and pre-existing medical conditions and the Charlson Comorbidity Index (CCI) derived from ICD-10 diagnosis codes. Weights were fixed to create the VACO Index that was then validated by comparing area under receiver operating characteristic curves (AUC) in the early and late validation cohorts and among important validation cohort subgroups defined by sex, race/ethnicity, and geographic region. We also evaluated calibration curves and the range of predictions generated within age categories. 13,323 individuals tested positive for SARS-CoV-2 (median age: 63 years; 91% male; 42% non-Hispanic Black). We observed 480/3,681 (13%) deaths in development, 253/2,151 (12%) deaths in the early validation cohort, and 403/7,491 (5%) deaths in the late validation cohort. Age, multimorbidity described with CCI, and a history of myocardial infarction or peripheral vascular disease were independently associated with mortality-no other individual comorbid diagnosis provided additional information. The VACO Index discriminated mortality in development (AUC = 0.79, 95% CI: 0.77-0.81), and in early (AUC = 0.81 95% CI: 0.78-0.83) and late (AUC = 0.84, 95% CI: 0.78-0.86) validation. The VACO Index allows personalized estimates of 30-day mortality after COVID-19 infection. For example, among those aged 60-64 years, overall mortality was estimated at 9% (95% CI: 6-11%). The Index further discriminated risk in this age stratum from 4% (95% CI: 3-7%) to 21% (95% CI: 12-31%), depending on sex and comorbid disease.

Conclusion: Prior to infection, demographics and comorbid conditions can discriminate COVID-19 mortality risk overall and within age strata. The VACO Index reproducibly identified individuals at substantial risk of COVID-19 mortality who might consider continuing social distancing, despite relaxed state and local guidelines.


Conflict of interest statement

The authors have declared that no competing interests exist.

Figures

Fig 1
Fig 1. Flow diagram of VACO Index cohort selection.
Flow diagram showing selection of VACO Index cohorts from 5,834,543 patients active in VA care as of January 1, 2020. All COVID-19 tests were performed in the VA. Patients with COVID-19 tests after July 18, 2020 did not have 30 days of follow-up and were excluded from the analysis.
Fig 2
Fig 2. Forest plot of VACO Index 30-day mortality multivariable model.
Forest plot of odds ratios (OR) and 95% confidence intervals (CI) of VACO Index variables from multivariable logistic regression model derived from development cohort (n = 3,681). Abbreviations: MI or PVD = history of myocardial infarction or peripheral vascular disease.
Fig 3
Fig 3. Calibration plots of VACO Index: Development, early validation, late validation, and combined validation cohorts.
Calibration plots of VACO Index predicted 30-day mortality risk versus observed patient mortality across the cohorts. Error bars show 95% confidence intervals and dashed lines indicate perfect agreement between predicted versus observed patient mortality. a. Development cohort: test positive between March 2 and April 15, 2020, n = 3,681, 480 deaths. b. Early validation cohort: test positive between April 16 and May 18, 2020, n = 2,151, 253 deaths. c. Late validation cohort: test positive between May 19 and July 18, 2020, n = 7,491, 403 deaths. d. Combined early and late validation cohorts: test positive between April 16 and July 18, 2020, n = 9,642, 656 deaths.
Fig 4
Fig 4. Calibration plots of VACO Index: Combined cohort subgroups.
Calibration plots of VACO Index 30-day predicted mortality risk versus observed patient mortality. Error bars show 95% confidence intervals and dashed lines indicate perfect agreement between predicted versus observed patient mortality. Development cohort: test positive between March 2 and April 15, 2020, n = 3,681, 480 deaths. Combined early and late validation cohorts: test positive between April 16 and July 18, 2020, n = 9,642, 656 deaths. Subgroups: Men vs women; Black vs non-Black race; Northeast (NE) + West (W) regions vs Southeast (SE) + Midwest (MW) regions.
Fig 5
Fig 5. Range of 30-day mortality predictions from age alone and VACO Index.
Bar graphs demonstrating the additional variation in mortality prediction provided by the VACO Index over age alone across age categories in the combined validation cohort (n = 9,642). The diamonds indicate predicted 30-day mortality within each age category when only age is used to generate the predicted value. The bars show the range of predicted 30-day mortality within the same age category provided by the VACO Index, where age is supplemented with sex and comorbidities.

References

    1. Wilder-Smith A, Freedman DO. Isolation, quarantine, social distancing and community containment: pivotal role for old-style public health measures in the novel coronavirus (2019-nCoV) outbreak. J Travel Med. 2020;27(2). 10.1093/jtm/taaa020 - DOI - PMC - PubMed
    1. Henry BM, de Oliveira MHS, Benoit S, Plebani M, Lippi G. Hematologic, biochemical and immune biomarker abnormalities associated with severe illness and mortality in coronavirus disease 2019 (COVID-19): a meta-analysis. Clin Chem Lab Med. 2020. 10.1515/cclm-2020-0369 - DOI - PubMed
    1. Liang W, Liang H, Ou L, Chen B, Chen A, Li C, et al. Development and validation of a clinical risk score to predict the occurrence of critical Illness in hospitalized patients With COVID-19. JAMA Intern Med. 2020. 10.1001/jamainternmed.2020.2033 - DOI - PMC - PubMed
    1. Wynants L, Van Calster B, Bonten MMJ, Collins GS, Debray TPA, De Vos M, et al. Prediction models for diagnosis and prognosis of covid-19 infection: systematic review and critical appraisal. BMJ. 2020;369:m1328 10.1136/bmj.m1328 - DOI - PMC - PubMed
    1. Yan L, Zhang H-T, Goncalves J, Xiao Y, Wang M, Guo Y, et al. An interpretable mortality prediction model for COVID-19 patients. Nature Machine Intelligence. 2020;2:283–8.

Publication types

MeSH terms