Meta-Analysis
. 2020 Nov 11;15(11):e0241497.
doi: 10.1371/journal.pone.0241497. eCollection 2020.

On the treatment effect heterogeneity of antidepressants in major depression: A Bayesian meta-analysis and simulation study

Affiliations
Meta-Analysis

On the treatment effect heterogeneity of antidepressants in major depression: A Bayesian meta-analysis and simulation study

Constantin Volkmann et al. PLoS One. .

Abstract

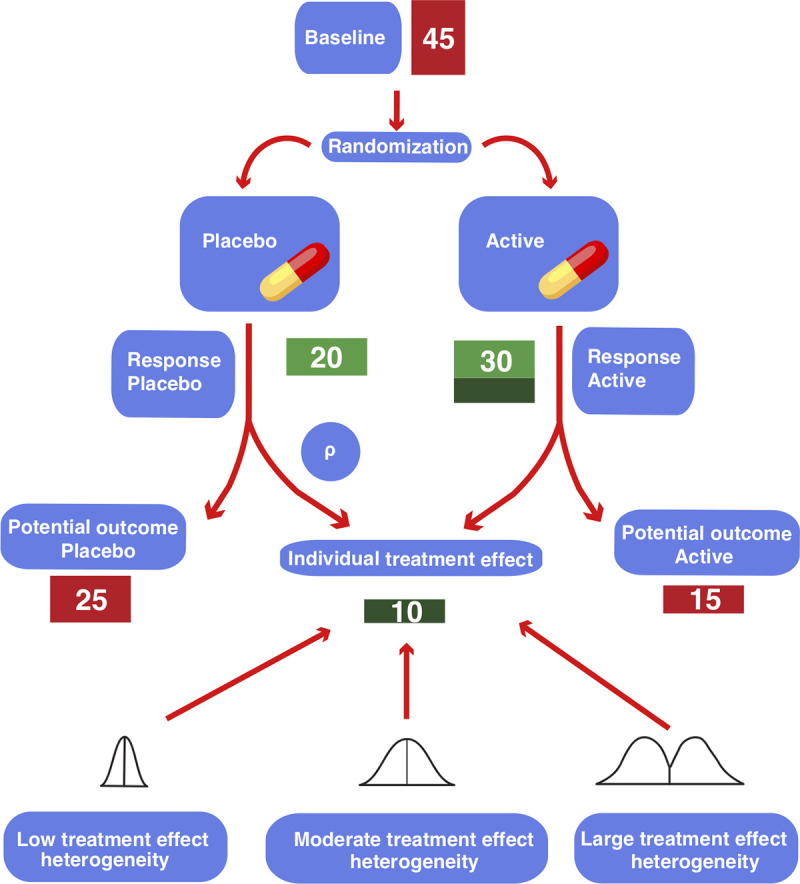
Background: The average treatment effect of antidepressants in major depression was found to be about 2 points on the 17-item Hamilton Depression Rating Scale, which lies below clinical relevance. Here, we searched for evidence of a relevant treatment effect heterogeneity that could justify the usage of antidepressants despite their low average treatment effect.

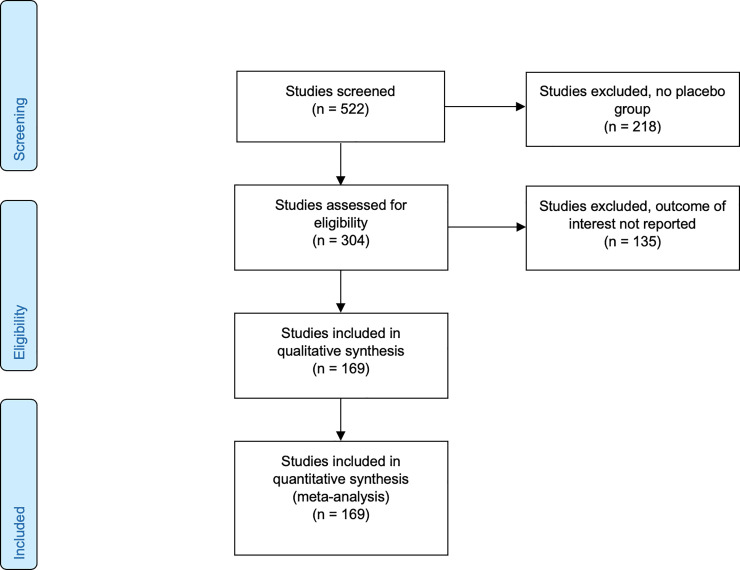
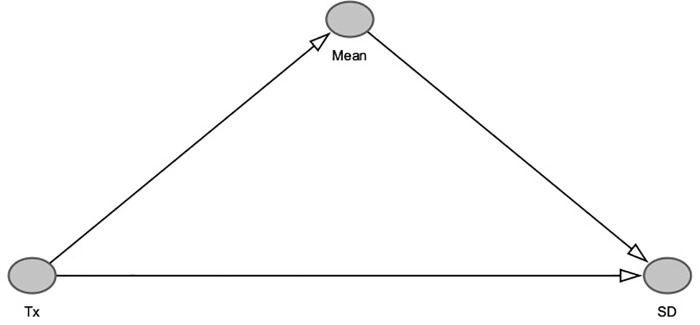
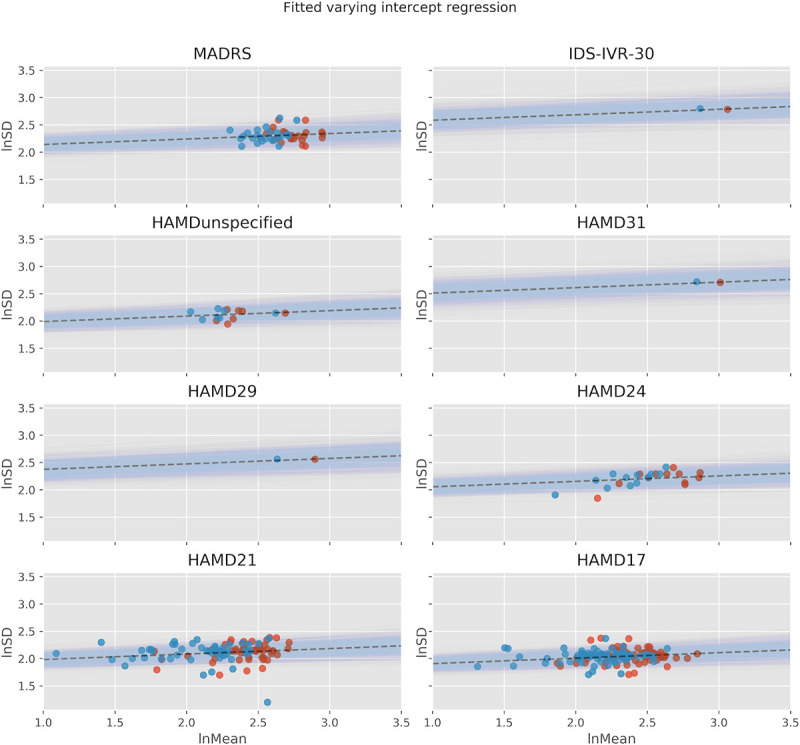
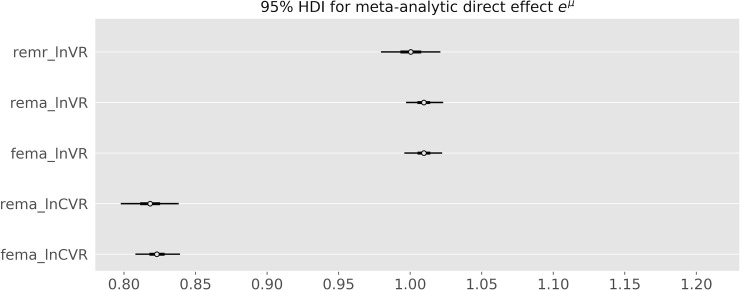
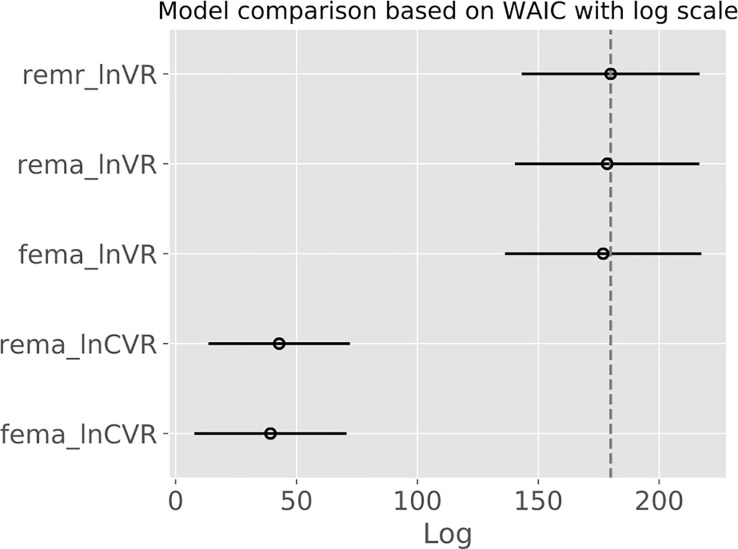
Methods: Bayesian meta-analysis of 169 randomized, controlled trials including 58,687 patients. We considered the effect sizes log variability ratio (lnVR) and log coefficient of variation ratio (lnCVR) to analyze the difference in variability of active and placebo response. We used Bayesian random-effects meta-analyses (REMA) for lnVR and lnCVR and fitted a random-effects meta-regression (REMR) model to estimate the treatment effect variability between antidepressants and placebo.

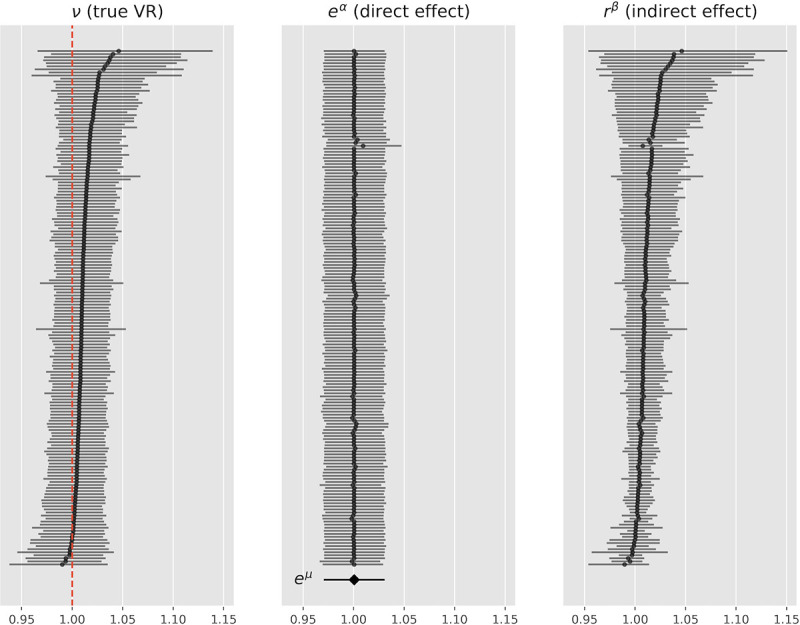
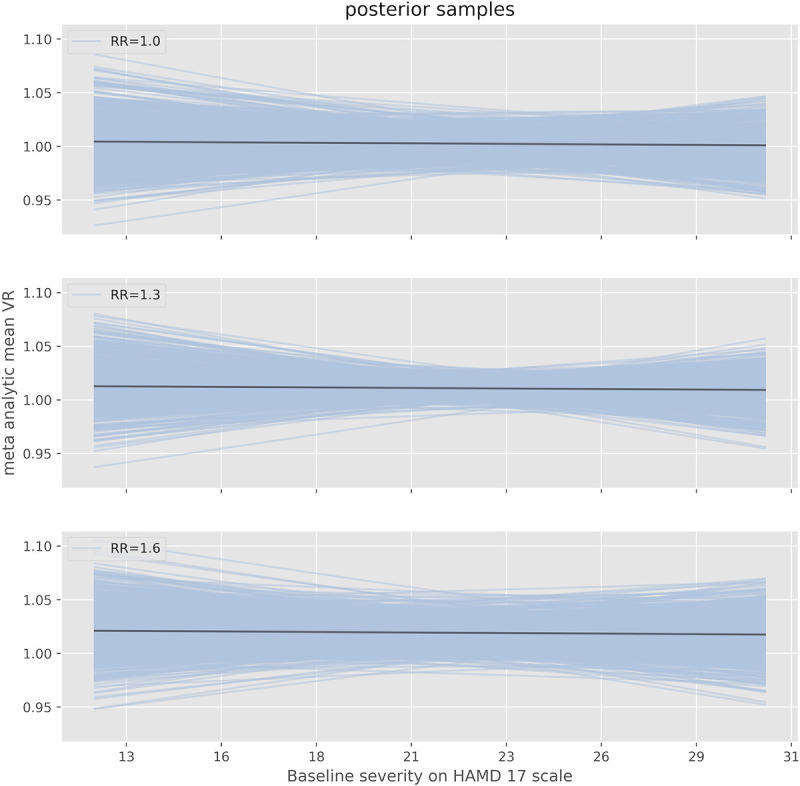
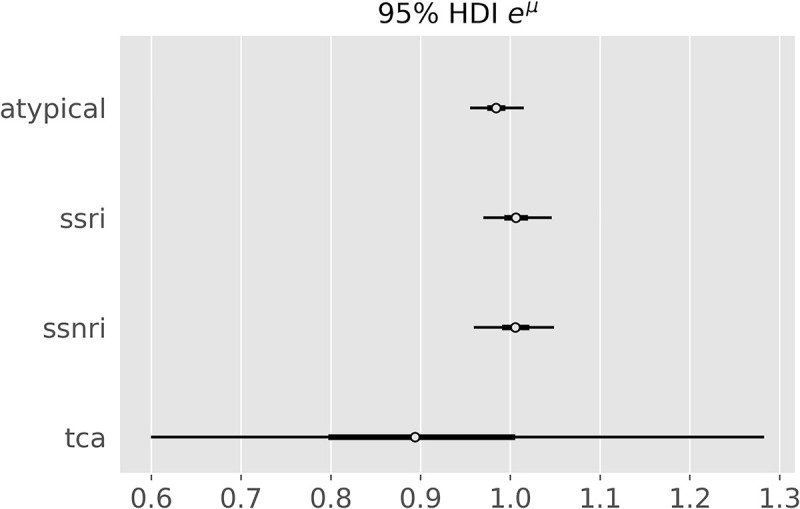
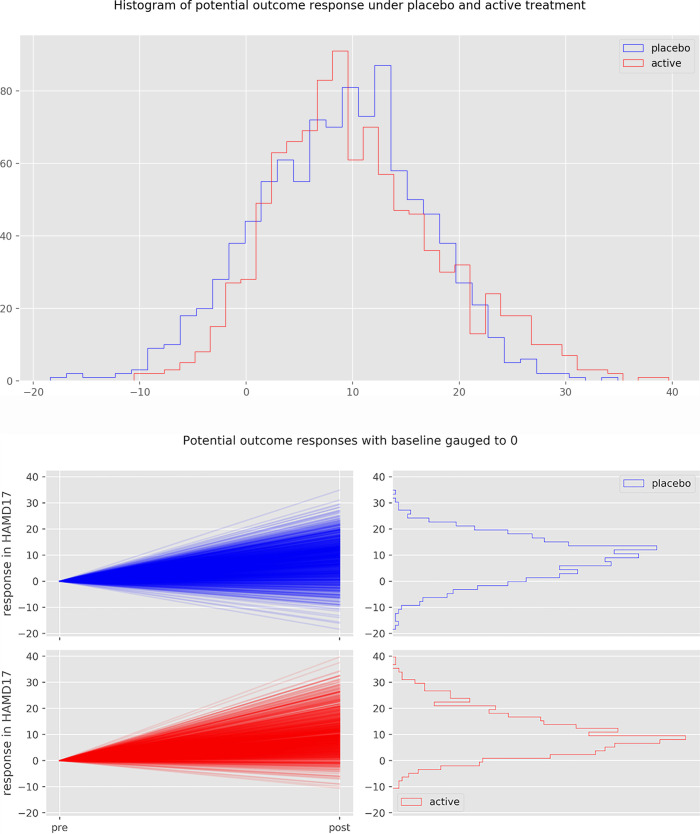
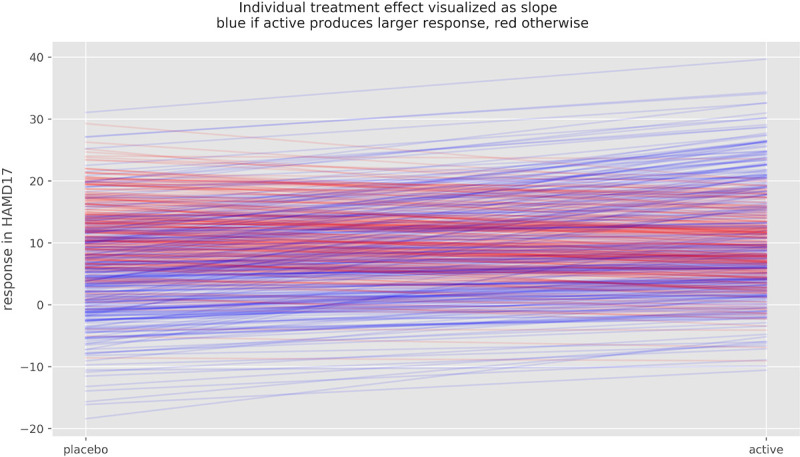
Results: The variability ratio was found to be very close to 1 in the best fitting models (REMR: 95% highest density interval (HDI) [0.98, 1.02], REMA: 95% HDI [1.00, 1.02]). The between-study standard deviation τ under the REMA with respect to lnVR was found to be low (95% HDI [0.00, 0.02]). Simulations showed that a large treatment effect heterogeneity is only compatible with the data if a strong correlation between placebo response and individual treatment effect is assumed.

Conclusions: The published data from RCTs on antidepressants for the treatment of major depression is compatible with a near-constant treatment effect. Although it is impossible to rule out a substantial treatment effect heterogeneity, its existence seems rather unlikely. Since the average treatment effect of antidepressants falls short of clinical relevance, the current prescribing practice should be re-evaluated.


Conflict of interest statement

CAM received consulting fees from Silence Therapeutics, outside the submitted work. The other authors declared no competing interest. This does not alter our adherence to PLOS ONE policies on sharing data and materials.

Figures

Fig 1
Fig 1. Visualization of potential outcomes and treatment effect for a patient in an antidepressant trial.
The patient is randomized to either the placebo or the active arm, corresponding to two hypothetical “potential outcomes” (Red scores). Only one outcome can be observed, as a patient cannot receive both interventions simultaneously. The difference between the two outcomes is the “individual treatment effect” of the intervention (Dark green score). The individual treatment effect is unobservable and can be imaged to be drawn from hypothetical distributions of the treatment effect. The variance of this distribution corresponds to the treatment effect heterogeneity. The factor ρ is the correlation between the placebo response and the individual treatment effect. All numbers signify depression severity on the HAMD-17 scale.
Fig 2
Fig 2. PRISMA 2009 flow diagram.
Fig 3
Fig 3. Causal graph depicting relationship between treatment, mean and SD.
The treatment Tx has a causal effect of around 2 Hamilton points on the mean of the study population. If we control for the mean ~ SD relationship when estimating the variability between treatment and control, we only measure the direct effect of treatment on variability, while no such control (as with the VR effect size) measures the total effect of the treatment on outcome variability.
Fig 4
Fig 4. Linear association between lnMean and lnSD.
Linear association between lnMean and lnSD using a varying intercept model, where the intercepts were allowed to vary between studies with different depression scales. Red dots represent active groups, blue dots represent placebo groups.
Fig 5
Fig 5. Posterior credible intervals for total effect, direct effect and indirect effect as determined by the REMR.
eα represents the study-specific direct effect, RRβ the study-specific indirect effect, eμ is the meta-analytic mean of the direct effect.
Fig 6
Fig 6. Posterior credible intervals for the eμ parameter for the different models.
REMA: random-effects meta-analysis. FEMA: fixed-effects meta-analysis. REMR: random-effects meta-regression. The lnCVR underestimates the variability in the active group, while the results are very similar for the REMR and the lnVR meta-analysis.
Fig 7
Fig 7. Widely applicable information criterion (WAIC) depicted on a logarithmic scale.
Higher values signify a better predictive fit of the underlying model. Bars indicate standard errors. REMA: random-effects meta-analysis. FEMA: fixed-effects meta-analysis. REMR: random-effects meta-regression.
Fig 8
Fig 8. Influence of baseline severity on outcome variability.
Estimated VR of antidepressants versus placebo as a function of baseline severity on the HAMD17-scale as determined by the REMR. Depicted are the mean estimates and 95% HDIs for three different values of the response ratio (mean response active versus mean response placebo). The meta-analytic mean of RR is around 1.22 in the Cipriani data set.
Fig 9
Fig 9. VR for different antidepressant classes.
Posterior credible intervals for the eμ parameter for different antidepressant classes as determined by the random-effect meta-regression.
Fig 10
Fig 10. Change score of 1000 simulated patients.
Boxplot (a) of change score under placebo (blue) and under active treatment (red) for ρ = - 0.4, SDte = 6.35 HAMD-17 points and VR = 1.02. (b) depicts pre-post change for each individual patient, gauged to 0. Note, that in this particular simulation, the SDte is not exactly equal to 6.5, as all simulations contain random processes.
Fig 11
Fig 11. Potential outcomes and individual treatment effect of 100 simulated patients.
Potential outcome under placebo and under active treatment of 100 simulated patients, ρ = - 0.4, SDTE = 6.35 and VR = 1.2. Slopes represent individual treatment effect, which varies substantially in this simulation. Blue lines indicated improvement under active treatment, red lines deterioration.

References

    1. WHO. Depression and Other Common Mental Disorders: Global Health Estimates. https://apps.who.int/iris/bitstream/handle/10665/254610/WHO-MSD-MER-2017....
    1. DGPPN. S3-Leitlinie und Nationale VersorgungsLeitlinie (NVL) Unipolare Depression, 2. Auflage. 2015. https://www.leitlinien.de/mdb/downloads/nvl/depression/depression-2aufl-....
    1. NICE. Depression in adults: recognition and management. 2009. https://www.nice.org.uk/guidance/cg90/chapter/1-Guidance#treatment-choic.... - PubMed
    1. Cipriani A, Furukawa TA, Salanti G, Chaimani A, Atkinson LZ, Ogawa Y, et al. Comparative efficacy and acceptability of 21 antidepressant drugs for the acute treatment of adults with major depressive disorder: a systematic review and network meta-analysis. Lancet [Internet]. 2018. April 7;391(10128):1357–66. Available from: 10.1016/S0140-6736(17)32802-7 - DOI - PMC - PubMed
    1. Hamilton M. Development of a rating scale for primary depressive illness. Br J Soc Clin Psychol. 1967. December;6(4):278–96. 10.1111/j.2044-8260.1967.tb00530.x - DOI - PubMed

Publication types

Substances