. 2020 Nov 10;33(6):108378.
doi: 10.1016/j.celrep.2020.108378.

A Systematic Protein Turnover Map for Decoding Protein Degradation

Affiliations

A Systematic Protein Turnover Map for Decoding Protein Degradation

Romain Christiano et al. Cell Rep. .

Abstract

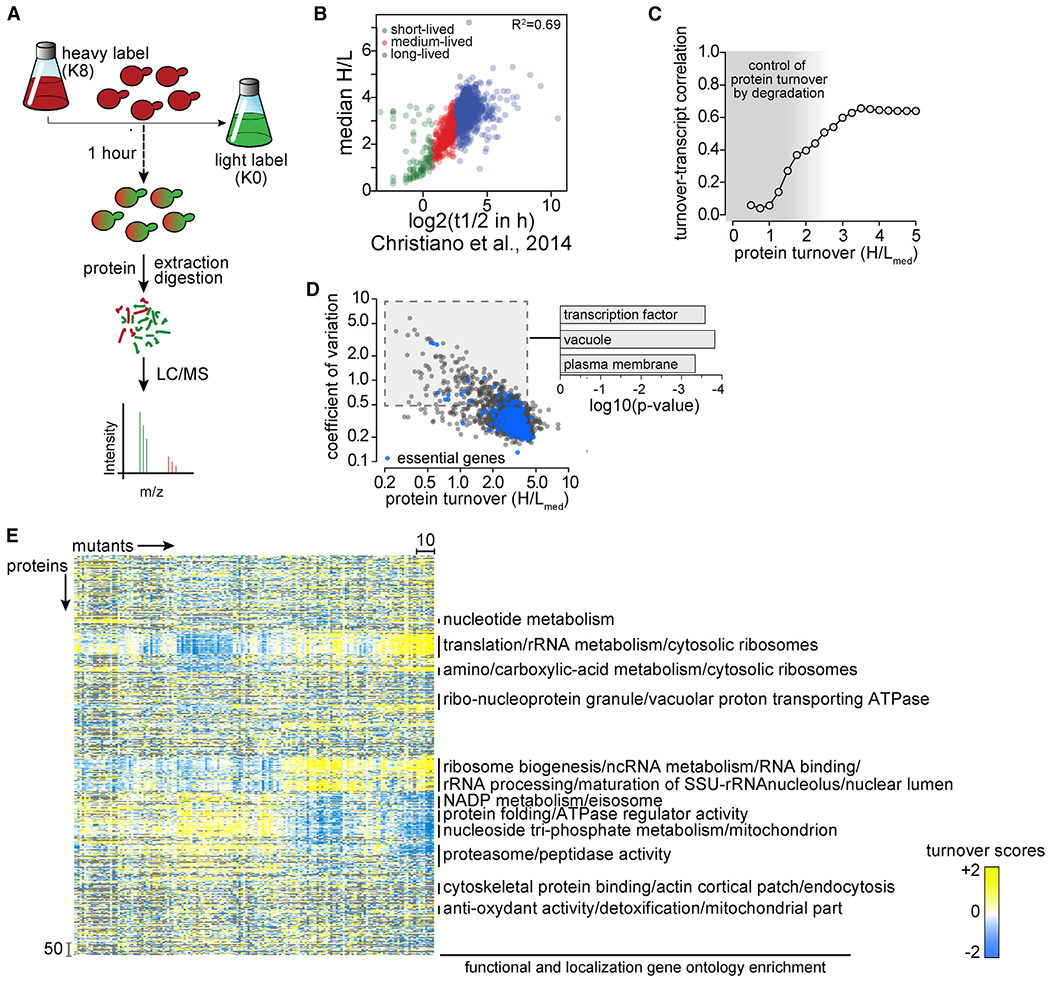
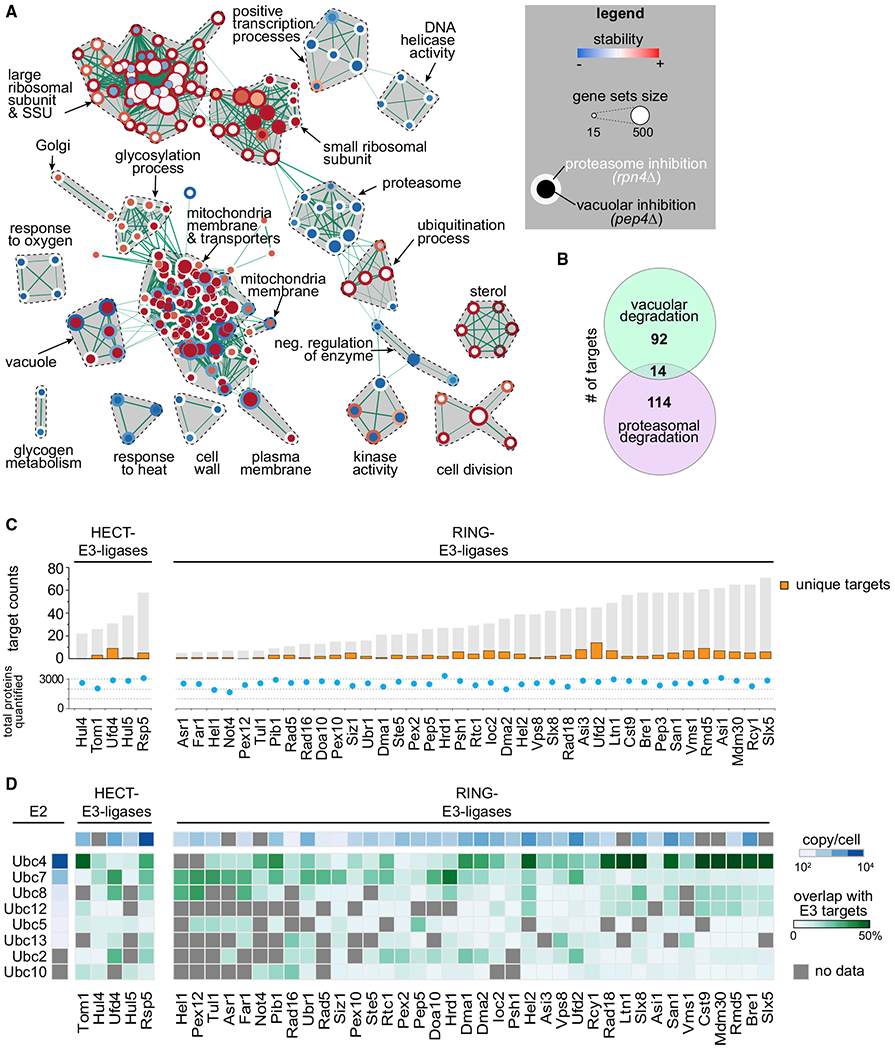
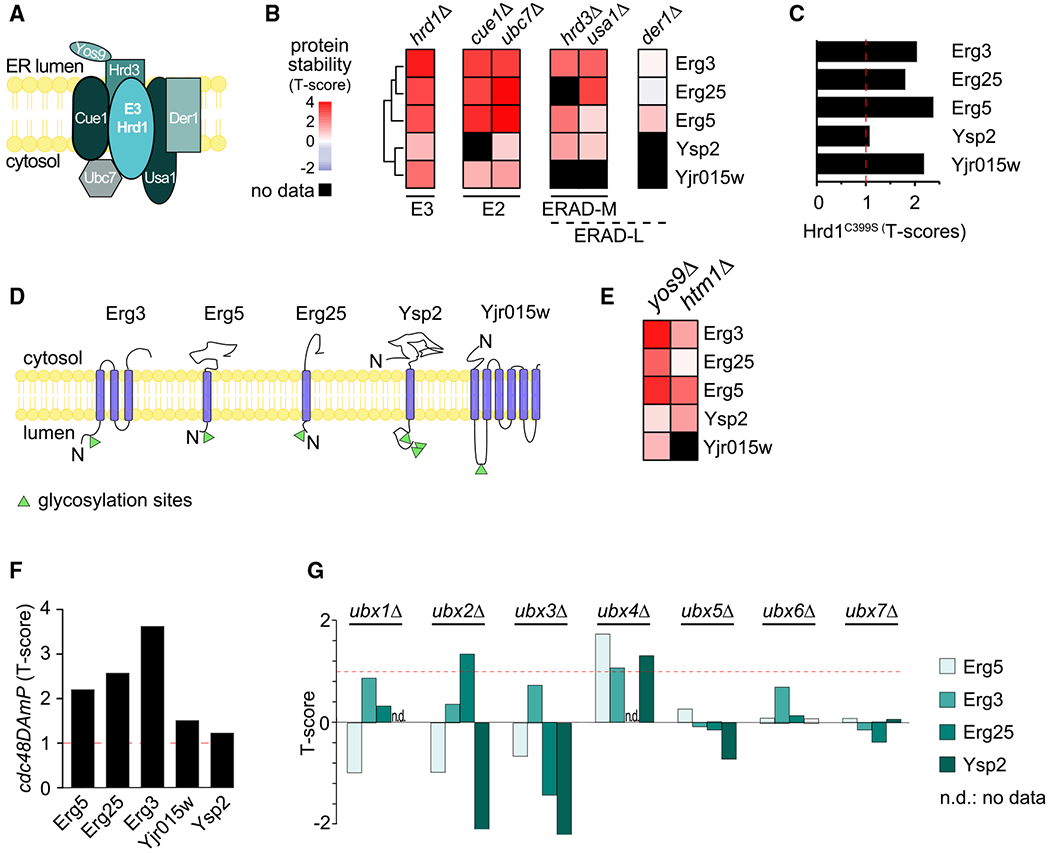
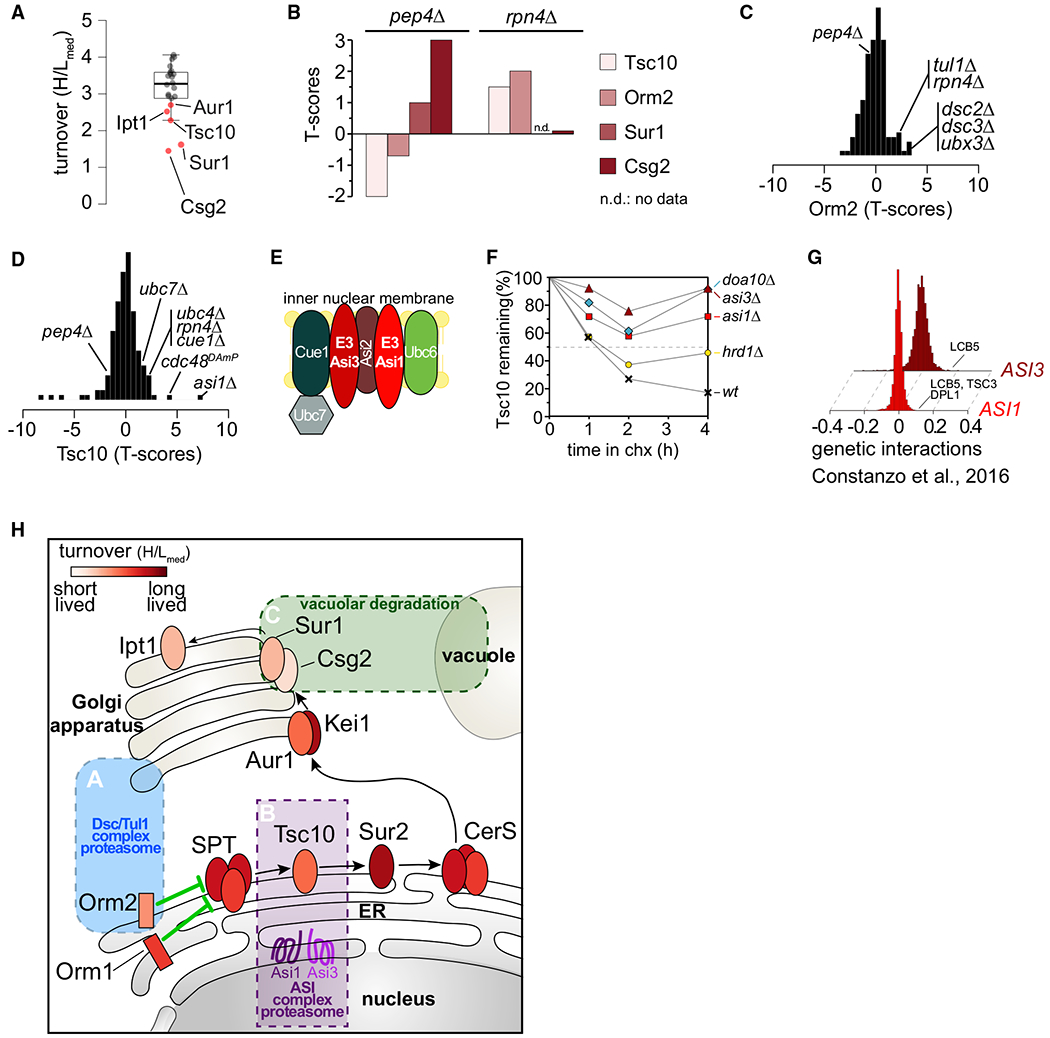
Protein degradation is mediated by an expansive and complex network of protein modification and degradation enzymes. Matching degradation enzymes with their targets and determining globally which proteins are degraded by the proteasome or lysosome/vacuole have been a major challenge. Furthermore, an integrated view of protein degradation for cellular pathways has been lacking. Here, we present an analytical platform that combines systematic gene deletions with quantitative measures of protein turnover to deconvolve protein degradation pathways for Saccharomyces cerevisiae. The resulting turnover map (T-MAP) reveals target candidates of nearly all E2 and E3 ubiquitin ligases and identifies the primary degradation routes for most proteins. We further mined this T-MAP to identify new substrates of ER-associated degradation (ERAD) involved in sterol biosynthesis and to uncover regulatory nodes for sphingolipid biosynthesis. The T-MAP approach should be broadly applicable to the study of other cellular processes, including mammalian systems.

Keywords: E2; E3 ligases; ERAD; SILAC; mass spectrometry; proteasome; protein turnover; proteomics; ubiquitin.


Conflict of interest statement

Declaration of Interests The authors declare no competing interests.

Figures

Figure 1.
Figure 1.. Overview of the Turnover Profiling Map (T-MAP) of Proteostasis Genes
(A) Overview of single time point strategy for turnover profiling. Yeast cells were labeled for 3 days with heavy isotope lysine (K8). At t = 0, cells were washed with medium containing light isotope lysine (K0). After 1 h of chase, cells were harvested, and digested proteins analyzed by liquid chromatography-mass spectrometry (LC-MS) analysis to determine heavy to light (H:L) isotopic ratios for each detected protein, thereby enabling calculations of protein turnover. (B) Comparison of median H:L ratios from a single (1-h) time point measurement in this study with multiple time point measurements in Christiano et al. (2014). Green, red, and blue puncta represent short-, medium-, and long-lived proteins, respectively. (C) Distribution of Pearson correlation coefficients for pairwise turnover and expression correlations (transcript abundance; Kemmeren et al., 2014) as a function of protein turnover measurements in the present study. Gray shading indicates areas of weak correlation between mRNA levels and protein turnover, where protein abundance is controlled by protein degradation. (D) Coefficients of variation of H:L ratios of each protein plotted as a function of the median of H:L ratios (H:Lmed). Essential proteins are in blue; other proteins are in black. p values indicate the enrichment of genes in the specific Gene Ontology categories. (E) Hierarchical clustering of proteostasis mutants (left–right) and proteins (top–bottom). Enrichment for functional and localization categories in clusters is indicated on the right.
Figure 2.
Figure 2.. Turnover Effects of Lysosomal and Proteasomal Pathway Perturbations
(A) Enrichment map of gene set enrichment analysis (GSEA) for proteins affected by inhibition of proteasomal and lysosomal degradation (p = 0.005, q = 0.1). Nodes represent gene sets that are enriched at the top or bottom of the ranking of differentially affected proteins (as determined by GSEA). Node size corresponds to the number of genes in the set. Edges indicate the overlap between gene sets, and the thickness indicates the size of the overlap. Red indicates increased and blue indicates decreased turnover. Node center corresponds to the effect of vacuolar degradation inhibition (pep4Δ cells), whereas node rims correspond to the effects of proteasomal degradation inhibition (rpn4Δ cells). (B) Venn diagram representing the number of vacuolar (proteins stabilized in pep4Δ) and proteasomal (stabilized in rpn4Δ) targets. (C) Number of targets of HECT and RING E3 ligases present in the T-MAP. Unique targets are indicated in orange. Shared targets are indicated in gray (shared between at least 2 E3 ligases). Total quantified proteins per mutant are indicated with blue dots. (D) Target overlap between E3 and E2 enzymes (in percentage of E3 ligases total targets, green). E3 and E2 enzyme abundances are indicated (blue). Gray squares indicate no available data passing our quality criteria.
Figure 3.
Figure 3.. Systematic Prediction of Targets for the HRD1 Branch of ERAD
(A) Schematic of the Hrd1 branch of ERAD in yeast. (B) Hierarchically clustered heatmap of the robust T scores of Hrd1 targets in response to deletion of the member of the Hrd1 complex. (C) Stability of Hrd1 targets in cells expressing Hrd1C399S, a catalytically dead allele of HRD1. (D) Localization and topology of bona fide substrates of the Hrd1 complex. Glycosylation sites are indicated as green triangles. (E) Heatmap clustered and colored as in (B) of the robust T scores of Hrd1 targets in response to the deletion of YOS9 and HTM1. (F) Stability of Hrd1 complex substrates in cells expressing cdc48DamP, a hypomorphic allele of CDC48. (G) Stability of Erg5, Erg3, Erg25, and Ysp2 in cells deleted for individual UBX domain-containing substrate adaptors of Cdc48.
Figure 4.
Figure 4.. Spatial Control of Degradation for Key Enzymes in the De Novo Sphingolipid Biosynthesis Pathway
(A) Boxplot showing the turnover (H/Lmed) distribution of enzymes in the de novo sphingolipid biosynthesis pathway. Red dots indicate significantly deviating sphingolipid metabolism enzymes. (B) Stability of Tsc10, Sur1, Csg2, and Orm2 under proteasomal and vacuolar degradation inhibition. (C) Stability scores of Orm2 in the mutants present in T-MAP. (D) Stability scores of Tsc10 in the mutants present in T-MAP. (E) Schematic of the ASI branch of ERAD in yeast. (F) Degradation of GFP-TSC10 after inhibition of protein synthesis by cycloheximide in wild-type (WT), asi1Δ, asi3Δ, doa10Δ, and hrd1Δ. The graph shows the quantification of the western blot shown in Figure S3D. (G) ASI1 and ASI3 genetically interact with genes involved in sphingolipid metabolism (Costanzo et al., 2016). Positive SGA scores represent positive genetic interactions. (H) Model for spatial control of degradation of key enzymes in the de novo sphingolipid biosynthesis pathway by the Tul1 complex (blue box), ASI1/3 complex (purple box), and the vacuole (green box). Ellipses represent sphingolipid metabolic enzymes and are color coded according to their half-lives.

References

    1. Arcones I, Sacristán C, and Roncero C (2016). Maintaining protein homeostasis: early and late endosomal dual recycling for the maintenance of intracellular pools of the plasma membrane protein Chs3. Mol. Biol. Cell 27, 4021–4032. - PMC - PubMed
    1. Arrigo AP, Tanaka K, Goldberg AL, and Welch WJ (1988). Identity of the 19S ‘prosome’ particle with the large multifunctional protease complex of mammalian cells (the proteasome). Nature 331, 192–194. - PubMed
    1. Arthington BA, Bennett LG, Skatrud PL, Guynn CJ, Barbuch RJ, Ulbright CE, and Bard M (1991). Cloning, disruption and sequence of the gene encoding yeast C-5 sterol desaturase. Gene 102, 39–44. - PubMed
    1. Baldridge RD, and Rapoport TA (2016). Autoubiquitination of the Hrd1 Ligase Triggers Protein Retrotranslocation in ERAD. Cell 166, 394–407. - PMC - PubMed
    1. Beeler T, Bacikova D, Gable K, Hopkins L, Johnson C, Slife H, and Dunn T (1998). The Saccharomyces cerevisiae TSC10/YBR265w gene encoding 3-ketosphinganine reductase is identified in a screen for temperature-sensitive suppressors of the Ca2+-sensitive csg2Delta mutant. J. Biol. Chem 273, 30688–30694. - PubMed

Publication types

MeSH terms

Substances