. 2020 Nov 19;80(4):648-665.e9.
doi: 10.1016/j.molcel.2020.10.019. Epub 2020 Nov 10.

Poison Exon Splicing Regulates a Coordinated Network of SR Protein Expression during Differentiation and Tumorigenesis

Affiliations

Poison Exon Splicing Regulates a Coordinated Network of SR Protein Expression during Differentiation and Tumorigenesis

Nathan K Leclair et al. Mol Cell. .

Abstract

The RNA isoform repertoire is regulated by splicing factor (SF) expression, and alterations in SF levels are associated with disease. SFs contain ultraconserved poison exon (PE) sequences that exhibit greater identity across species than nearby coding exons, but their physiological role and molecular regulation is incompletely understood. We show that PEs in serine-arginine-rich (SR) proteins, a family of 14 essential SFs, are differentially spliced during induced pluripotent stem cell (iPSC) differentiation and in tumors versus normal tissues. We uncover an extensive cross-regulatory network of SR proteins controlling their expression via alternative splicing coupled to nonsense-mediated decay. We define sequences that regulate PE inclusion and protein expression of the oncogenic SF TRA2β using an RNA-targeting CRISPR screen. We demonstrate location dependency of RS domain activity on regulation of TRA2β-PE using CRISPR artificial SFs. Finally, we develop splice-switching antisense oligonucleotides to reverse the increased skipping of TRA2β-PE detected in breast tumors, altering breast cancer cell viability, proliferation, and migration.

Keywords: RNA splicing, SR proteins, differentiation, cancer, cross-regulation, antisense oligonucleotides, CRISPR/Cas13, CRISPR-Artificial Splicing Factors, alternative splicing, oncogene.


Conflict of interest statement

Declaration of Interests A patent application concerning this work is in preparation.

Figures

Figure 1.
Figure 1.. SR-PEs are differentially spliced during cell differentiation and tumorigenesis.
(A) Schematic of SR protein genes with coding exons, non-coding regions, and internal cassette PEs or 3’UTR poison sequences (not at scale). (B) SR-PE inclusion (mean PSI of RNA-seq replicates) in human iPSCs differentiated to neurons, pancreatic β-cells, type II alveolar lung epithelial cells, or cardiomyocytes. (C,D) SRSF3-PE inclusion in iPSCs differentiated into mesoderm or cardiomyocytes shown as RNA-seq read coverage and evolutionary conservation across 100 vertebrates (C), and plotted as PSI (D) (n=4, median±interquartile range; *P<0.05, ns- not significant). (E,F) TRA2β-PE inclusion in iPSCs differentiated into neurons shown as RNA-seq read coverage and evolutionary conservation (E), and plotted as PSI (F) (n>4, median±interquartile range; **P<0.01, ****P<0.0001). (G) SR-PE inclusion in tumors vs. matched adjacent normal tissues in 13 TCGA tumor types (n≥30; P<0.05, ns- not significant). (H) SR-PE inclusion in TCGA breast tumors vs. matched adjacent normal tissues (n=213; *P<0.05, **P<0.01, ***P<0.001, ****p<0.0001, ns- not significant). (I-J) Inclusion of SRSF3-PE (I) and TRA2β-PE (J) in TCGA tumors and matched adjacent normal tissues (*P<0.05, **P<0.01, ***P<0.001, ****p<0.0001, ns- not significant). See also Table S1 and Figure S1.
Figure 2.
Figure 2.. Splicing of SR-PEs is cross-regulated in a coordinated fashion.
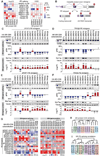
(A) SR-PE inclusion in HepG2 or K562 cells with SR protein KD, normalized as ΔPSI relative to KD control (n=2; P<0.05). (B) Schematic of the splicing reporter minigene for cassette PEs and resulting processed isoforms. (C-F) PE splicing and protein levels from SRSF3-PE (C), TRA2β-PE (D), SRSF7-PE (E), or TRA2α-PE (F) minigenes co-transfected with HA-SR-CDS in HEK293 cells. PE inclusion is measured by RT-PCR with minigene-specific primers that amplify included and skipped isoforms, normalized as ΔPSI relative to empty vector control (CTL) (n=3, mean±SD; *P<0.05, **P<0.01). Protein level is quantified by western blot using a minigene-specific Myc-tag antibody and tubulin loading control, normalized as Log2 fold change (FC) to empty vector (n=3, mean±SD; *P<0.05, **P<0.01). (G) Heatmap representation of PE inclusion and protein levels for 15 SR-PE minigenes co-transfected with 14 HA-SR-CDS quantified as in (C-F) (n=3, mean±SD). (H-I) Clustering of SR proteins based on coding sequence similarity (H) or PE inclusion (I). See also Figures S2-S5 and Tables S2-3.
Figure 3.
Figure 3.. SR proteins compete or cooperate in the cross-regulation of TRA2β-PE in a dose-dependent manner.
(A) PE splicing and protein levels from the TRA2β-PE minigene in HeLa cells co-transfected with increasing concentration of HA-SR-CDS. TRA2β-PE inclusion is measured by RT-PCR with minigene-specific primers that amplify included and skipped isoforms, normalized to empty vector. Protein level is quantified by western blotting using minigene-specific Myc-tag antibody and tubulin loading control, normalized to empty vector. HA-SR-CDS proteins are detected using HA-tag antibody and GAPDH loading control. (B) Heatmap representation of PE splicing and protein levels from the TRA2β-PE minigene co-transfected with increasing concentration of 14 HA-SR-CDS in HeLa cells quantified as in (A). (C-F) PE splicing and protein levels from the TRA2β-PE minigene co-transfected with varying concentration of indicated pairs of HA-SR-CDS in HeLa cells, quantified as in (A). See also Figure S5D.
Figure 4.
Figure 4.. Exonic and intronic regions of SR proteins carry PE splicing regulatory sequences.
(A) Schematic of TRA2β-PE and SRSF3-PE regions swapped in mutant minigenes, and location of UCRs. (B) Domain structure of wild-type and mutant domain swapped SRSF3 and TRA2β proteins. (C) Exonic or intronic regions of the TRA2β-PE minigene (purple) are replaced by regions from the SRSF3-PE minigene (green), along with indicated 5’ or 3’ splice site sequences (SS) (top panel). Wild-type and mutant TRA2β-PE minigenes are co-transfected in HeLa cells with wild-type or mutant HA-SR-CDS shown in B (middle panel). TRA2β-PE inclusion is quantified as PSI by RT-PCR with minigene-specific primers (bottom panel). Native SSs are maintained in intron swaps (Lane 19-36). (D) AS analysis of mutant SRSF3-PE minigenes as in (C). (E) PE splicing and protein expression from the SRSF3-PE minigene in HeLa cells co-transfected with wild-type or mutant HA-SR-CDS. PE inclusion is measured by RT-PCR with minigene specific primers, normalized to empty vector control. Protein expression (Log2FC) is quantified by western blotting using a minigene specific Myc-tag antibody and tubulin loading control, normalized to empty vector control. (F) Same as in (E) with the TRA2β-PE minigene. See also Figure S4F-H.
Figure 5.
Figure 5.. TRA2β-PE inclusion is regulated by discrete exonic and intronic UCR sequences.
(A) Locations of deletions Δ1 to Δ30 (grey boxes) and UCR in the TRA2β-PE minigene. Wild-type or mutant TRA2β-PE minigenes are transfected into HeLa cells and TRA2β-PE inclusion is quantified by RT-PCR with minigene-specific primers and normalized as ΔPSI to wild-type minigene (n=3, mean±SD; *P<0.05, **P<0.01). Protein level is quantified by western blotting using a minigene-specific Myc-tag antibody and tubulin loading control, normalized as Log2FC to wild-type minigene (n=3, mean±SD; *P<0.05, **P<0.01). (B) Positions of gRNAs tiled across TRA2β-PE and upstream or downstream introns. HEK293T cells are transfected with the wild-type TRA2β-PE minigene along with dCasRx and gRNA. TRA2β-PE inclusion is assessed by RT-PCR with minigene specific primers and normalized to non-targeting control (CTL) gRNA. (C) Locations of the deletions from (A) and gRNAs binding positions from (B) along with their effects on TRA2β-PE inclusion, and RBP motifs positions in two regions of interest. See also Figures S2F-G and S6A-C.
Figure 6.
Figure 6.. CASFx-SRs reveal location preferences for RS domain activity.
(A,B) Domain structure of CASFx-SR compared to SR protein (A), and gRNA-guided AS modulation principle (B). (C) TRA2β-PE minigene along with CASFx-SRs and TRA2β targeting gRNAs are co-transfected in HEK293T cells. Heatmap summary of TRA2β-PE inclusion measured by RT-PCR with minigene specific primers and normalized to non-targeting CTL gRNA. (D) PE inclusion in TRA2β endogenous transcript in HEK293T cells transfected with CASFx-SRs and gRNAs measured by RT-PCR using gene-specific primers that amplify included and skipped isoforms (n=3, mean±SD; *P<0.05, **P<0.01). (E) A multi-gRNA CRISPR array targets both TRA2β-PE and SRSF3-PE. (F) PE inclusion in TRA2β and SRSF3 endogenous transcripts in HEK293T cells transfected with CASFx-SRSF3 and gRNAs individually targeting TRA2β-PE, SRSF3-PE, a multi-gRNA array targeting both, or CTL gRNA. TRA2β-PE and SRSF3-PE PSI is quantified by RT-PCR using gene specific primers that amplify included and skipped isoforms (n=3, mean±SD; *P<0.05, **P<0.01). See also Figure S6D-M.
Figure 7.
Figure 7.. ASO-mediated TRA2β-PE inclusion alters breast cancer cell viability, proliferation, and migration.
(A) Principle of ASOs blocking intronic silencer sequences (ISS) to promote TRA2β-PE inclusion. (B) TRA2β-PE splicing in MDA-MB231 and SUM159 cells transfected with TRA2β-targeting (1570) or non-targeting control (CTL) 2’MOE ASOs. TRA2β-PE inclusion and protein levels are measured by RT-PCR and western blot (n=3, mean±SD; *P<0.05, **P<0.01). (C) Cell proliferation in MDA-MB231 and SUM159 cells transfected with 2’MOE ASO-1570 vs. −CTL quantified as percent 5-ethynyl-2´-deoxyuridine (EdU)+ to total Hoechst+ cells (n=3, mean±SD; *P<0.05, **P<0.01). Representative stains are shown. (D) Cell death in MDA-MB231 and SUM159 cells transfected with 2’MOE ASO-1570 vs. −CTL quantified as percent AnnexinV+ to total Hoechst+ cells normalized to ASO-CTL (n=3, mean±SD; *P<0.05, **P<0.01). Representative stains are shown. (E) AS of known TRA2β targets measured by RT-PCR in MDA-MB231 and SUM159 cells transfected with 2’MOE ASO-1570 vs. −CTL (n=3, mean±SD; *P<0.05, **P<0.01). (F,G) Same as in (B,D) for MCF-10A and AR7 human mammary epithelial cells (HMEC) non-transformed mammary epithelial cells. See also Figure S7.

Similar articles

Cited by

References

    1. Ajiro M, Tang S, Doorbar J, and Zheng ZM (2016). Serine/Arginine-Rich Splicing Factor 3 and Heterogeneous Nuclear Ribonucleoprotein A1 Regulate Alternative RNA Splicing and Gene Expression of Human Papillomavirus 18 through Two Functionally Distinguishable cis Elements. J Virol 90, 9138–9152. - PMC - PubMed
    1. Anczukow O, Akerman M, Clery A, Wu J, Shen C, Shirole NH, Raimer A, Sun S, Jensen MA, Hua Y, et al. (2015). SRSF1-Regulated Alternative Splicing in Breast Cancer. Mol Cell 60, 105–117. - PMC - PubMed
    1. Anczukow O, Rosenberg AZ, Akerman M, Das S, Zhan L, Karni R, Muthuswamy SK, and Krainer AR (2012). The splicing factor SRSF1 regulates apoptosis and proliferation to promote mammary epithelial cell transformation. Nat Struct Mol Biol 19, 220–228. - PMC - PubMed
    1. Anko ML, Muller-McNicoll M, Brandl H, Curk T, Gorup C, Henry I, Ule J, and Neugebauer KM (2012). The RNA-binding landscapes of two SR proteins reveal unique functions and binding to diverse RNA classes. Genome Biol 13, R17. - PMC - PubMed
    1. Best A, Dagliesh C, Ehrmann I, Kheirollahi-Kouhestani M, Tyson-Capper A, and Elliott DJ (2013). Expression of Tra2 beta in Cancer Cells as a Potential Contributory Factor to Neoplasia and Metastasis. Int J Cell Biol 2013, 843781. - PMC - PubMed

Publication types

MeSH terms