. 2020 Nov 17;53(5):971-984.e5.
doi: 10.1016/j.immuni.2020.10.010. Epub 2020 Nov 10.

The Transcription Factor Foxp3 Shapes Regulatory T Cell Identity by Tuning the Activity of trans-Acting Intermediaries

Affiliations

The Transcription Factor Foxp3 Shapes Regulatory T Cell Identity by Tuning the Activity of trans-Acting Intermediaries

Joris van der Veeken et al. Immunity. .

Abstract

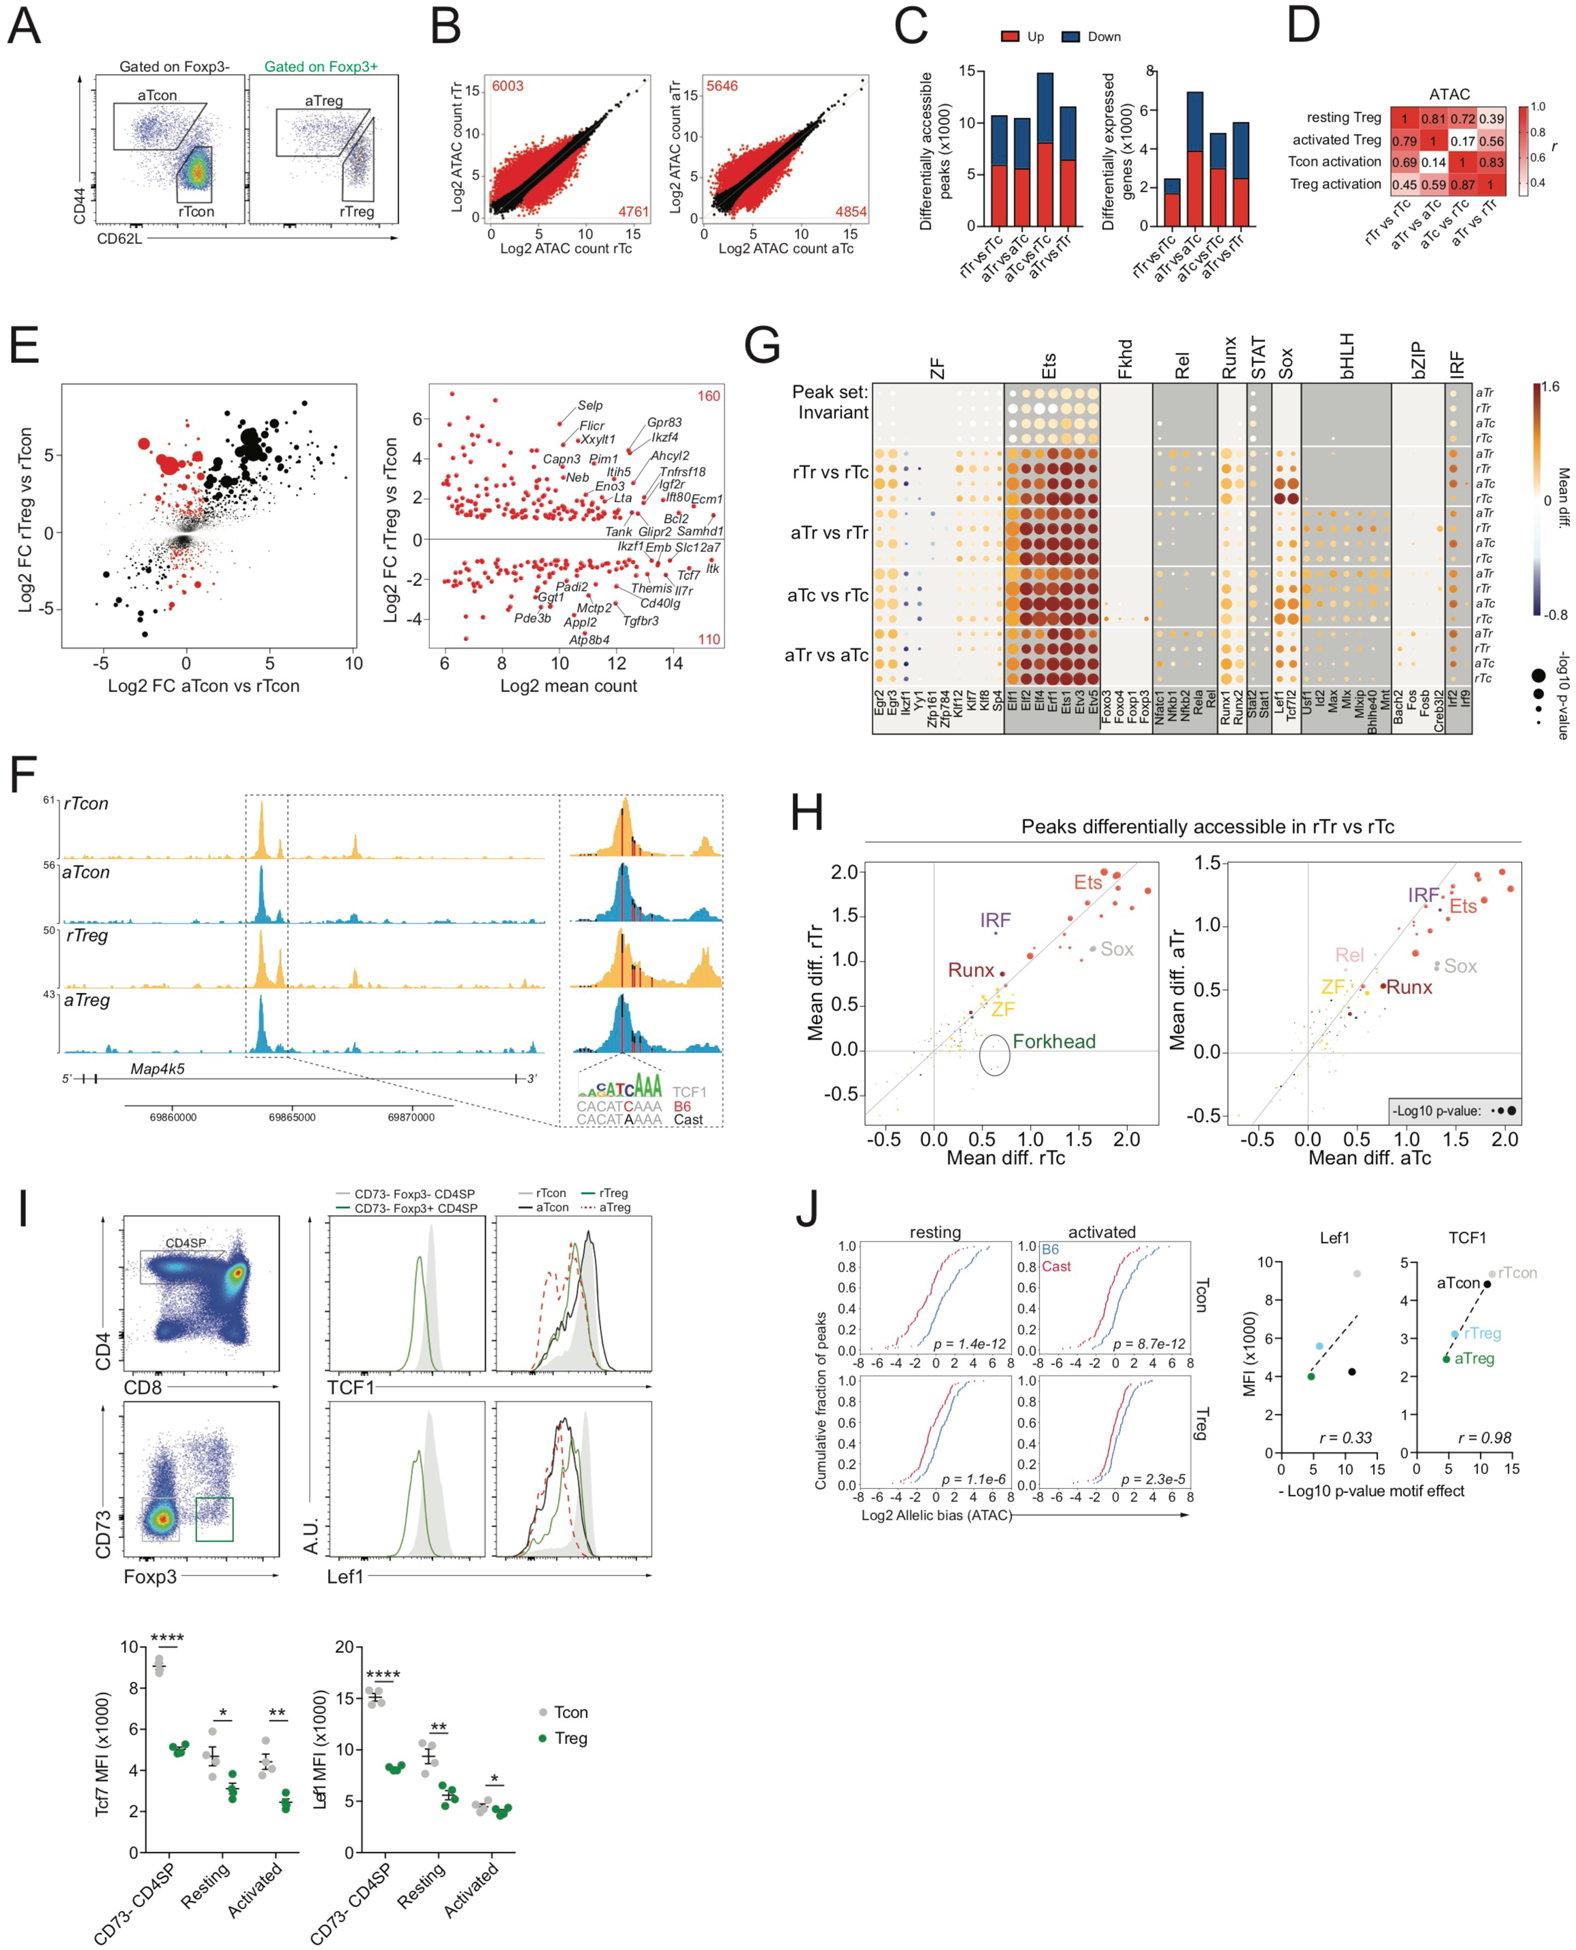
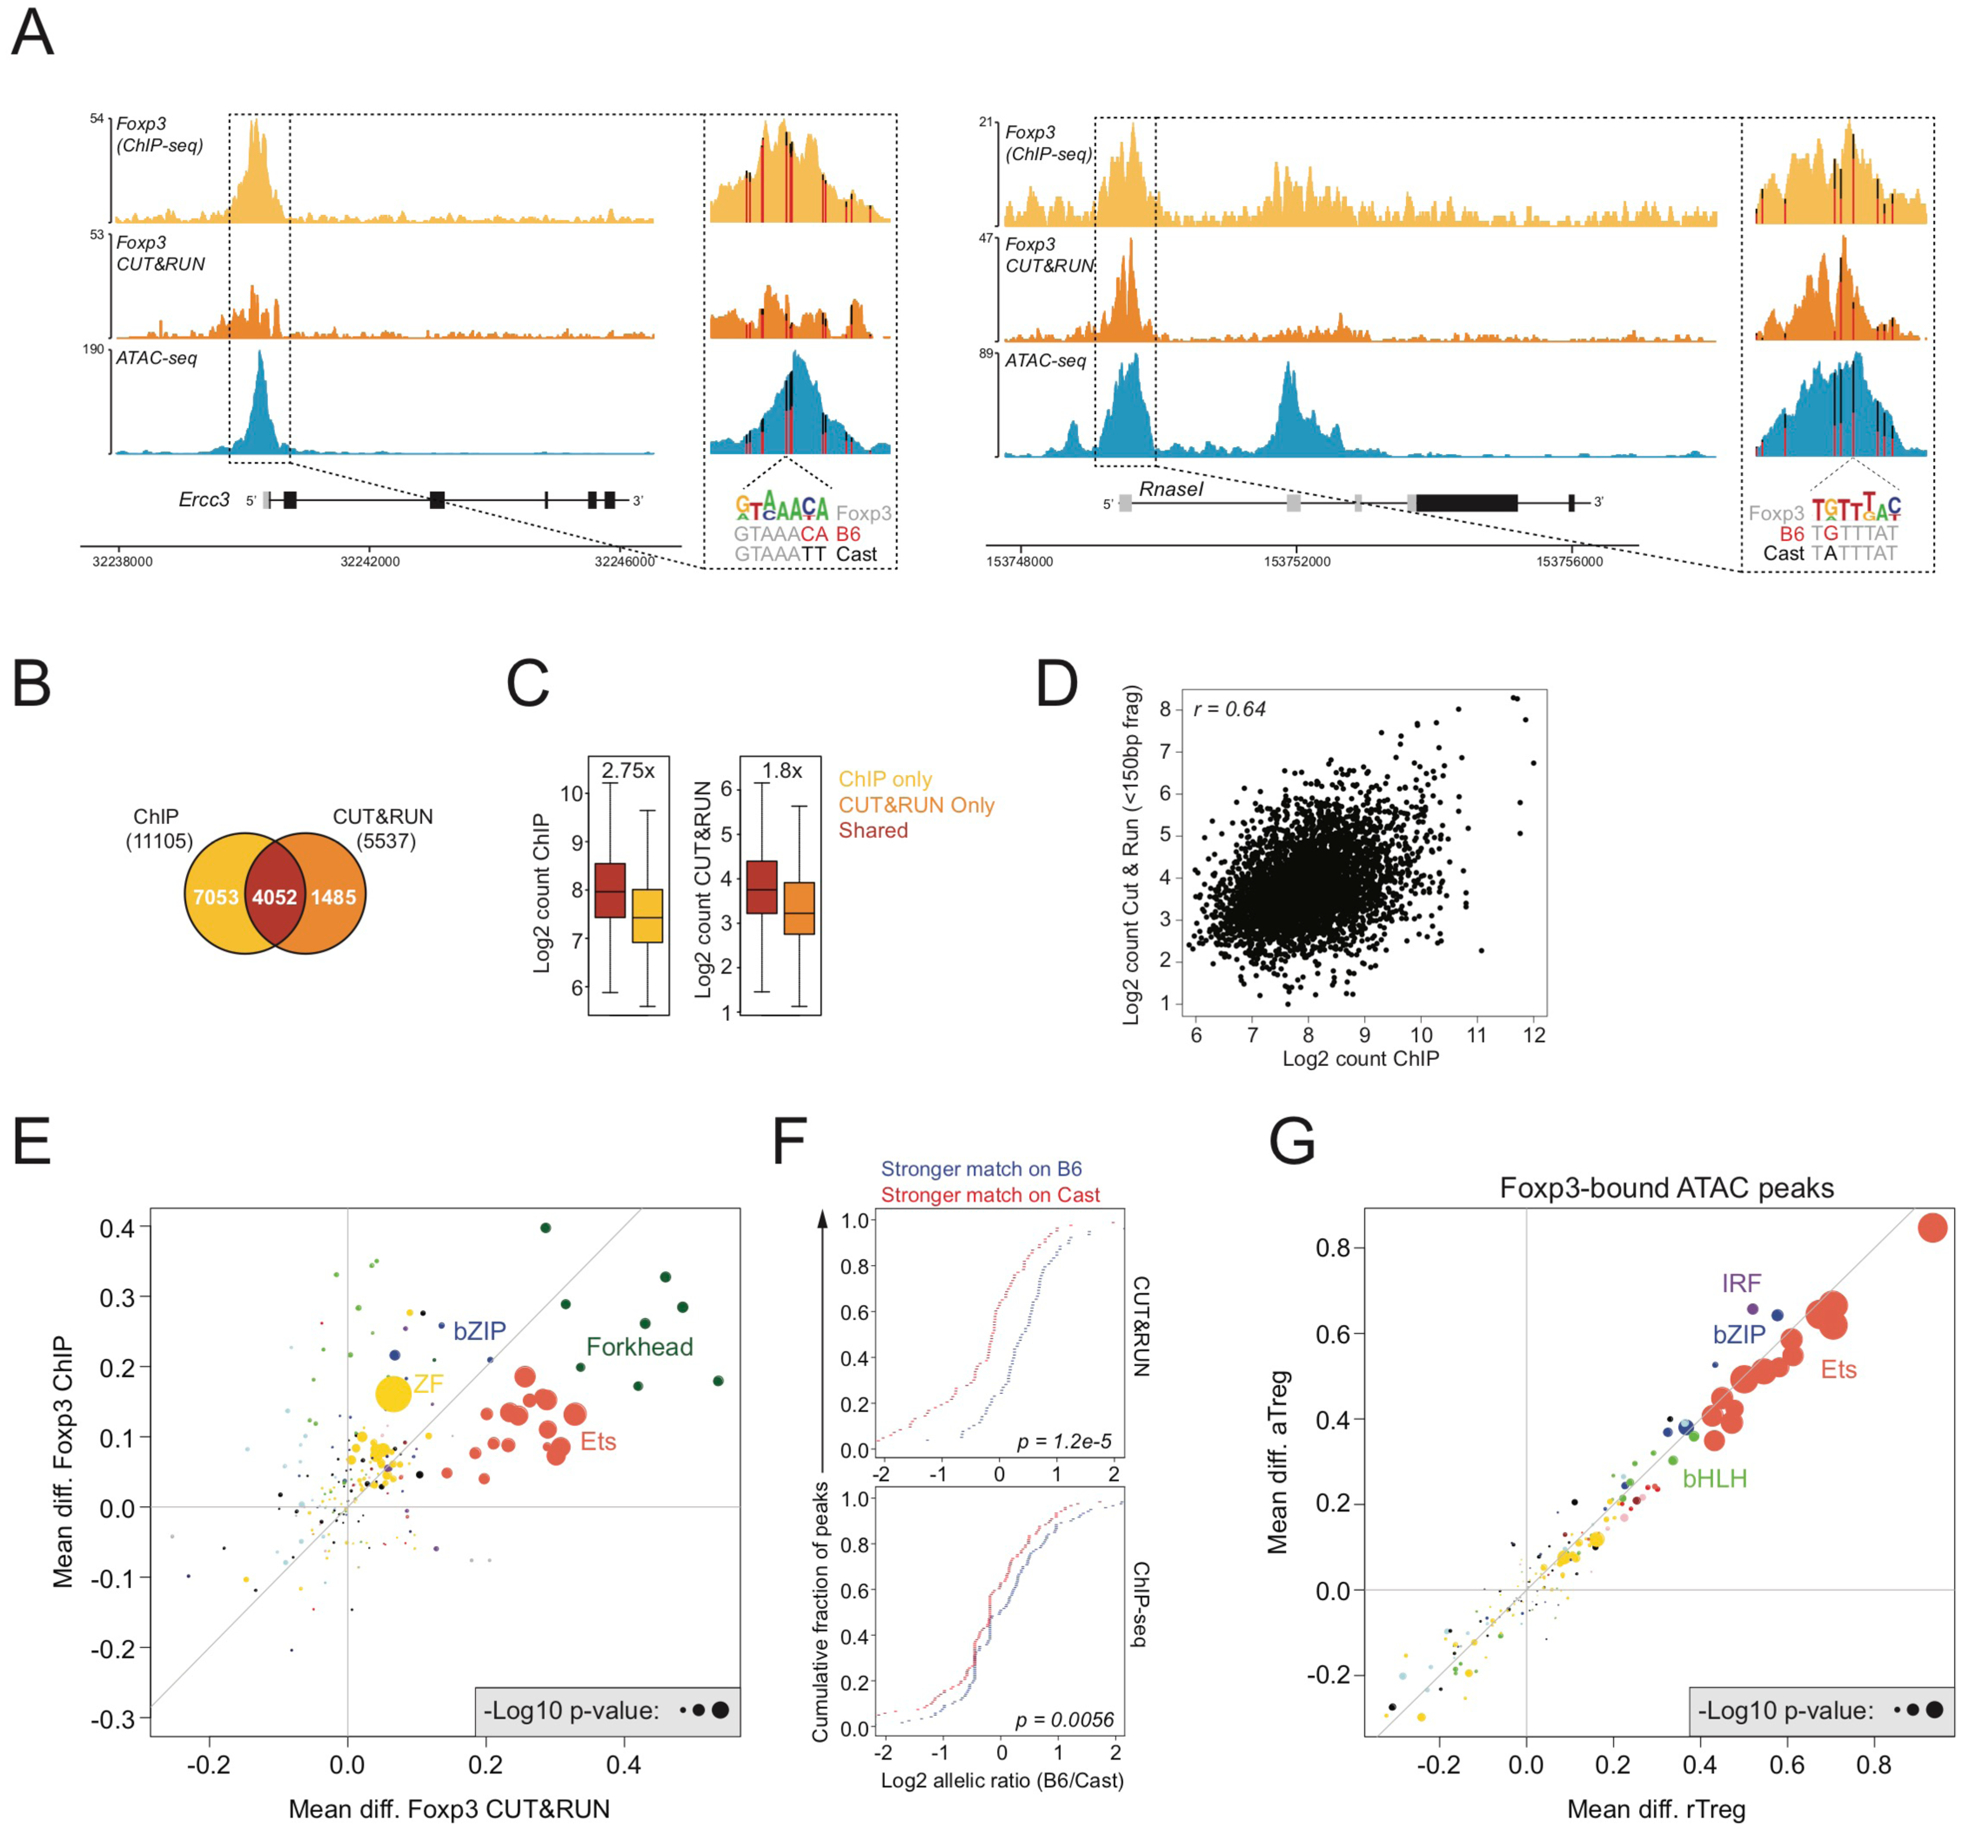
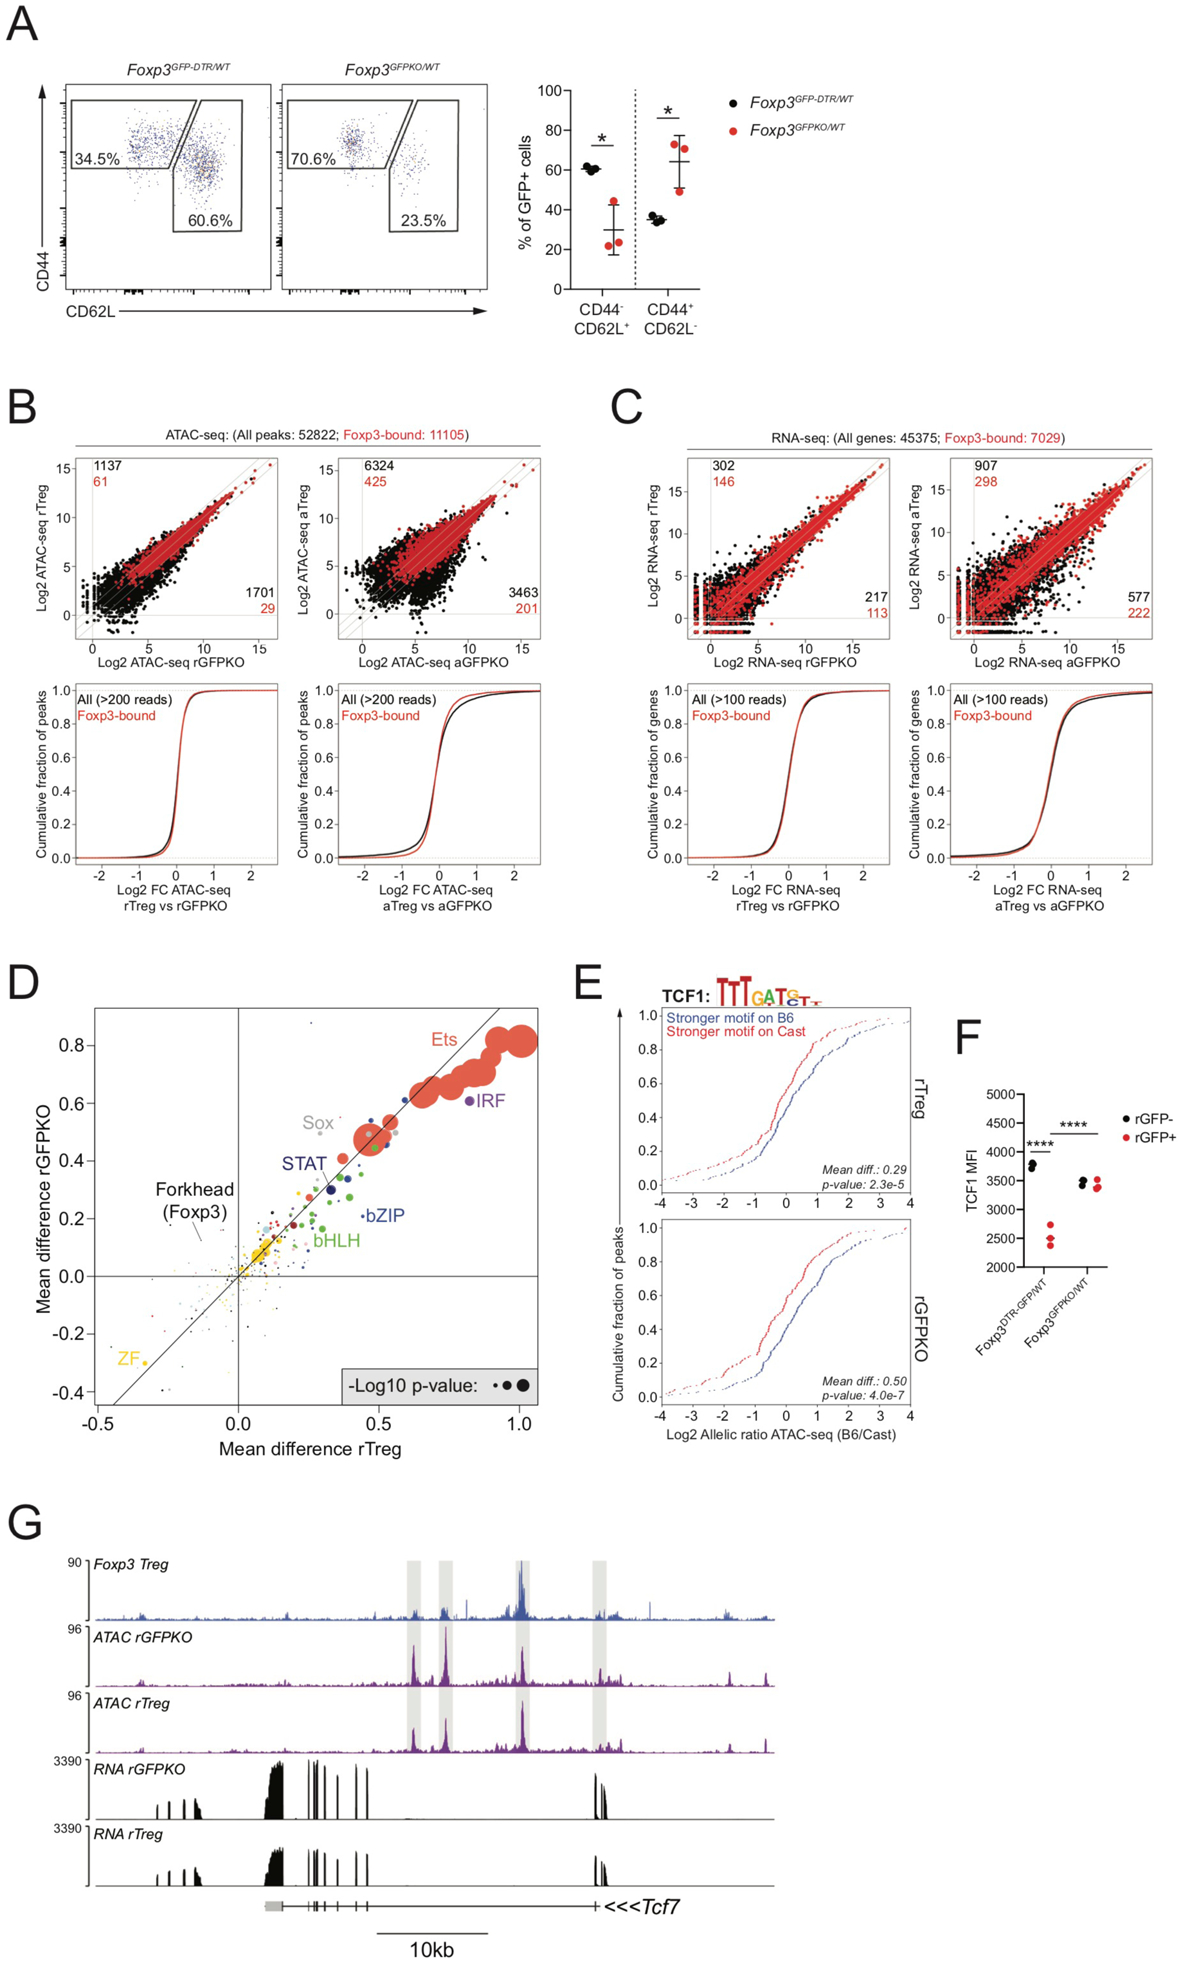
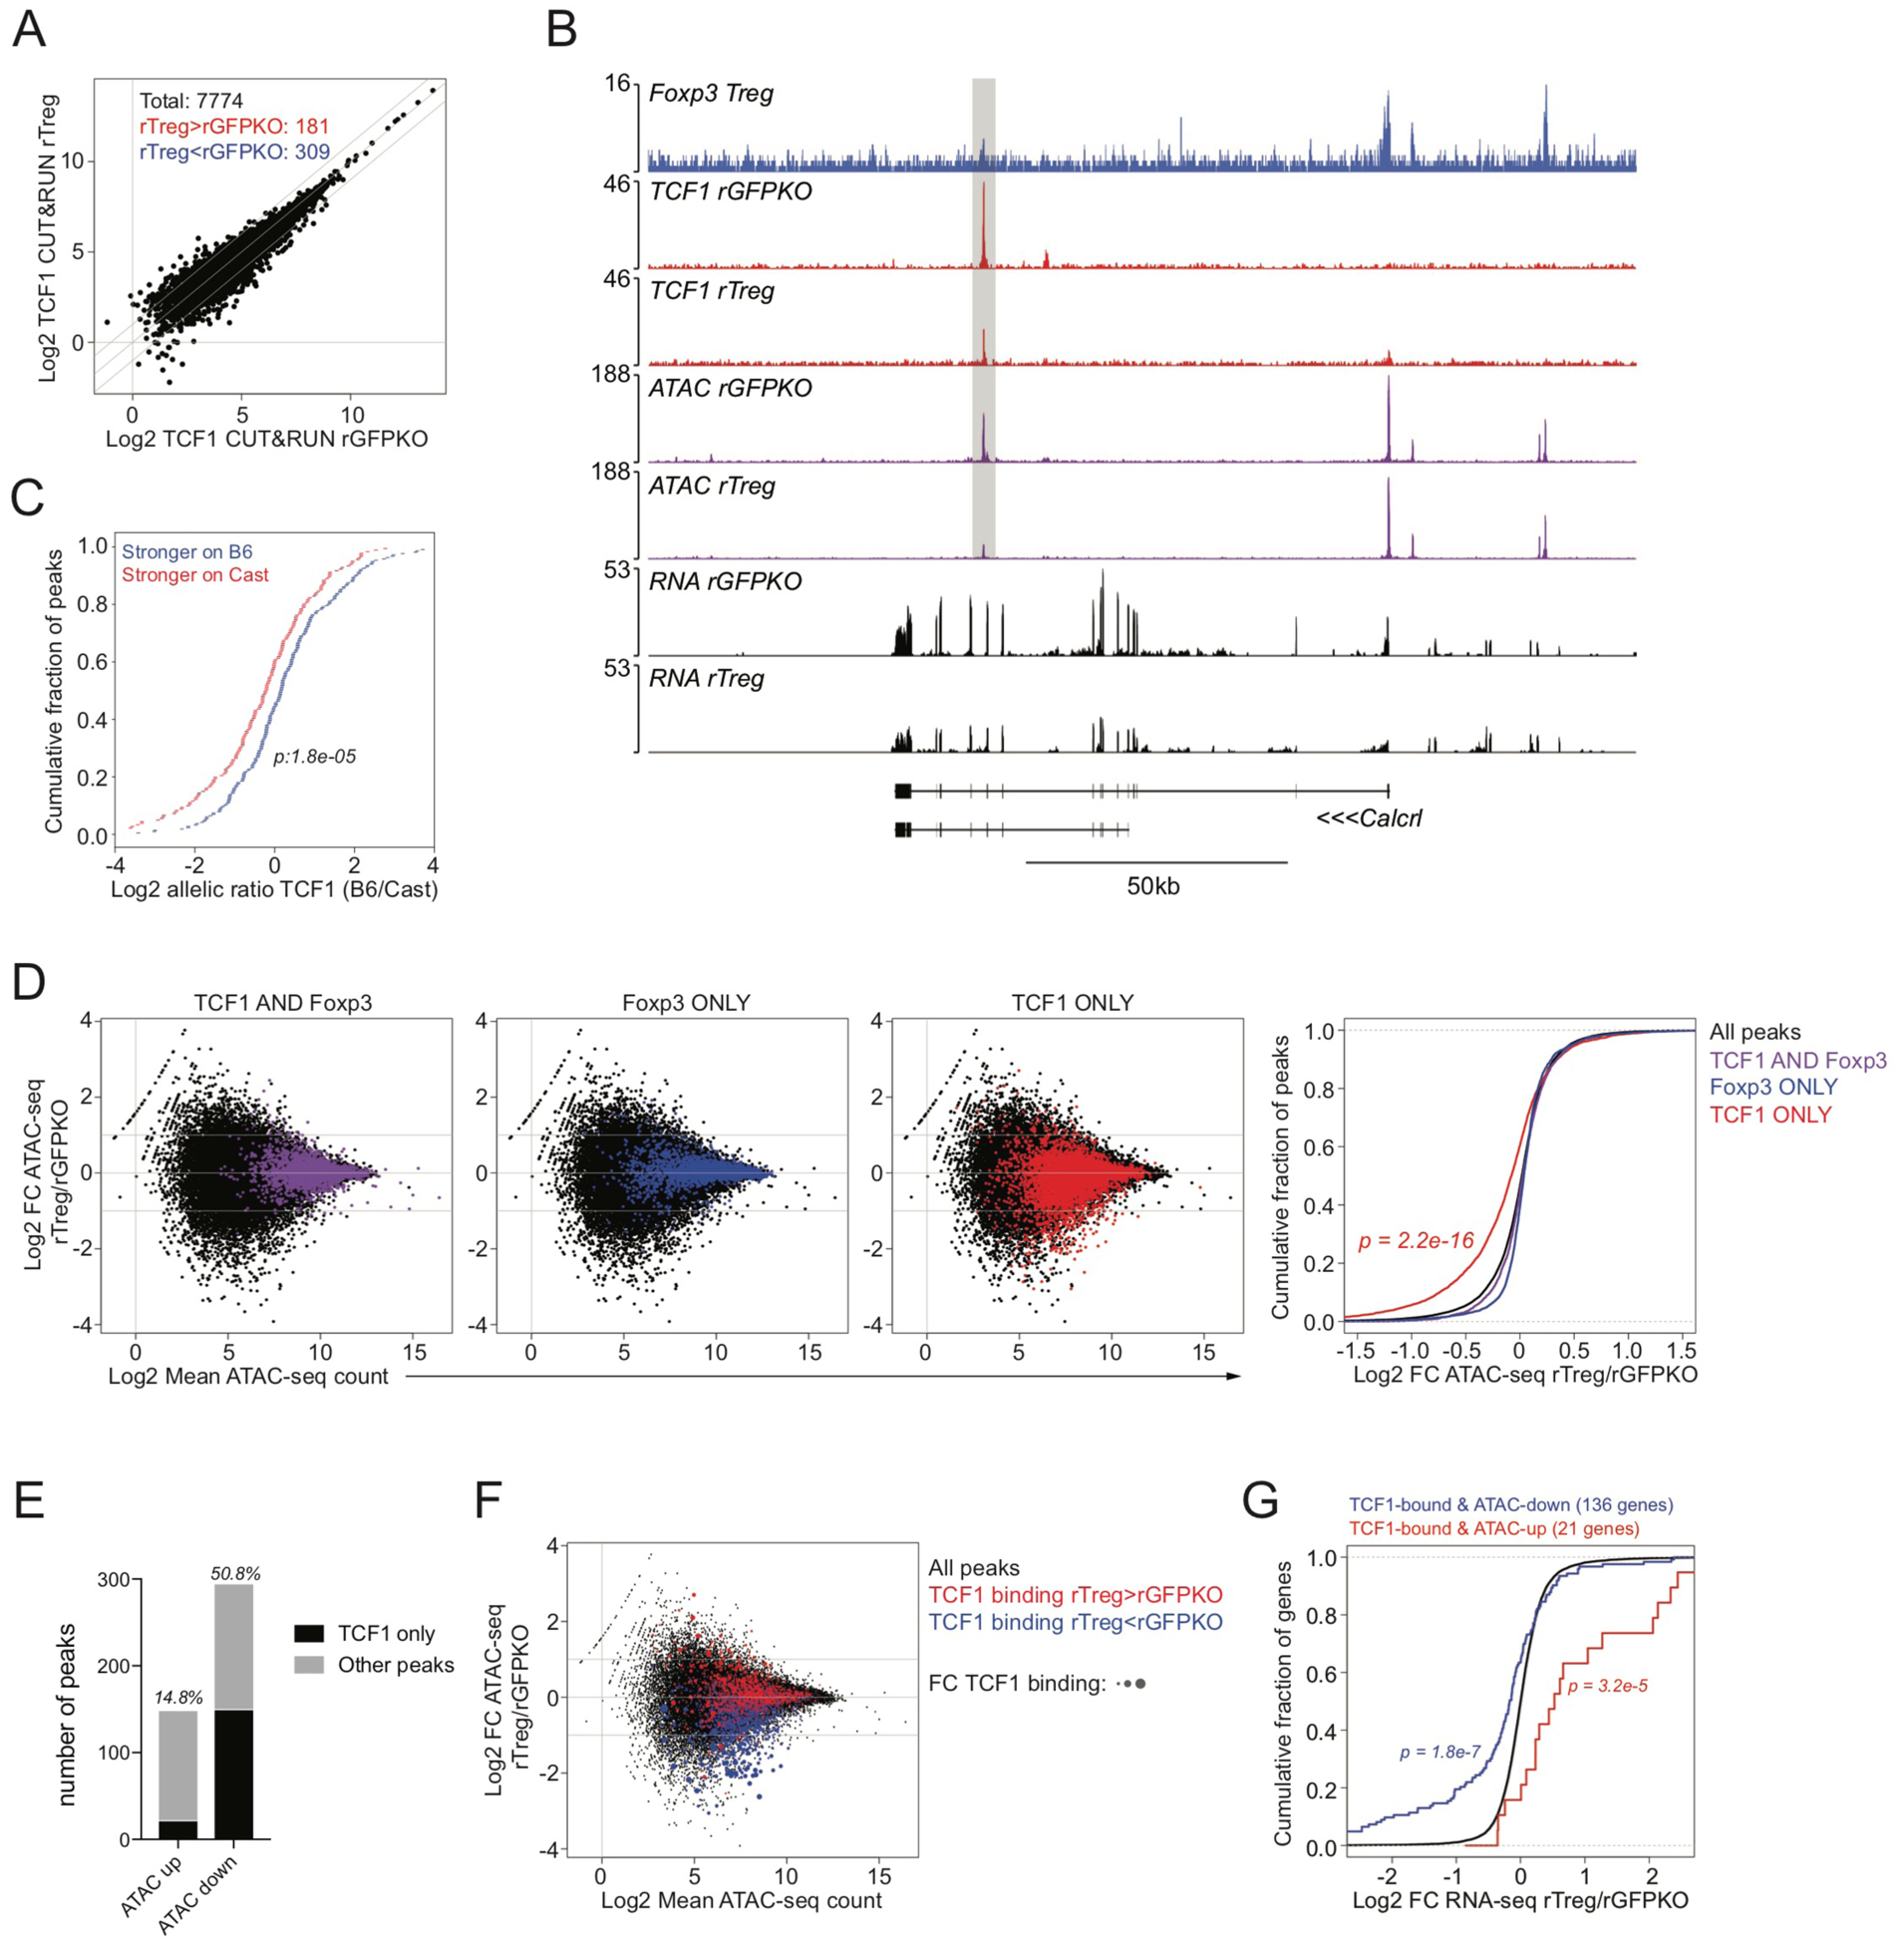
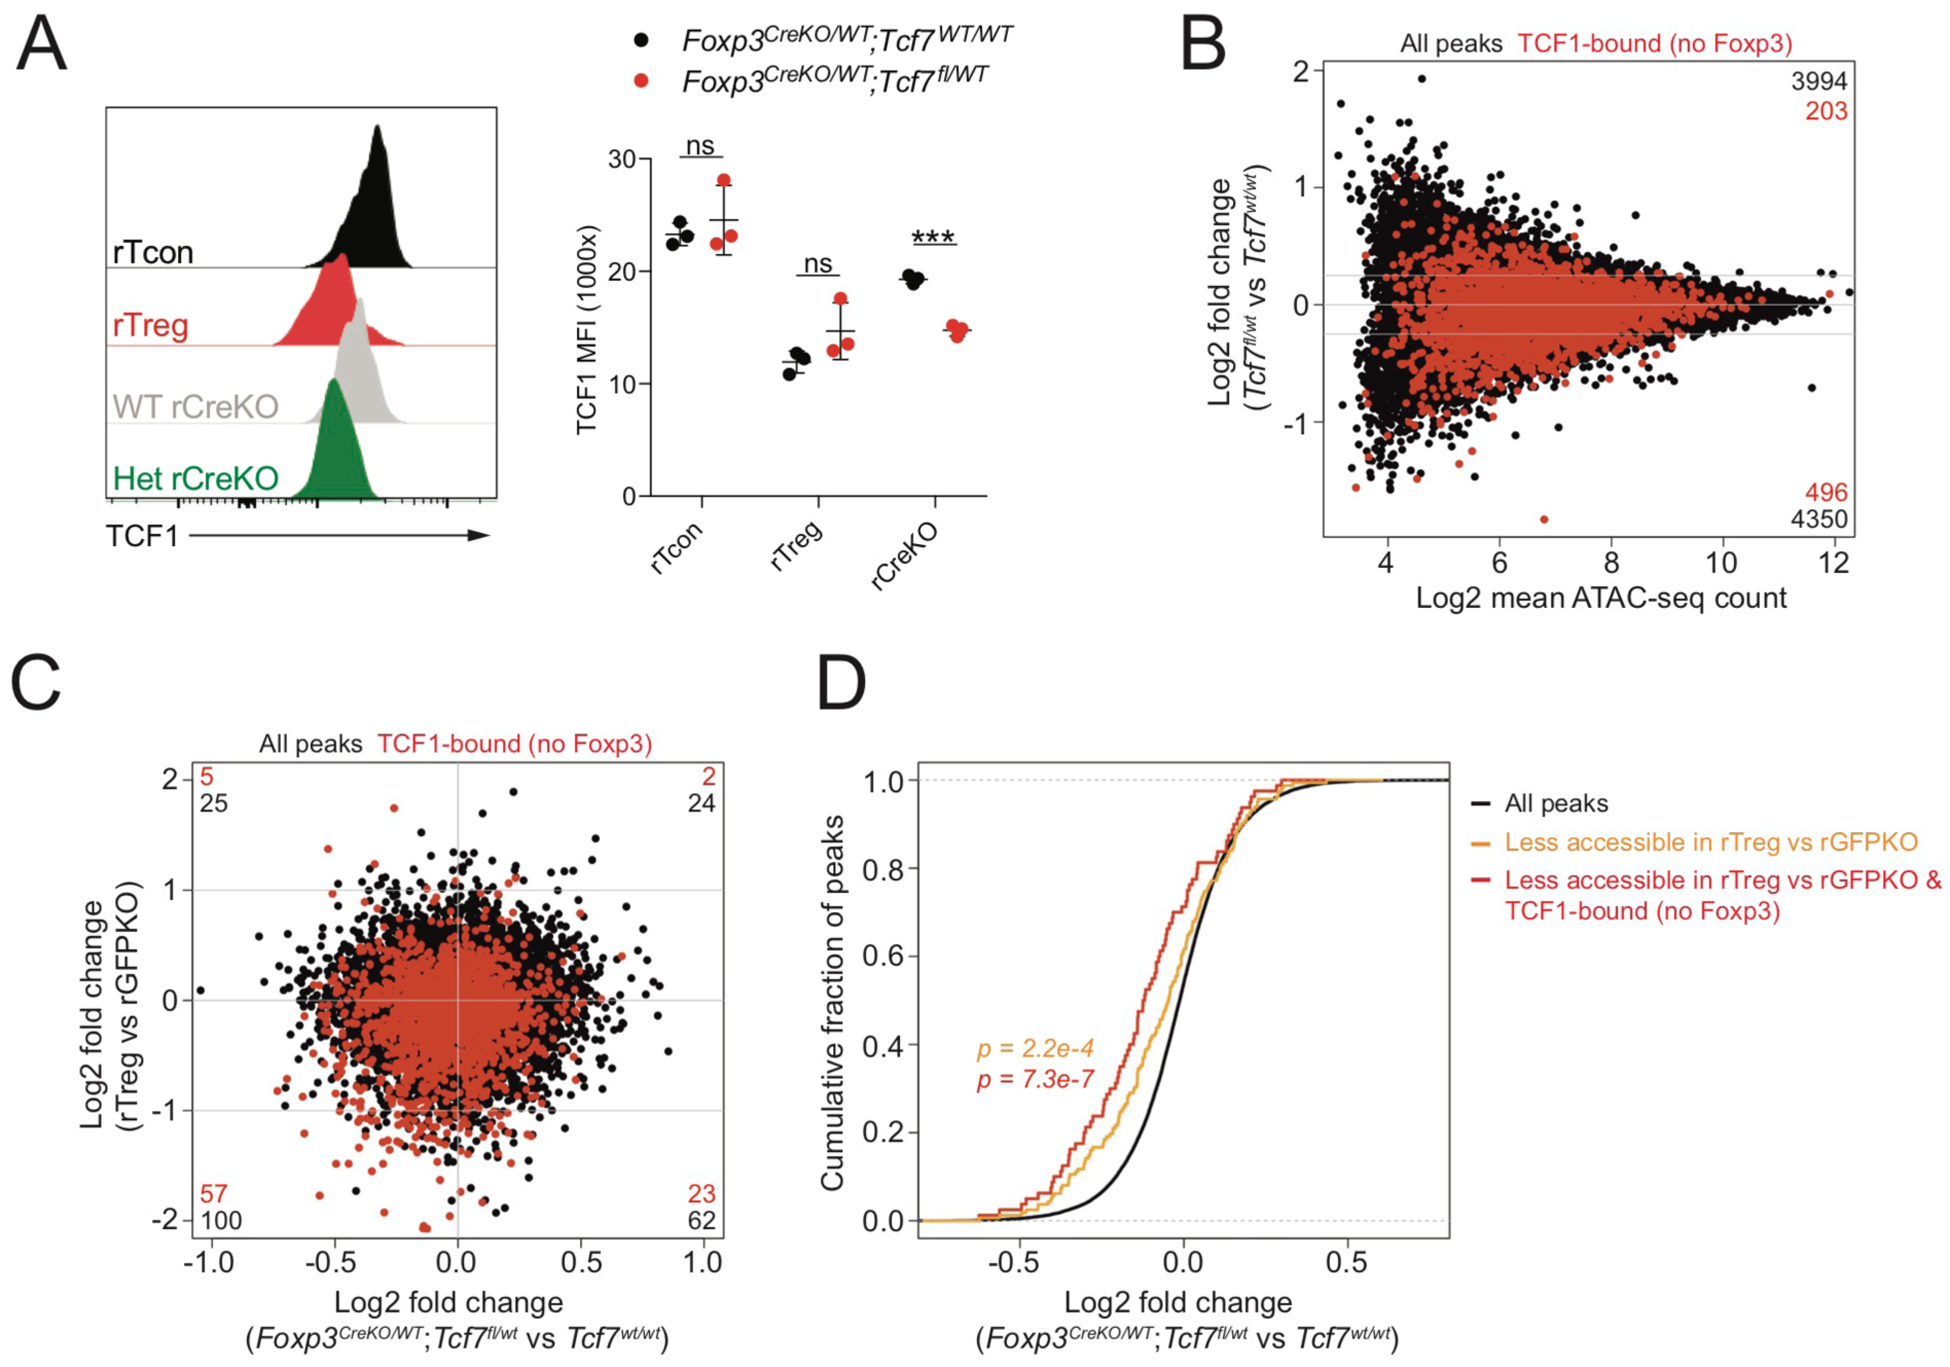
Regulatory T (Treg) cell identity is defined by the lineage-specifying transcription factor (TF) Foxp3. Here we examined mechanisms of Foxp3 function by leveraging naturally occurring genetic variation in wild-derived inbred mice, which enables the identification of DNA sequence motifs driving epigenetic features. Chromatin accessibility, TF binding, and gene expression patterns in resting and activated subsets of Treg cells, conventional CD4 T cells, and cells expressing a Foxp3 reporter null allele revealed that the majority of Foxp3-dependent changes occurred at sites not bound by Foxp3. Chromatin accessibility of these indirect Foxp3 targets depended on the presence of DNA binding motifs for other TFs, including TCF1. Foxp3 expression correlated with decreased TCF1 and reduced accessibility of TCF1-bound chromatin regions. Deleting one copy of the Tcf7 gene recapitulated Foxp3-dependent negative regulation of chromatin accessibility. Thus, Foxp3 defines Treg cell identity in a largely indirect manner by fine-tuning the activity of other major chromatin remodeling TFs such as TCF1.


Conflict of interest statement

Declaration of Interests A.Y.R. is an SAB member, has equity in Sonoma Biotherapeutics and Vedanta Biosciences, and is a co-inventor or has IP licensed to Takeda that is unrelated to the content of this study.

Figures

FIGURE 1:
FIGURE 1:. Foxp3-dependent suppression of autoimmune inflammation in B6/Cast F1 mice
(A): Generation of experimental F1 mice. Female B6 Foxp3DTR-GFP/GFPKO mice were bred to male Cast/EiJ (Cast) mice. (B): Survival of male Foxp3GFPKO/Y B6 (n=5) and B6/Cast F1 (n=8) mice. (C): Spleens and lymph nodes of B6 and B6/Cast F1 Foxp3DTR-GFP and Foxp3GFPKO mice. (D): CD4 T cell composition in lymph nodes of B6 and B6/Cast F1 Foxp3DTR-GFP and Foxp3GFPKO mice determined by flow cytometry. For Figures C-D, mice were analyzed at 3 weeks of age; data points were accumulated over multiple experiments. (E): Sickness and inflammation scores based on combined histological assessment of skin, liver, and lung from B6 Foxp3DTR-GFP (n=8), B6/Cast F1 Foxp3DTR-GFP (n=7), B6 Foxp3GFPKO (n=9) and B6/Cast F1 Foxp3GFPKO (n=7) mice. (F): H&E staining of skin, liver, and lung from B6 and B6/Cast F1 Foxp3DTR-GFP and Foxp3GFPKO mice. (G): Pathology scores of individual tissues. For E-G, data are derived from accumulated formaldehyde-preserved tissues from multiple experiments with 1–4 mice per group.
FIGURE 2:
FIGURE 2:. TF binding motif requirements for Treg cell-specific chromatin accessibility
(A): Flow cytometric isolation of resting and activated CD4+ Tcon (Foxp3−) and Treg (Foxp3+) from pooled spleen and peripheral lymph nodes. (B): ATAC-seq analysis of resting Tcon (rTc), resting Treg (rTr), activated Tcon (aTc), and activated Treg (aTr) cells. Differentially accessible (DA) chromatin regions (p<0.05) are highlighted in red. (C): DA chromatin regions and gene expression changes across multiple comparisons. (D): Pearson correlation (r) between chromatin accessibility changes identified across multiple comparisons. Peak sets were identified as follows: resting Treg (DA in rTr vs rTc), activated Treg (DA in aTr vs aTc), Tcon activation (DA in aTc vs rTc), Treg activation (DA in aTr vs rTr). (E): Gene expression changes in rTreg vs rTcon were compared to gene expression changes in aTcon vs rTcon. Genes undergoing strong and very significant gene expression changes (p<10e-5, log2 FC>1) in rTreg vs rTcon were selected, while excluding genes that underwent similar changes in aTcon vs rTcon (log2 FC<1). The resulting Treg-specific gene signature (270 genes) is highlighted in red. Dots are scaled according to the −log10 p-value in rTreg vs rTcon. The right panel shows the gene expression levels and changes for these signature genes in rTreg vs rTcon. (F): ATAC-seq tracks from indicated populations. Vertical bars mark the position of genetic variants, with color indicating the ratio of sequencing reads derived from each allele. A TCF7 motif variant is highlighted. (G): Effect of genetic variation in select TF binding motifs on allelic bias in chromatin accessibility across cell types and peak sets. Mean diff. indicates the difference in mean log2 allelic bias (B6/Cast) for peaks with stronger motif matches on the B6 allele versus peaks with stronger motifs on the Cast allele. Positive and negative values are indicative of a positive or negative effect of the intact motif on chromatin accessibility. Data points are scaled according to the −log10 p-value of a t-test comparing mean log2 allelic bias of peaks with stronger motif matches on the B6 allele to peaks with stronger motifs on the Cast allele (see also Figure S1). (H): Effect of TF binding motif variation on accessibility of peaks DA in rTr vs rTc (resting Treg signature). Data points are colored according to motif family. (I): Flow cytometry plots of Lef1 and TCF1 levels in different subpopulations of thymic and peripheral CD4 T cells. (J): Effect of the TCF7/Lef1 motif on chromatin accessibility of resting Treg signature peaks in different cell types. Correlation between Lef1 and TCF1 protein levels measured by intracellular flow cytometry and p-value of motif effect determined as shown in Figure S1.
FIGURE 3:
FIGURE 3:. The forkhead motif regulates Foxp3 binding but not accessibility of Foxp3 targets
(A): Foxp3 ChIP-seq, Foxp3 CUT&RUN, and ATAC-seq (rTreg) tracks. Vertical bars mark the position of genetic variants, with color indicating the ratio of sequencing reads derived from each allele. A Foxp3 motif variant is highlighted. (B): Overlap between Foxp3 binding sites identified by ChIP or CUT&RUN in bulk Treg cells from pooled spleen and lymph nodes of Foxp3DTR-GFP B6/Cast F1 mice. (C): Read counts at Foxp3 binding sites identified by ChIP-seq, CUT&RUN, or by both techniques. (D): Pearson correlation between Foxp3 binding intensity measured by ChIP and CUT&RUN for sites detected by both techniques. (E): Effect of genetic variation in TF binding motifs on allelic bias in Foxp3 binding, measured by ChIP or CUT&RUN. See Figure S1. (F): Effect of Foxp3 motif variation on allelic bias in Foxp3 binding by ChIP (bottom) or CUT&RUN (top). (G): Effect of genetic variation in TF binding motifs on allelic bias in chromatin accessibility (ATAC-seq) of Foxp3-bound sites.
FIGURE 4:
FIGURE 4:. Foxp3-dependent chromatin accessibility changes are largely driven by trans-acting intermediates
(A): CD44 and CD62L expression on GFP+ cells isolated from Foxp3DTR-GFP/WT and Foxp3GFPKO/WT B6/Cast F1 females. (B): ATAC-seq analysis of CD44loCD62Lhi Treg (rTreg), CD44hiCD62Llo Treg (aTreg) and reporter-null expressing counterparts (rGFPKO and aGFPKO). Black dots: all ATAC-seq peaks, red dots: Foxp3-bound peaks. Number of all peaks (black) or Foxp3-bound peaks (red) undergoing >2-fold change in chromatin accessibility between cell types is shown. CDF plots (bottom) show quantification of accessibility changes. (C): Similar to panel B, showing gene expression changes at all genes (black) and Foxp3-bound genes (red). (D): Effect of TF binding motif variation on allelic bias in chromatin accessibility in rTreg and rGFPKO cells. Dots are colored according to TF family. See Figure S1. (E): Effect of TCF1 motif variation on chromatin accessibility in rTreg (top) and rGFPKO (bottom) cells. Blue lines indicate peaks with stronger motif matches on the B6 allele, red lines indicate peaks with stronger motif matches on the Cast allele, as described in Figure S1. (F): TCF1 protein levels in Treg and Foxp3GFPKO cells measured by flow cytometry. (****: p<0.0001; by two-way ANOVA). (G): Track examples showing Foxp3 binding, chromatin accessibility, and gene expression at the Tcf7 locus.
FIGURE 5:
FIGURE 5:. Foxp3-dependent repression of chromatin accessibility at TCF1 targets
(A): Normalized TCF1 CUT&RUN counts at genomic regions overlapping ATAC-seq peaks in resting CD44loCD62Lhi Treg and resting CD44loCD62Lhi GFPKO cells isolated from Foxp3DTR-GFP/WT or Foxp3GFPKO/WT B6/Cast F1 females, respectively. Total number of TCF1-bound ATAC-seq peaks is shown. Diagonal lines indicate 2-fold difference in binding between cell types. (B): Track examples of Foxp3 and TCF1 CUT&RUN, ATAC-seq, and RNA-seq at the Calcrl locus. A Foxp3-unbound site with reduced accessibility and reduced TCF1 binding in resting Treg vs GFPKO cells is shown. (C): Effect of genetic variation in the TCF1 motif on allelic bias in TCF1 CUT&RUN in resting Treg cells. See Figure S1. (D): Scatter plots showing mean ATAC-seq count and log2 fold change in ATAC-seq counts in rTreg vs rGFPKO cells. Black dots represent all ATAC-seq peaks. Colored dots represent peaks bound by both TCF1 and Foxp3 (left, purple), Foxp3 only (center, blue), or TCF1 only (right, red). Accessibility changes at these peak sets are summarized in the CDF plot (far right). Sites bound by TCF1, but not Foxp3, are significantly less accessible in rTreg cells vs rGFPKO cells (one-sided Kolmogorov-Smirnov test comparing red and black distributions). (E): TCF1 binding to ATAC-seq peaks with higher (ATAC up) or lower (ATAC down) accessibility (>2 fold) in rTreg vs rGFPKO cells. ATAC-seq peaks with at least 100 reads in one cell type are included in the analysis. TCF1 only denotes peaks with TCF1 binding, but no Foxp3 (red dots in panel D). (F): Scatter plots showing mean ATAC-seq count and log2 fold change in ATAC-seq counts in resting Treg vs GFPKO cells, similar to (D). Red dots have stronger TCF1 binding in rTreg cells vs rGFPKO cells, blue dots have stronger TCF1 binding in rGFPKO cells vs rTreg cells. Dots are scaled according to the absolute fold change in TCF1 binding. Sites with relatively stronger TCF1 binding in GFPKO cells show preferential Foxp3-dependent loss of chromatin accessibility. (G): CDF plot showing expression changes for all genes (black) and TCF1-bound genes that lost (blue) or gained (red) chromatin accessibility in rGFPKO vs rTreg cells.
FIGURE 6:
FIGURE 6:. Downregulation of TCF1 rescues Foxp3-dependent repression of chromatin accessibility in the absence of Foxp3.
(A): TCF1 protein levels in indicated populations of CD44loCD62Lhi CD4 T cells from pooled spleen and lymph nodes of female Foxp3ΔEGFPiCre/WTTcf7WT/WT or Foxp3ΔEGFPiCre/WTTcf7fl/WT mice. P-values from multiple t-tests (***: p<0.001). (B): ATAC-seq analysis of WT and Tcf7 heterozygous rGFPKO cells. Peaks bound by TCF1, but not by Foxp3, are highlighted in red. Number of peaks in each section of the plot is indicated. (C): Fold change – fold change plot showing chromatin accessibility in rTreg vs rGFPKO cells compared to WT vs Tcf7 heterozygous rGFPKO cells. (D): TCF1-dependent changes in chromatin accessibility at all peaks (black), all peaks less accessible in WT rTreg vs rGFPKO cells, and TCF1-bound peaks less accessible in WT rTreg vs rGFPKO cells. P-value from one-sided Kolmogorov-Smirnov test comparing red or orange distributions to the black distribution.

Comment in

References

    1. Arvey A, van der Veeken J, Plitas G, Rich SS, Concannon P, and Rudensky AY (2015). Genetic and epigenetic variation in the lineage specification of regulatory T cells. Elife 4, e07571. - PMC - PubMed
    1. Arvey A, van der Veeken J, Samstein RM, Feng Y, Stamatoyannopoulos JA, and Rudensky AY (2014). Inflammation-induced repression of chromatin bound by the transcription factor Foxp3 in regulatory T cells. Nat Immunol 15, 580–587. - PMC - PubMed
    1. Bennett CL, Christie J, Ramsdell F, Brunkow ME, Ferguson PJ, Whitesell L, Kelly TE, Saulsbury FT, Chance PF, and Ochs HD (2001). The immune dysregulation, polyendocrinopathy, enteropathy, X-linked syndrome (IPEX) is caused by mutations of FOXP3. Nat Genet 27, 20–21. - PubMed
    1. Boller S, Ramamoorthy S, Akbas D, Nechanitzky R, Burger L, Murr R, Schübeler D, and Grosschedl R (2016). Pioneering Activity of the C-Terminal Domain of EBF1 Shapes the Chromatin Landscape for B Cell Programming. Immunity 44, 527–541. - PubMed
    1. Brunkow ME, Jeffery EW, Hjerrild KA, Paeper B, Clark LB, Yasayko SA, Wilkinson JE, Galas D, Ziegler SF, and Ramsdell F (2001). Disruption of a new forkhead/winged-helix protein, scurfin, results in the fatal lymphoproliferative disorder of the scurfy mouse. Nat Genet 27, 68–73. - PubMed

Publication types

MeSH terms

LinkOut - more resources