

Spiral artery blood flow during pregnancy: a systematic review and meta-analysis
- PMID: 33176723
- PMCID: PMC7656690
- DOI: 10.1186/s12884-020-03150-0
Spiral artery blood flow during pregnancy: a systematic review and meta-analysis
Abstract
Background: Downstream remodeling of the spiral arteries (SpA) decreases utero-placental resistance drastically, allowing sustained and increased blood flow to the placenta under all circumstances. We systematically evaluated available reports to visualize adaptation of spiral arteries throughout pregnancy by ultra-sonographic measurements and evaluated when this process is completed.
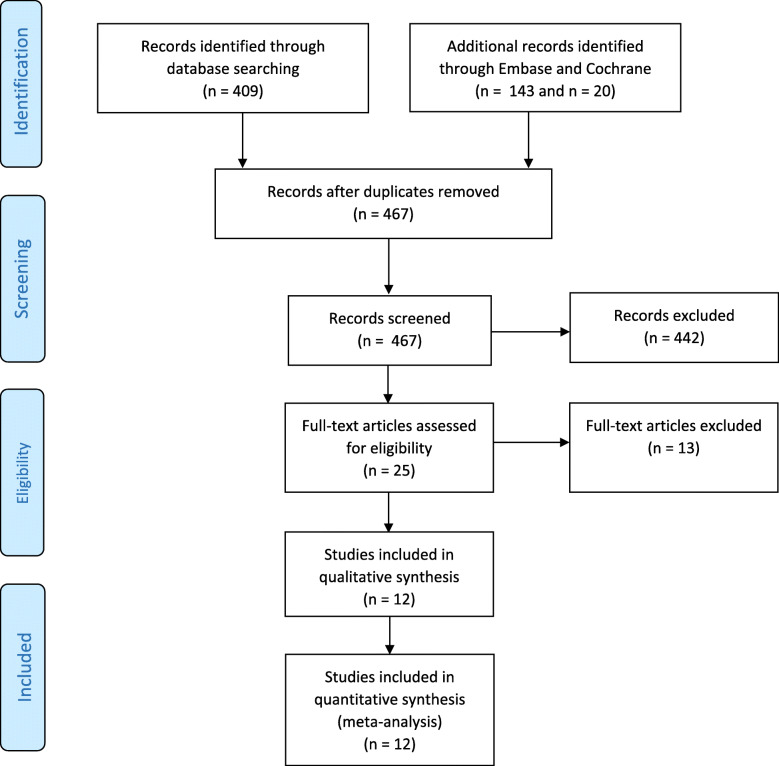
Methods: A systematic review and meta-analysis of spiral artery flow (pulsatility index (PI), resistance index (RI) and peak systolic velocity (PSV)) was performed. English written articles were obtained from Pubmed, EMBASE and Cochrane Library and included articles were assessed on quality and risk of bias. Weighted means of Doppler indices were calculated using a random-effects model.
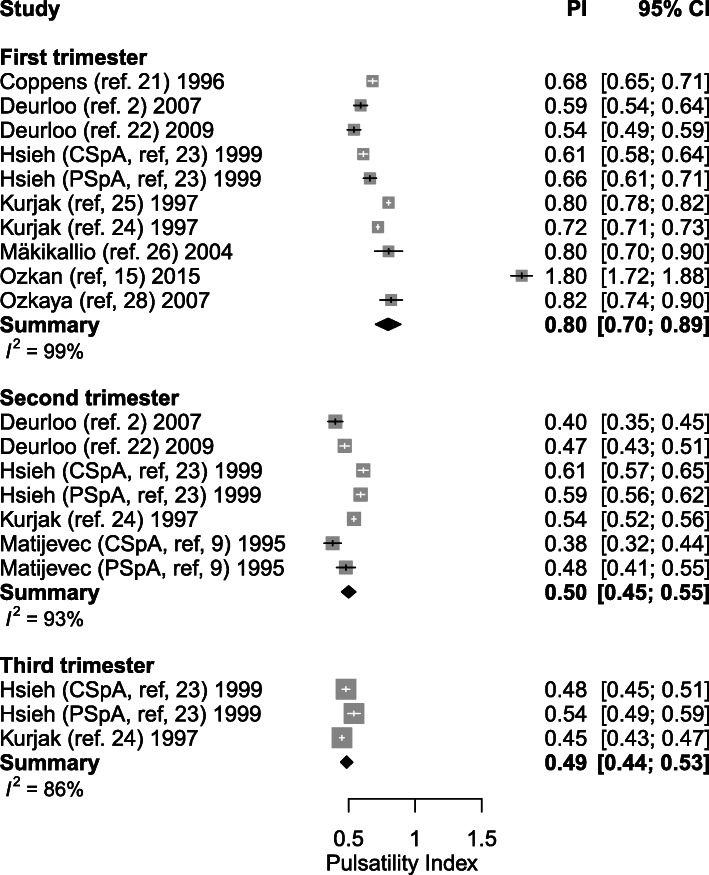
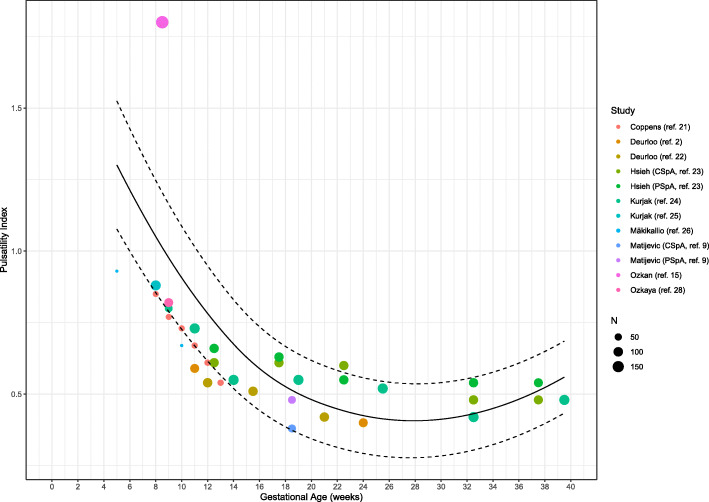
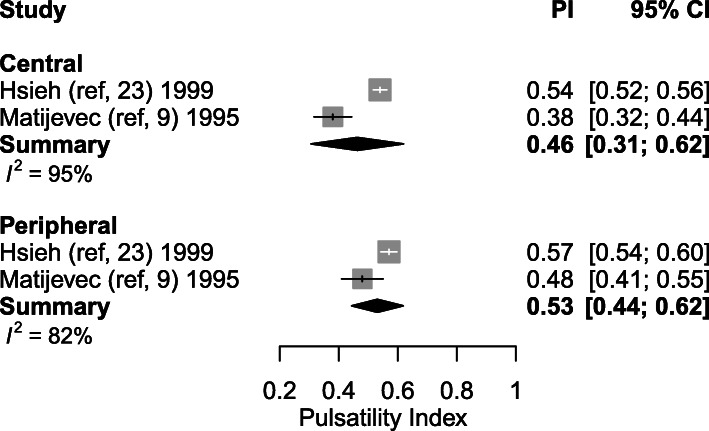
Results: In healthy pregnancies, PI and RI decreased from 0.80 (95% CI: 0.70-0.89) and 0.50 (95% CI: 0.47-0.54) in the first trimester to 0.50 (95% CI: 0.45-0.55, p < 0.001) and 0.39 (95% CI: 0.37-0.42, p < 0.001) in the second trimester and to 0.49 (95% CI: 0.44-0.53, p = 0.752) and 0.36 (95% CI: 0.35-0.38, p = 0.037) in the third trimester, respectively. In parallel, PSV altered from 0.22 m/s (95% CI: 0.13-0.30 m/s) to 0.28 m/s (95% CI: 0.17-0.40 m/s, p = 0.377) and to 0.25 m/s (95% CI: 0.20-0.30 m/s, p = 0.560) in the three trimesters. In absence of second and third trimester Doppler data in complicated gestation, only a difference in PI was observed between complicated and healthy pregnancies during the first trimester (1.49 vs 0.80, p < 0.001). Although individual studies have identified differences in PI between SpA located in the central part of the placental bed versus those located at its periphery, this meta-analysis could not confirm this (p = 0.349).
Conclusions: This review and meta-analysis concludes that an observed decrease of SpA PI and RI from the first towards the second trimester parallels the physiological trophoblast invasion converting SpA during early gestation, a process completed in the midst of the second trimester. Higher PI was found in SpA of complicated pregnancies compared to healthy pregnancies, possibly reflecting suboptimal utero-placental circulation. Longitudinal studies examining comprehensively the predictive value of spiral artery Doppler for complicated pregnancies are yet to be carried out.
Keywords: Adaptation; Doppler; Pregnancy; Remodeling; Spiral artery.
Conflict of interest statement
The authors declare that they have no competing interests.
Figures


References
-
- Deurloo KL, Spreeuwenberg MD, Bolte AC, Van Vugt JM. Color Doppler ultrasound of spiral artery blood flow for prediction of hypertensive disorders and intra uterine growth restriction: a longitudinal study. Prenat Diagn. 2007;27(11):1011–6. - PubMed
-
- Duan J, Chabot-Lecoanet AC, Perdriolle-Galet E, Christov C, Hossu G, Cherifi A, et al. Utero-placental vascularisation in normal and preeclamptic and intra-uterine growth restriction pregnancies: third trimester quantification using 3D power Doppler with comparison to placental vascular morphology (EVUPA): a prospective controlled study. BMJ Open. 2016;6(3):e009909. doi: 10.1136/bmjopen-2015-009909. - DOI - PMC - PubMed
Publication types
MeSH terms
LinkOut - more resources
Full Text Sources
Research Materials
Miscellaneous
