

Trends in health workers' compliance with outpatient malaria case-management guidelines across malaria epidemiological zones in Kenya, 2010-2016
- PMID: 33176783
- PMCID: PMC7659071
- DOI: 10.1186/s12936-020-03479-z
Trends in health workers' compliance with outpatient malaria case-management guidelines across malaria epidemiological zones in Kenya, 2010-2016
Abstract
Background: Health workers' compliance with outpatient malaria case-management guidelines has been improving, specifically regarding the universal testing of suspected cases and the use of artemisinin-based combination therapy (ACT) only for positive results (i.e., 'test and treat'). Whether the improvements in compliance with 'test and treat' guidelines are consistent across different malaria endemicity areas has not been examined.
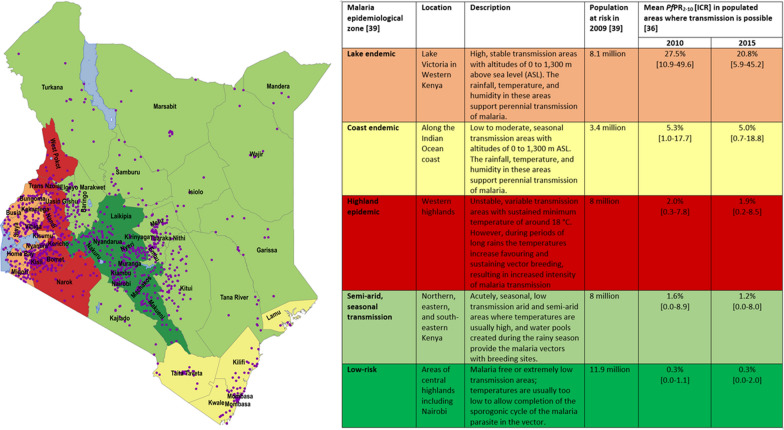
Methods: Data from 11 national, cross-sectional, outpatient malaria case-management surveys undertaken in Kenya from 2010 to 2016 were analysed. Four primary indicators (i.e., 'test and treat') and eight secondary indicators of artemether-lumefantrine (AL) dosing, dispensing, and counselling were measured. Mixed logistic regression models were used to analyse the annual trends in compliance with the indicators across the different malaria endemicity areas (i.e., from highest to lowest risk being lake endemic, coast endemic, highland epidemic, semi-arid seasonal transmission, and low risk).
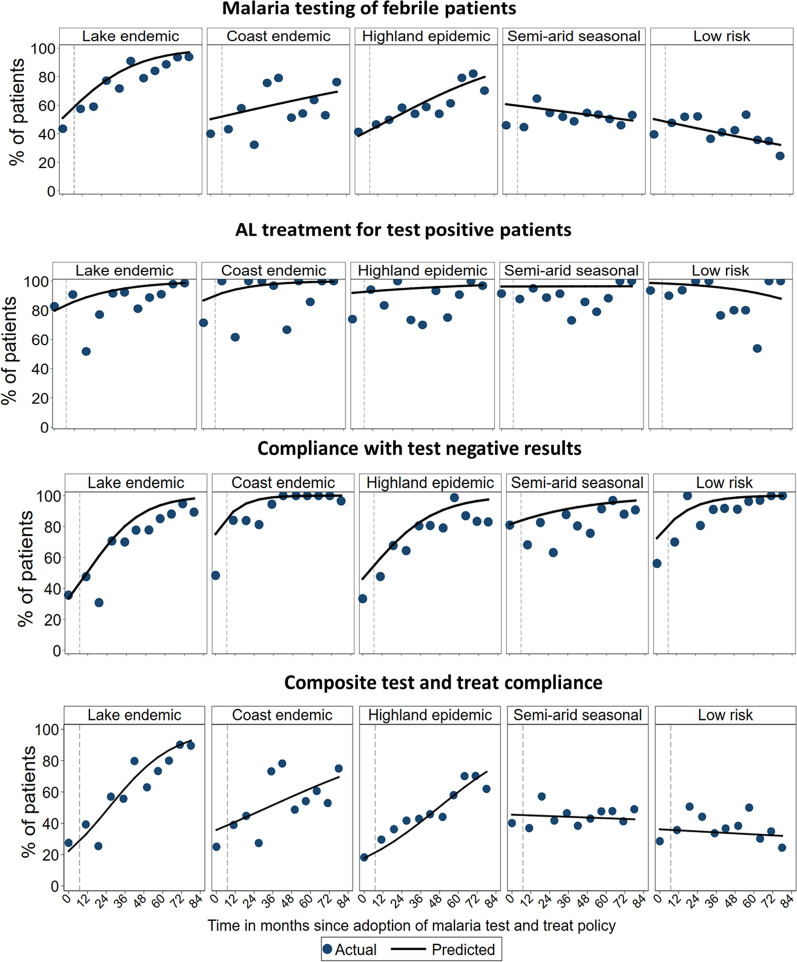
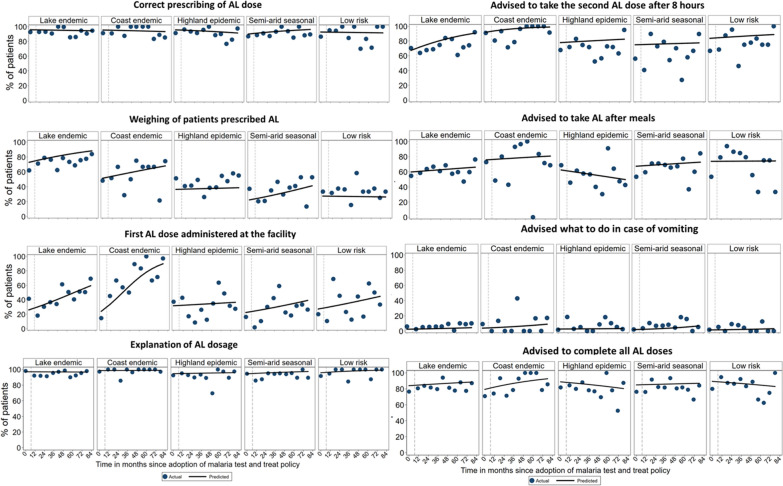
Results: Compliance with all four 'test and treat' indicators significantly increased in the area with the highest malaria risk (i.e., lake endemic) as follows: testing of febrile patients (OR = 1.71 annually; 95% CI = 1.51-1.93), AL treatment for test-positive patients (OR = 1.56; 95% CI = 1.26-1.92), no anti-malarial for test-negative patients (OR = 2.04; 95% CI = 1.65-2.54), and composite 'test and treat' compliance (OR = 1.80; 95% CI = 1.61-2.01). In the low risk areas, only compliance with test-negative results significantly increased (OR = 2.27; 95% CI = 1.61-3.19) while testing of febrile patients showed declining trends (OR = 0.89; 95% CI = 0.79-1.01). Administration of the first AL dose at the facility significantly increased in the areas of lake endemic (OR = 2.33; 95% CI = 1.76-3.10), coast endemic (OR = 5.02; 95% CI = 2.77-9.09) and semi-arid seasonal transmission (OR = 1.44; 95% CI = 1.02-2.04). In areas of the lowest risk of transmission and highland epidemic zone, none of the AL dosing, dispensing, and counselling tasks significantly changed over time.
Conclusions: There is variability in health workers' compliance with outpatient malaria case-management guidelines across different malaria-risk areas in Kenya. Major improvements in areas of the highest risk have not been seen in low-risk areas. Interventions to improve practices should be targeted geographically.
Keywords: Case-management; Compliance; Kenya; Malaria; Malaria endemicity; Outpatient; ‘Test and treat’.
Conflict of interest statement
The authors declare that they have no competing interests.
Figures
References
-
- WHO . World Malaria Report 2019. Geneva: World Health Organization; 2019.
-
- WHO. T3: Test Treat. Track. Scaling up diagnostic testing, treatment and surveillance for malaria. Geneva: World Health Organization; 2012.
-
- WHO . Guidelines for the treatment of malaria. Geneva: World Health Organization; 2010. - PubMed
MeSH terms
Grants and funding
LinkOut - more resources
Full Text Sources
Medical
