. 2020 Nov 11;8(1):192.
doi: 10.1186/s40478-020-01068-4.

In vivo RyR1 reduction in muscle triggers a core-like myopathy

Affiliations

In vivo RyR1 reduction in muscle triggers a core-like myopathy

Laurent Pelletier et al. Acta Neuropathol Commun. .

Abstract

Mutations in the RYR1 gene, encoding the skeletal muscle calcium channel RyR1, lead to congenital myopathies, through expression of a channel with abnormal permeability and/or in reduced amount, but the direct functional whole organism consequences of exclusive reduction in RyR1 amount have never been studied. We have developed and characterized a mouse model with inducible muscle specific RYR1 deletion. Tamoxifen-induced recombination in the RYR1 gene at adult age resulted in a progressive reduction in the protein amount reaching a stable level of 50% of the initial amount, and was associated with a progressive muscle weakness and atrophy. Measurement of calcium fluxes in isolated muscle fibers demonstrated a reduction in the amplitude of RyR1-related calcium release mirroring the reduction in the protein amount. Alterations in the muscle structure were observed, with fibers atrophy, abnormal mitochondria distribution and membrane remodeling. An increase in the expression level of many proteins was observed, as well as an inhibition of the autophagy process. This model demonstrates that RyR1 reduction is sufficient to recapitulate most features of Central Core Disease, and accordingly similar alterations were observed in muscle biopsies from Dusty Core Disease patients (a subtype of Central Core Disease), pointing to common pathophysiological mechanisms related to RyR1 reduction.

Keywords: Calcium; Central core disease; Congenital myopathies; Dusty core disease; Excitation–contraction coupling; Mouse model; Ryanodine receptor; Skeletal muscle.


Conflict of interest statement

The authors declare that they have no competing interests.

Figures
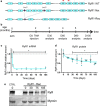
Fig. 1
Fig. 1
RyR1 mRNA and protein decrease after tamoxifen injection in the RyR1Flox/Flox::HSA-Cre-ERT2 mouse model. a LoxP sites were inserted on both sides of exons 9-11 in the RyR1 WT allele to create the RyR1-flox allele. After recombination, the RyR1-Rec allele is deleted with exons 9-11. The primers used for the RT-q-PCR amplification of RyR1 transcript of panel care represented by the red arrows respectively in exon 103 and 104. b The animals were injected with tamoxifen to induce the recombination at 2 months of age (D0), and were analyzed at variable times thereafter. c The relative amount of mRNA compared to beta-actin, HPRT and GAPDH as reference genes were evaluated using RT-q-PCR in quadriceps muscles of n = 3–6 different mice at each time point, and is presented as mean ± SEM for each time. The amount in CTRL littermate was set to 1. The quantification was performed using the ∆∆Ct method. Statistical analysis: One way ANOVA with Holm–Sidack’s test for multiple comparisons. d The relative amount of RyR1 compared to myosin heavy chain was evaluated using quantitative Western blot in quadriceps homogenates of n = 3–6 different mice at each time point. The initial amount was set to 1. e Representative Western blot of RyR1 on CTRL and RyR1-Rec quadriceps homogenates at different time points, using myosin heavy chain as a control of protein amount. Statistical analysis: One way ANOVA with Holm-Sidack’s test for multiple comparisons
Fig. 2
Fig. 2
RyR1-Rec mice show progressive reduction in muscle and body weights and in muscle strength. a Body weight and b Muscle strength estimated as a function of time after recombination using a grip test in which the time the animals can hang upside down on a grid up to 5 min (300 s). Data are mean ± SEM of n = 10-15 animals in each group, * p < 0.05 Student’s t test with Holm-Sidack’s correction for multiple comparisons. c Recording of the tension developed by gastrocnemius during a 6 min electrostimulation protocol at 2 Hz. Longitudinal study of the same animals (CRTL, left panel, and RyR1-Rec, right panel) at different times after recombination, 30 days (D30), 60 days (D60) and 90 days (D90). Data are mean ± SEM of n = 8 CRTL and n = 6 RyR1-Rec animals. d Gastrocnemius muscle volume for CTRL (n = 8) and RyR1-Rec (n = 6) mice at 30, 60 and 90 days after recombination. Data are mean ± SEM. Statistical analysis: post hoc LSD Fisher test following two-way repeated measures ANOVA, *significantly different from CTRL at the same time, asignificantly different from D30 in the same group, bsignificantly different from D60 in the same group. e Maximal specific twitch tension (maximal twitch tension normalized to the gastrocnemius volume). Statistical analysis: post hoc LSD Fisher test following two-way repeated measures ANOVA *significantly different from CTRL at the same time, asignificantly different from D30 in the same group, bsignificantly different from D60 in the same group
Fig. 3
Fig. 3
Excitation-contraction coupling in single isolated muscle fibers is altered. All values are mean ± SEM. Statistical significance was determined using a Student’s t-test. a Representative confocal images of T-tubule network stained with di-8-anepps from a CTRL and a RyR1-Rec fiber, allowing evaluation of T-tubule density and sarcomere length, performed in 42 CTRL fibers and 41 RyR1-Rec fibers (4 mice in each group). b Representative DHPR Ca2+ current from a CTRL and a RyR1-Rec fiber in response to 0.5 s-long depolarizing steps to the indicated levels (10 mV increment). c Voltage-dependence of the peak DHPR Ca2+ current density. d Parameters obtained from the fit of curves c in 29 CTRL fibers and 30 RyR1-Rec fibers (5 mice in each group), (cf Additional file 1: Supp. Method). e Representative x,t images of rhod-2 fluorescence (a.u.) from a CTRL and a RyR1-Rec fiber stimulated by a voltage-clamp depolarizing pulse to − 10 mV. f Representative line-averaged rhod-2 Ca2+ transients from a CTRL and from a RyR1-Rec fiber in response to voltage-clamp pulses to the indicated levels. g Rate of SR Ca2+ release calculated from the curves shown in f. h Voltage-dependence of the peak rate of SR Ca2+ release (top) and of the time-to-peak rate of SR Ca2+ release (bottom). i Parameters obtained from fitting the peak rate of SR Ca2+ release vs voltage relationship with a Boltzmann function in each fiber (cf Additional file 1: Supplementary Method). Data are from the same fibers as in bd
Fig. 4
Fig. 4
Histological and immunofluorescent analyses show major defects in muscles. a TA Transversal section from CTRL and RyR1-Rec mice at D75 were stained with hematoxylin/eosin (H&E) and NADH. The mitochondria localization (NADH staining) is inhomogeneous in RyR1-Rec fibers, specifically in the small dark type I (slow) fibers with high mitochondria content (arrow head and inset). The nuclei (blue dots with H&E staining) are at the periphery of the fibers, and no evidence of regenerative fiber can be seen. Bar 50 µm. b Transversal TA sections from D75 CTRL and RyR1-Rec mice were stained with antibodies against RyR1 (green) and desmin (red). Bar 50 µm, and 10 µm in inset
Fig. 5
Fig. 5
A generalized structural disorganization is observed in EDL muscle fibers. a EDL fibers from D75 CTRL and RyR1-Rec mice were stained with antibodies against RyR1 (green), triadin (red) and alpha-actinin (white). Bar 10 µm and 2 µm in inset. b Electron microscopy analysis of longitudinal EDL section of D75 RyR1-Rec mice. The upper left fiber has a normal structure, the adjacent lower fiber is extremely disorganized, with large stacks of membranes (up to 15 stacks, arrows) extending on few µm long. The inset presents two multiple triads, on the left one the membranes corresponding to T-tubules have been colored with light yellow and the SR sheets with light blue to allow a better visualization. Some electron dense material can be seen within the SR segment, all along the contact site with the adjacent T-tubule, which could correspond to accumulation of proteins. Bars 1 µm
Fig. 6
Fig. 6
Quantitative Western blot analysis of the proteins expressed in quadriceps muscles of D75 mice demonstrates an increase in expression of many proteins. a Representative Western blots for each protein on D75 quadriceps homogenates from 2 different CTRL (C) and 2 RyR1-Rec (R) mice. b Quantification of the amount of each protein normalized to the total amount of proteins on 8 different animals in each group (CTRL, back bars and RyR1-Rec, blue bars). The value for each animal is the mean of at least 3 blots. All the data are presented as mean ± SEM. The mean value in the CTRL group was set to 1 for each protein. Statistical analysis: t test with Holm-Sidak method for multiple comparisons
Fig. 7
Fig. 7
Autophagy is inhibited in RyR1-Rec D75 mice quadriceps muscle. a, c Representative Western blot on 4 CTRL and 4 RyR-Rec quadriceps muscle homogenates. b Quantification of the amount of protein normalized to the amount of GAPDH in 8–12 mice in each group (CTRL, black bars; RyR1-Rec, blue bars). For S6 and mTOR, the values are presented as ratio of the phosphorylated/non-phosphorylated protein. The value for each animal is the mean of at least 3 blots. All the data are presented as mean ± SEM. The mean value in the CTRL group was set to 1 for each protein. Statistical analysis: t test with Holm-Sidak method for multiple comparisons
Fig. 8
Fig. 8
Analysis of human patients’ biopsies reveals similar defects to those observed in RyR1-Rec mice. a Representative Western blot performed on muscle homogenate from human biopsies. C1: control, 23 years, female; C2: control, 3.5 years, male; P1: CCD (Dusty core), mutations p.M2423K + p.R2441*, 43 years, male; P2: CCD (Dusty core), mutations p.T4709M + p.R1409*, 4 years, male; P3: CCD (Dusty core), mutations p.[Ile1571Val; Arg3366His; Tyr3933Cys] + p.Val788Cysfs*96, 25 years, female; P4: CCD (Dusty Core), mutations p.R2140W + p.L4828R, 9 years, female; P5: CCD (Dusty Core), mutations p.M4000del + p.Met2312Cysfs*118, 28 years, female. b Quantification of protein amount, normalized to myosin (for RyR1, CLIMP63 and Desmin) or to GAPDH (for p62). Data are presented as mean ± SEM of 10 controls samples (CTRL) and of 5 patients’ samples (patients). The value for each patient is the mean of at least 2 Western blots. The mean value for each protein in CTRL samples was set to 1. RyR1 expression level compared to controls: P1—26 ± 6%, P2—14 ± 6%, P3—20 ± 3%, P4—23 ± 3%, P5—16 ± 2%. CLIMP63 expression level compared to control: P1—130% ± 12%, P2—1372% ± 385%, P3—466% ± 92%, P4—262% ± 35%, P5—350% ± 85%). Desmin expression level compared to control: P1—47,789% ± 6097%; P2—10,052% ± 2957%; P3—36,745% ± 7150%; P4—14,951% ± 5584%; P5—11,307% ± 2858%. Student t test RyR1 p < 0.001, CLIMP63 p = 0.016, Desmin p < 0.001 c Electron microscopy pictures obtained during the course of the diagnosis, presenting multiples stacks of membranes in the disorganized core region of the biopsies of patients P2 and P5. Similar structures were identified in the muscle biopsies of the five patients. Bar 1 µm

References

    1. Marty I, Robert M, Villaz M, Lai Y, De Jongh KS, Catterall WA, et al. Biochemical evidence for a complex involving dihydropyridine receptor and ryanodine receptor in triad junctions of skeletal muscle. Proc Natl Acad Sci USA. 1994;91:2270–2274. doi: 10.1073/pnas.91.6.2270. - DOI - PMC - PubMed
    1. Zhang L, Kelley J, Schmeisser G, Kobayashi YM, Jones LR. Complex formation between junctin, triadin, calsequestrin, and the ryanodine receptor. Proteins of the cardiac junctional sarcoplasmic reticulum membrane. J Biol Chem. 1997;272:23389–23397. doi: 10.1074/jbc.272.37.23389. - DOI - PubMed
    1. Dirksen RT, Avila G. Altered ryanodine receptor function in central core disease: leaky or uncoupled Ca(2+) release channels? Trends Cardiovasc Med. 2002;12:189–197. doi: 10.1016/s1050-1738(02)00163-9. - DOI - PubMed
    1. Betzenhauser MJ, Marks AR. Ryanodine receptor channelopathies. Pflugers Arch. 2010;460:467–480. doi: 10.1007/s00424-010-0794-4. - DOI - PMC - PubMed
    1. Lanner JT, Georgiou DK, Joshi AD, Hamilton SL. Ryanodine receptors: structure, expression, molecular details, and function in calcium release. Cold Spring Harb Perspect Biol. 2010;2:a003996. doi: 10.1101/cshperspect.a003996. - DOI - PMC - PubMed

Publication types

MeSH terms

Substances

LinkOut - more resources