

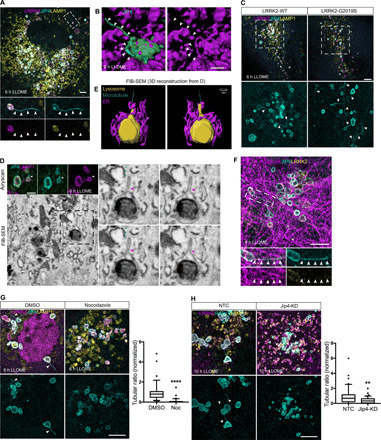
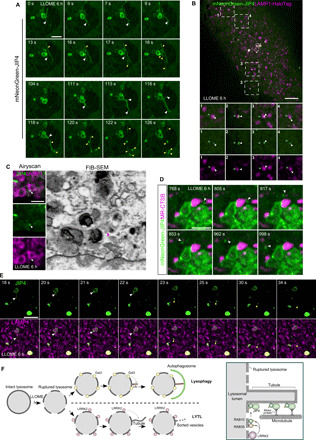
LRRK2 mediates tubulation and vesicle sorting from lysosomes
- PMID: 33177079
- PMCID: PMC7673727
- DOI: 10.1126/sciadv.abb2454
LRRK2 mediates tubulation and vesicle sorting from lysosomes
Abstract
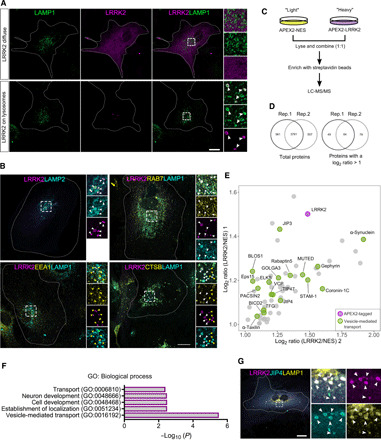
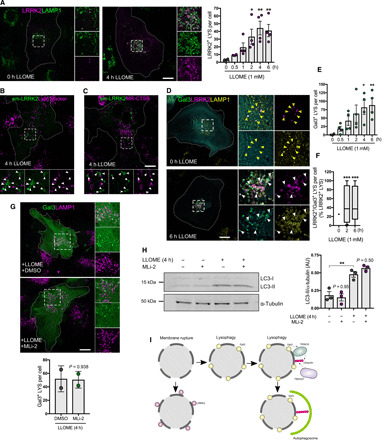
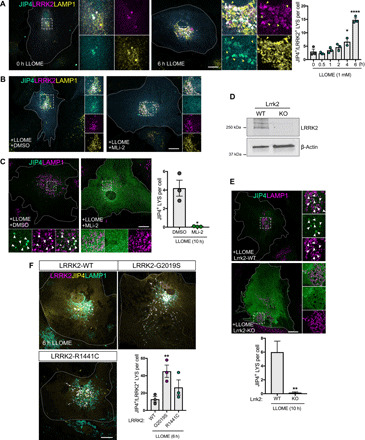
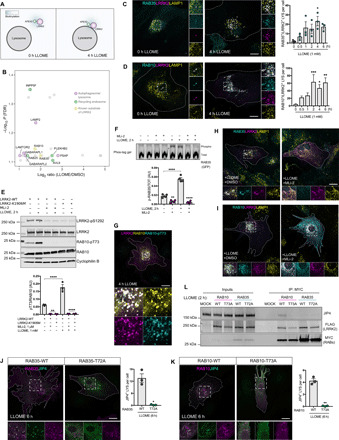
Genetic variation around the LRRK2 gene affects risk of both familial and sporadic Parkinson's disease (PD). However, the biological functions of LRRK2 remain incompletely understood. Here, we report that LRRK2 is recruited to lysosomes after exposure of cells to the lysosome membrane-rupturing agent LLOME. Using an unbiased proteomic screen, we identified the motor adaptor protein JIP4 as an LRRK2 partner at the lysosomal membrane. LRRK2 can recruit JIP4 to lysosomes in a kinase-dependent manner via the phosphorylation of RAB35 and RAB10. Using super-resolution live-cell imaging microscopy and FIB-SEM, we demonstrate that JIP4 promotes the formation of LAMP1-negative tubules that release membranous content from lysosomes. Thus, we describe a new process orchestrated by LRRK2, which we name LYTL (LYsosomal Tubulation/sorting driven by LRRK2), by which lysosomal tubulation is used to release vesicles from lysosomes. Given the central role of the lysosome in PD, LYTL is likely to be disease relevant.
Copyright © 2020 The Authors, some rights reserved; exclusive licensee American Association for the Advancement of Science. No claim to original U.S. Government Works. Distributed under a Creative Commons Attribution NonCommercial License 4.0 (CC BY-NC).
Figures
References
-
- Paisán-Ruíz C., Jain S., Evans E. W., Gilks W. P., Simón J., van der Brug M., López de Munain A., Aparicio S., Gil A. M., Khan N., Johnson J., Martinez J. R., Nicholl D., Martí Carrera I., Pena A. S., de Silva R., Lees A., Martí-Massó J. F., Pérez-Tur J., Wood N. W., Singleton A. B., Cloning of the gene containing mutations that cause PARK8-linked Parkinson’s disease. Neuron 44, 595–600 (2004). - PubMed
-
- Lesage S., Leutenegger A.-L., Ibanez P., Janin S., Lohmann E., Dürr A., Brice A.; French Parkinson’s Disease Genetics Study Group , LRRK2 haplotype analyses in European and North African families with Parkinson disease: A common founder for the G2019S mutation dating from the 13th century. Am. J. Hum. Genet. 77, 330–332 (2005). - PMC - PubMed
-
- Chang D., Nalls M. A., Hallgrímsdóttir I. B., Hunkapiller J., van der Brug M., Cai F.; International Parkinson’s Disease Genomics Consortium; 23andMe Research Team, Kerchner G. A., Ayalon G., Bingol B., Sheng M., Hinds D., Behrens T. W., Singleton A. B., Bhangale T. R., Graham R. R., A meta-analysis of genome-wide association studies identifies 17 new Parkinson’s disease risk loci. Nat. Genet. 49, 1511–1516 (2017). - PMC - PubMed
-
- Nalls M. A., Blauwendraat C., Vallerga C. L., Heilbron K., Bandres-Ciga S., Chang D., Tan M., Kia D. A., Noyce A. J., Xue A., Bras J., Young E., von Coelln R., Simón-Sánchez J., Schulte C., Sharma M., Krohn L., Pihlstrøm L., Siitonen A., Iwaki H., Leonard H., Faghri F., Gibbs J. R., Hernandez D. G., Scholz S. W., Botia J. A., Martinez M., Corvol J.-C., Lesage S., Jankovic J., Shulman L. M., Sutherland M., Tienari P., Majamaa K., Toft M., Andreassen O. A., Bangale T., Brice A., Yang J., Gan-Or Z., Gasser T., Heutink P., Shulman J. M., Wood N. W., Hinds D. A., Hardy J. A., Morris H. R., Gratten J., Visscher P. M., Graham R. R., Singleton A. B.; 23andMe Research Team; System Genomics of Parkinson’s Disease Consortium; International Parkinson’s Disease Genomics Consortium , Identification of novel risk loci, causal insights, and heritable risk for Parkinson’s disease: A meta-analysis of genome-wide association studies. Lancet Neurol. 18, 1091–1102 (2019). - PMC - PubMed
-
- Greggio E., Jain S., Kingsbury A., Bandopadhyay R., Lewis P., Kaganovich A., van der Brug M. P., Beilina A., Blackinton J., Thomas K. J., Ahmad R., Miller D. W., Kesavapany S., Singleton A., Lees A., Harvey R. J., Harvey K., Cookson M. R., Kinase activity is required for the toxic effects of mutant LRRK2/dardarin. Neurobiol. Dis. 23, 329–341 (2006). - PubMed
Publication types
MeSH terms
Substances
LinkOut - more resources
Full Text Sources
Other Literature Sources
Molecular Biology Databases
Research Materials
Miscellaneous
