

Seroprevalence of anti-SARS-CoV-2 IgG antibodies in Kenyan blood donors
- PMID: 33177105
- PMCID: PMC7877494
- DOI: 10.1126/science.abe1916
Seroprevalence of anti-SARS-CoV-2 IgG antibodies in Kenyan blood donors
Abstract
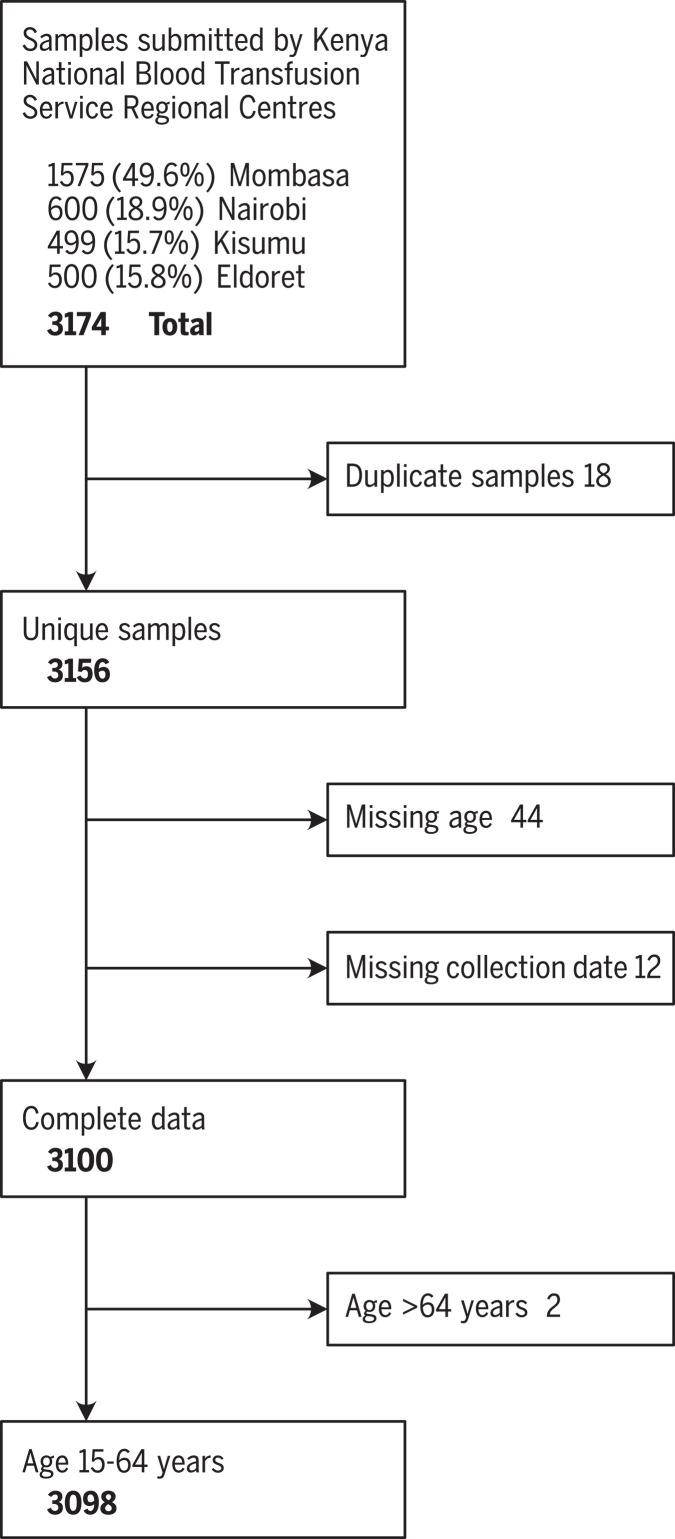
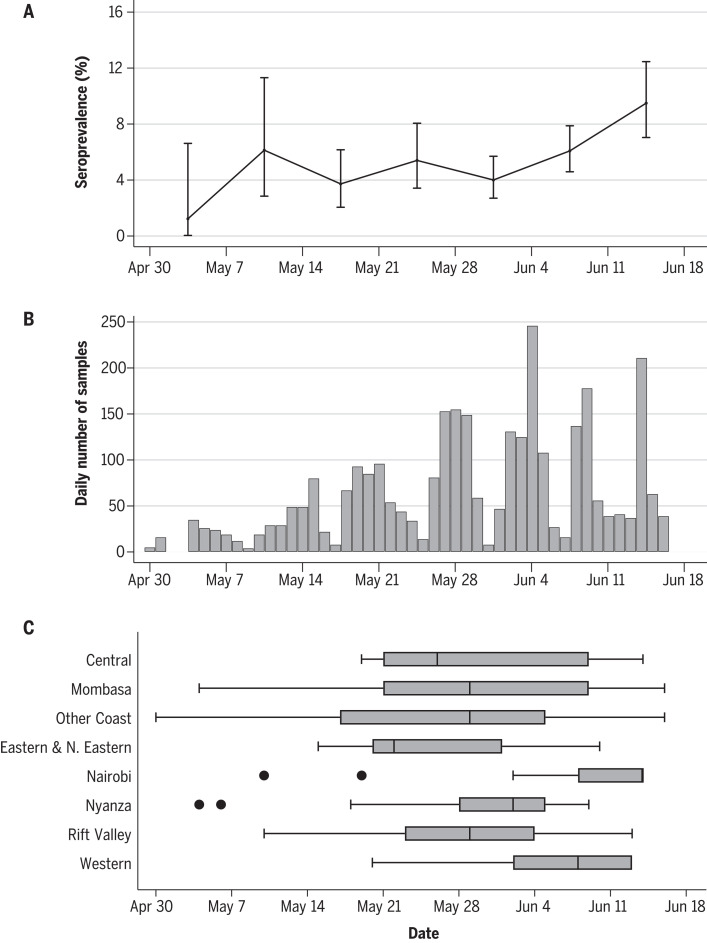
The spread of severe acute respiratory syndrome coronavirus 2 (SARS-CoV-2) in Africa is poorly described. The first case of SARS-CoV-2 in Kenya was reported on 12 March 2020, and an overwhelming number of cases and deaths were expected, but by 31 July 2020, there were only 20,636 cases and 341 deaths. However, the extent of SARS-CoV-2 exposure in the community remains unknown. We determined the prevalence of anti-SARS-CoV-2 immunoglobulin G among blood donors in Kenya in April-June 2020. Crude seroprevalence was 5.6% (174 of 3098). Population-weighted, test-performance-adjusted national seroprevalence was 4.3% (95% confidence interval, 2.9 to 5.8%) and was highest in urban counties Mombasa (8.0%), Nairobi (7.3%), and Kisumu (5.5%). SARS-CoV-2 exposure is more extensive than indicated by case-based surveillance, and these results will help guide the pandemic response in Kenya and across Africa.
Copyright © 2021, American Association for the Advancement of Science.
Figures
Comment in
-
The puzzle of the COVID-19 pandemic in Africa.Science. 2021 Jan 1;371(6524):27-28. doi: 10.1126/science.abf8832. Science. 2021. PMID: 33384364 No abstract available.
References
-
- United Nations Department of Economic and Social Affairs Population Division, “World Urbanization Prospects: The 2018 Revision,” custom data acquired via (2018); https://population.un.org/wup/DataQuery.
-
- Africa Centres for Diseases Control and Prevention, “Coronavirus Disease 2019 (COVID-19)” (2020); https://africacdc.org/covid-19[accessed 21 July 2020].
-
- Ministry of Health Kenya, “Press Statement on the update of the coronavirus in the country and response measures” (2020); www.health.go.ke/wp-content/uploads/2020/03/Coronavirus-Press-Statement-....
Publication types
MeSH terms
Substances
Grants and funding
LinkOut - more resources
Full Text Sources
Other Literature Sources
Medical
Miscellaneous
