. 2021 Oct;70(10):1933-1945.
doi: 10.1136/gutjnl-2020-321548. Epub 2020 Nov 11.

ATF4 activation promotes hepatic mitochondrial dysfunction by repressing NRF1-TFAM signalling in alcoholic steatohepatitis

Affiliations

ATF4 activation promotes hepatic mitochondrial dysfunction by repressing NRF1-TFAM signalling in alcoholic steatohepatitis

Liuyi Hao et al. Gut. 2021 Oct.

Abstract

Objective: Mitochondrial dysfunction plays a dominant role in the pathogenesis of alcoholic liver disease (ALD); however, the underlying mechanisms remain to be fully understood. We previously found that hepatic activating transcription factor 4 (ATF4) activation was associated with mitochondrial dysfunction in ALD. This study aimed to investigate the function and mechanism of ATF4 in alcohol-induced hepatic mitochondrial dysfunction.

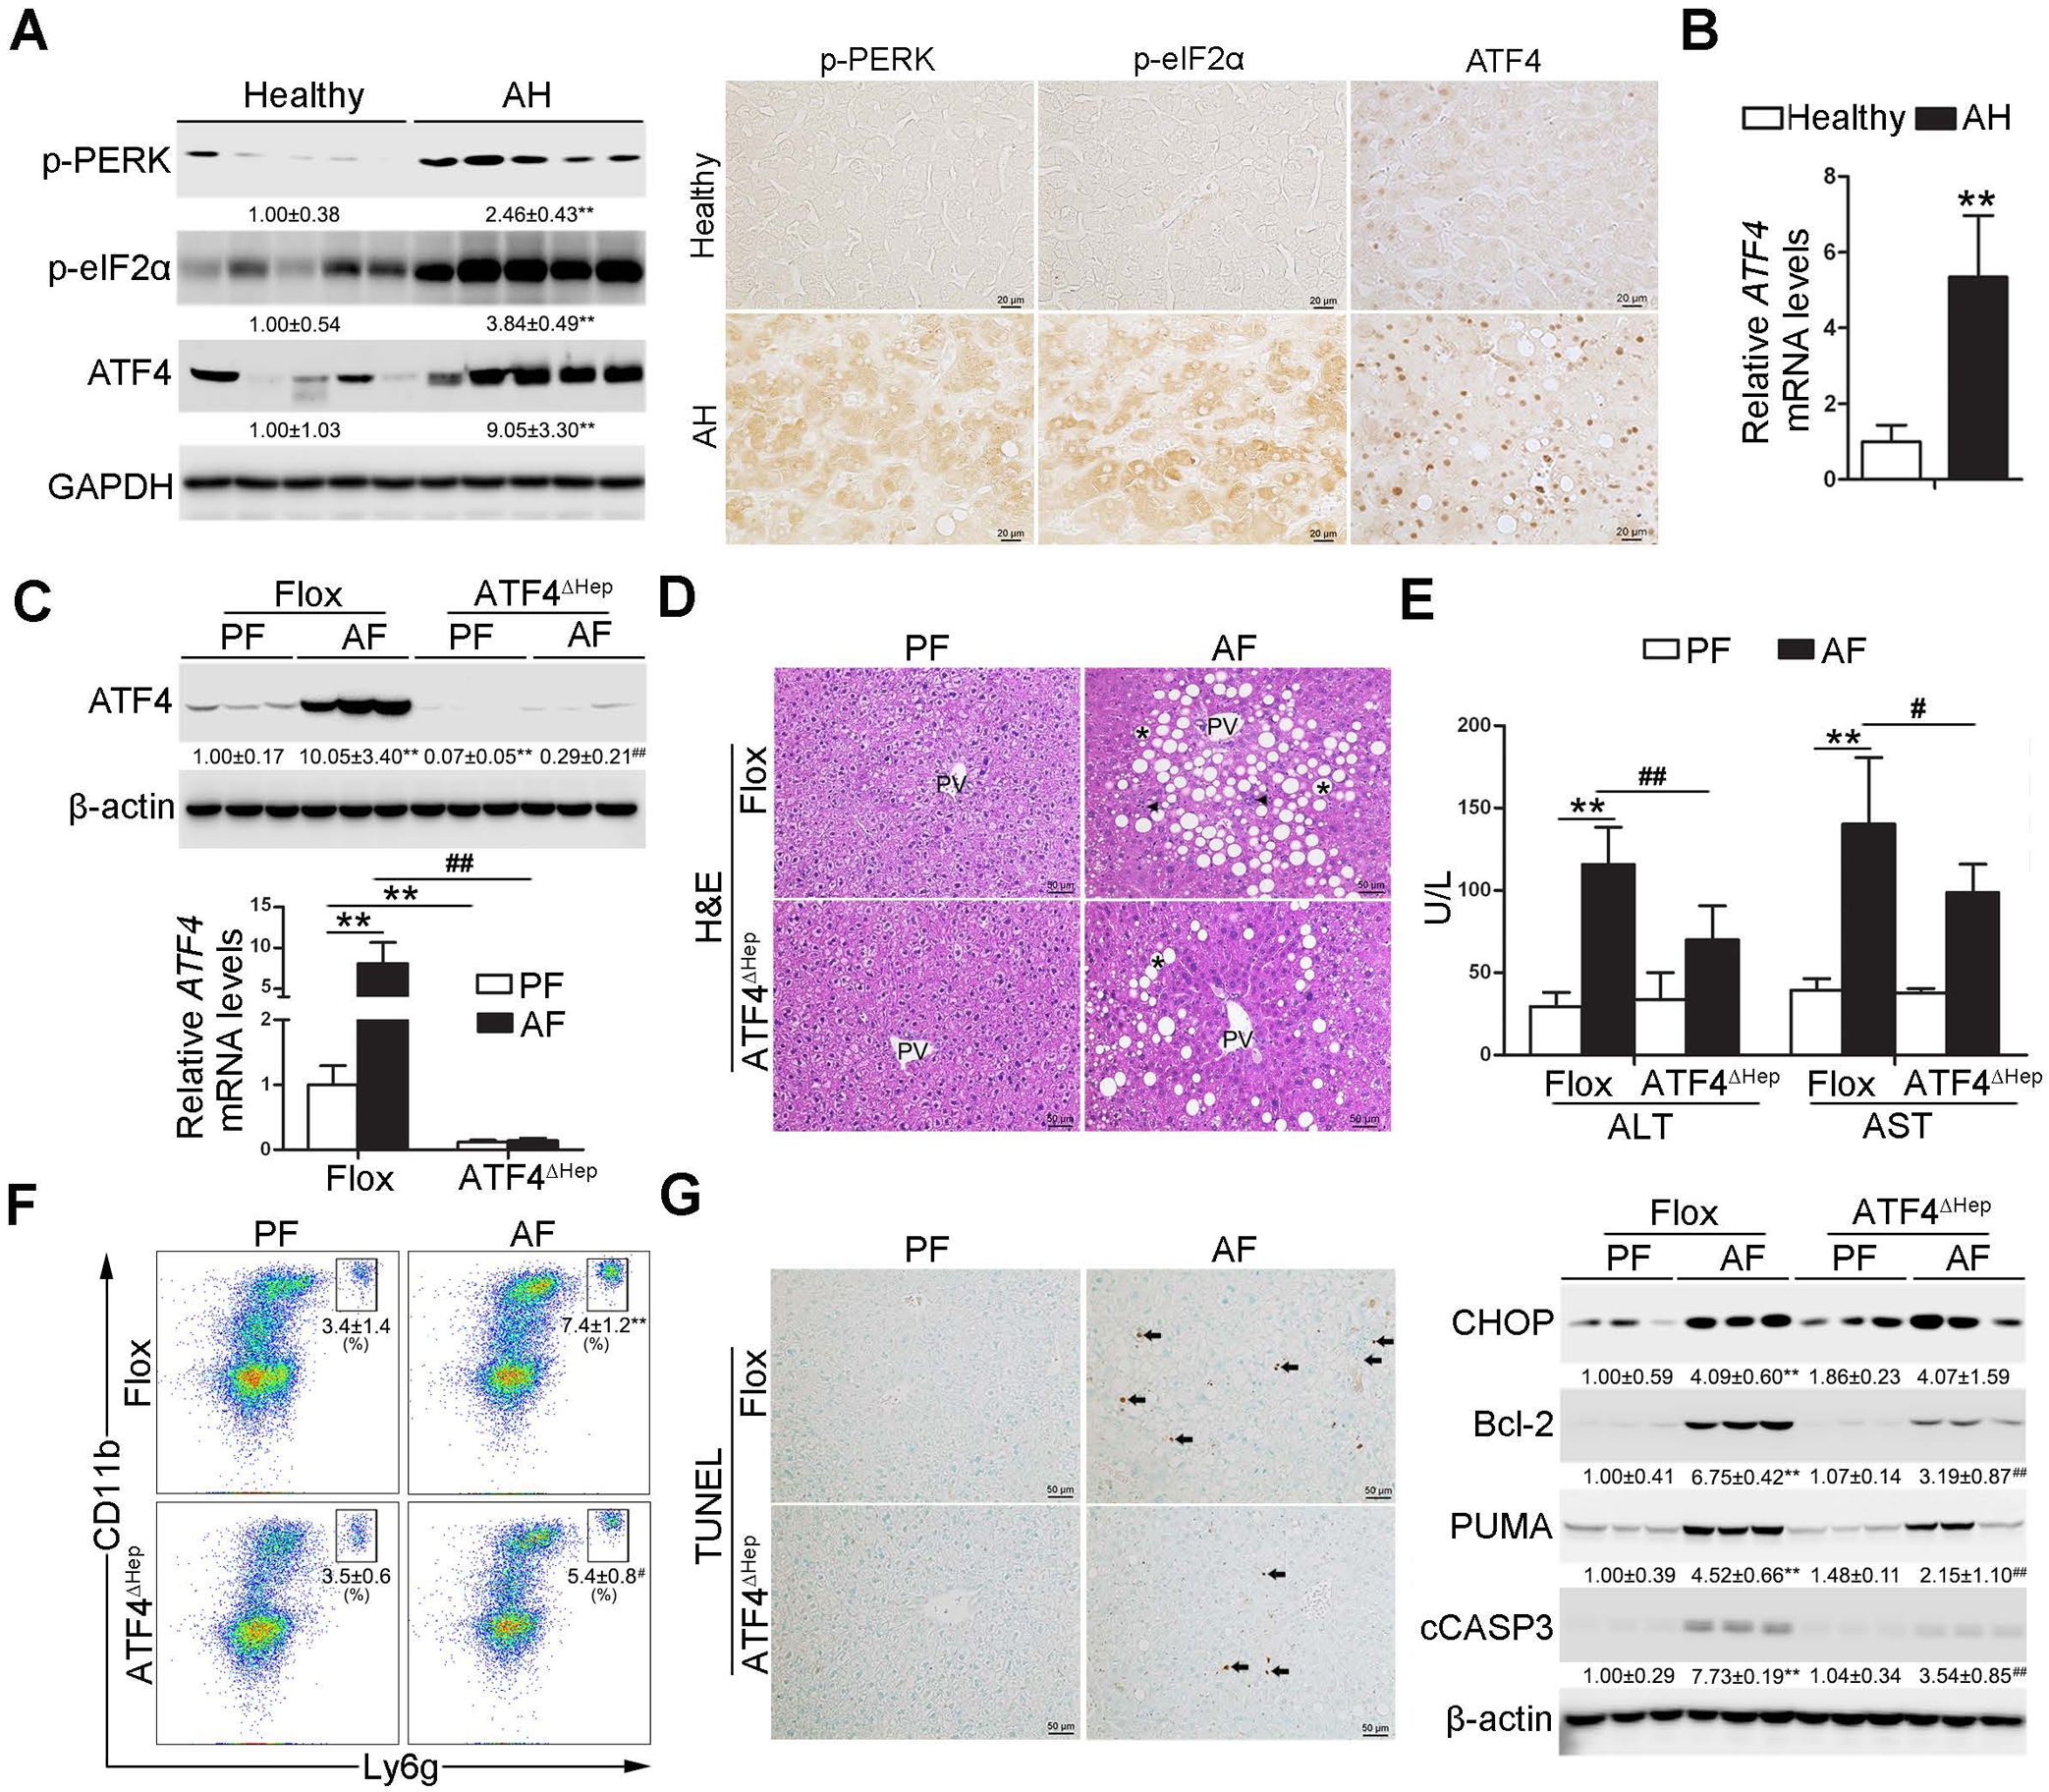
Design: ATF4 activation was detected in the livers of patients with severe alcoholic hepatitis (AH). The role of ATF4 and mitochondrial transcription factor A (TFAM) in alcohol-induced liver damage was determined in hepatocyte-specific ATF4 knockout mice and liver-specific TFAM overexpression mice, respectively.

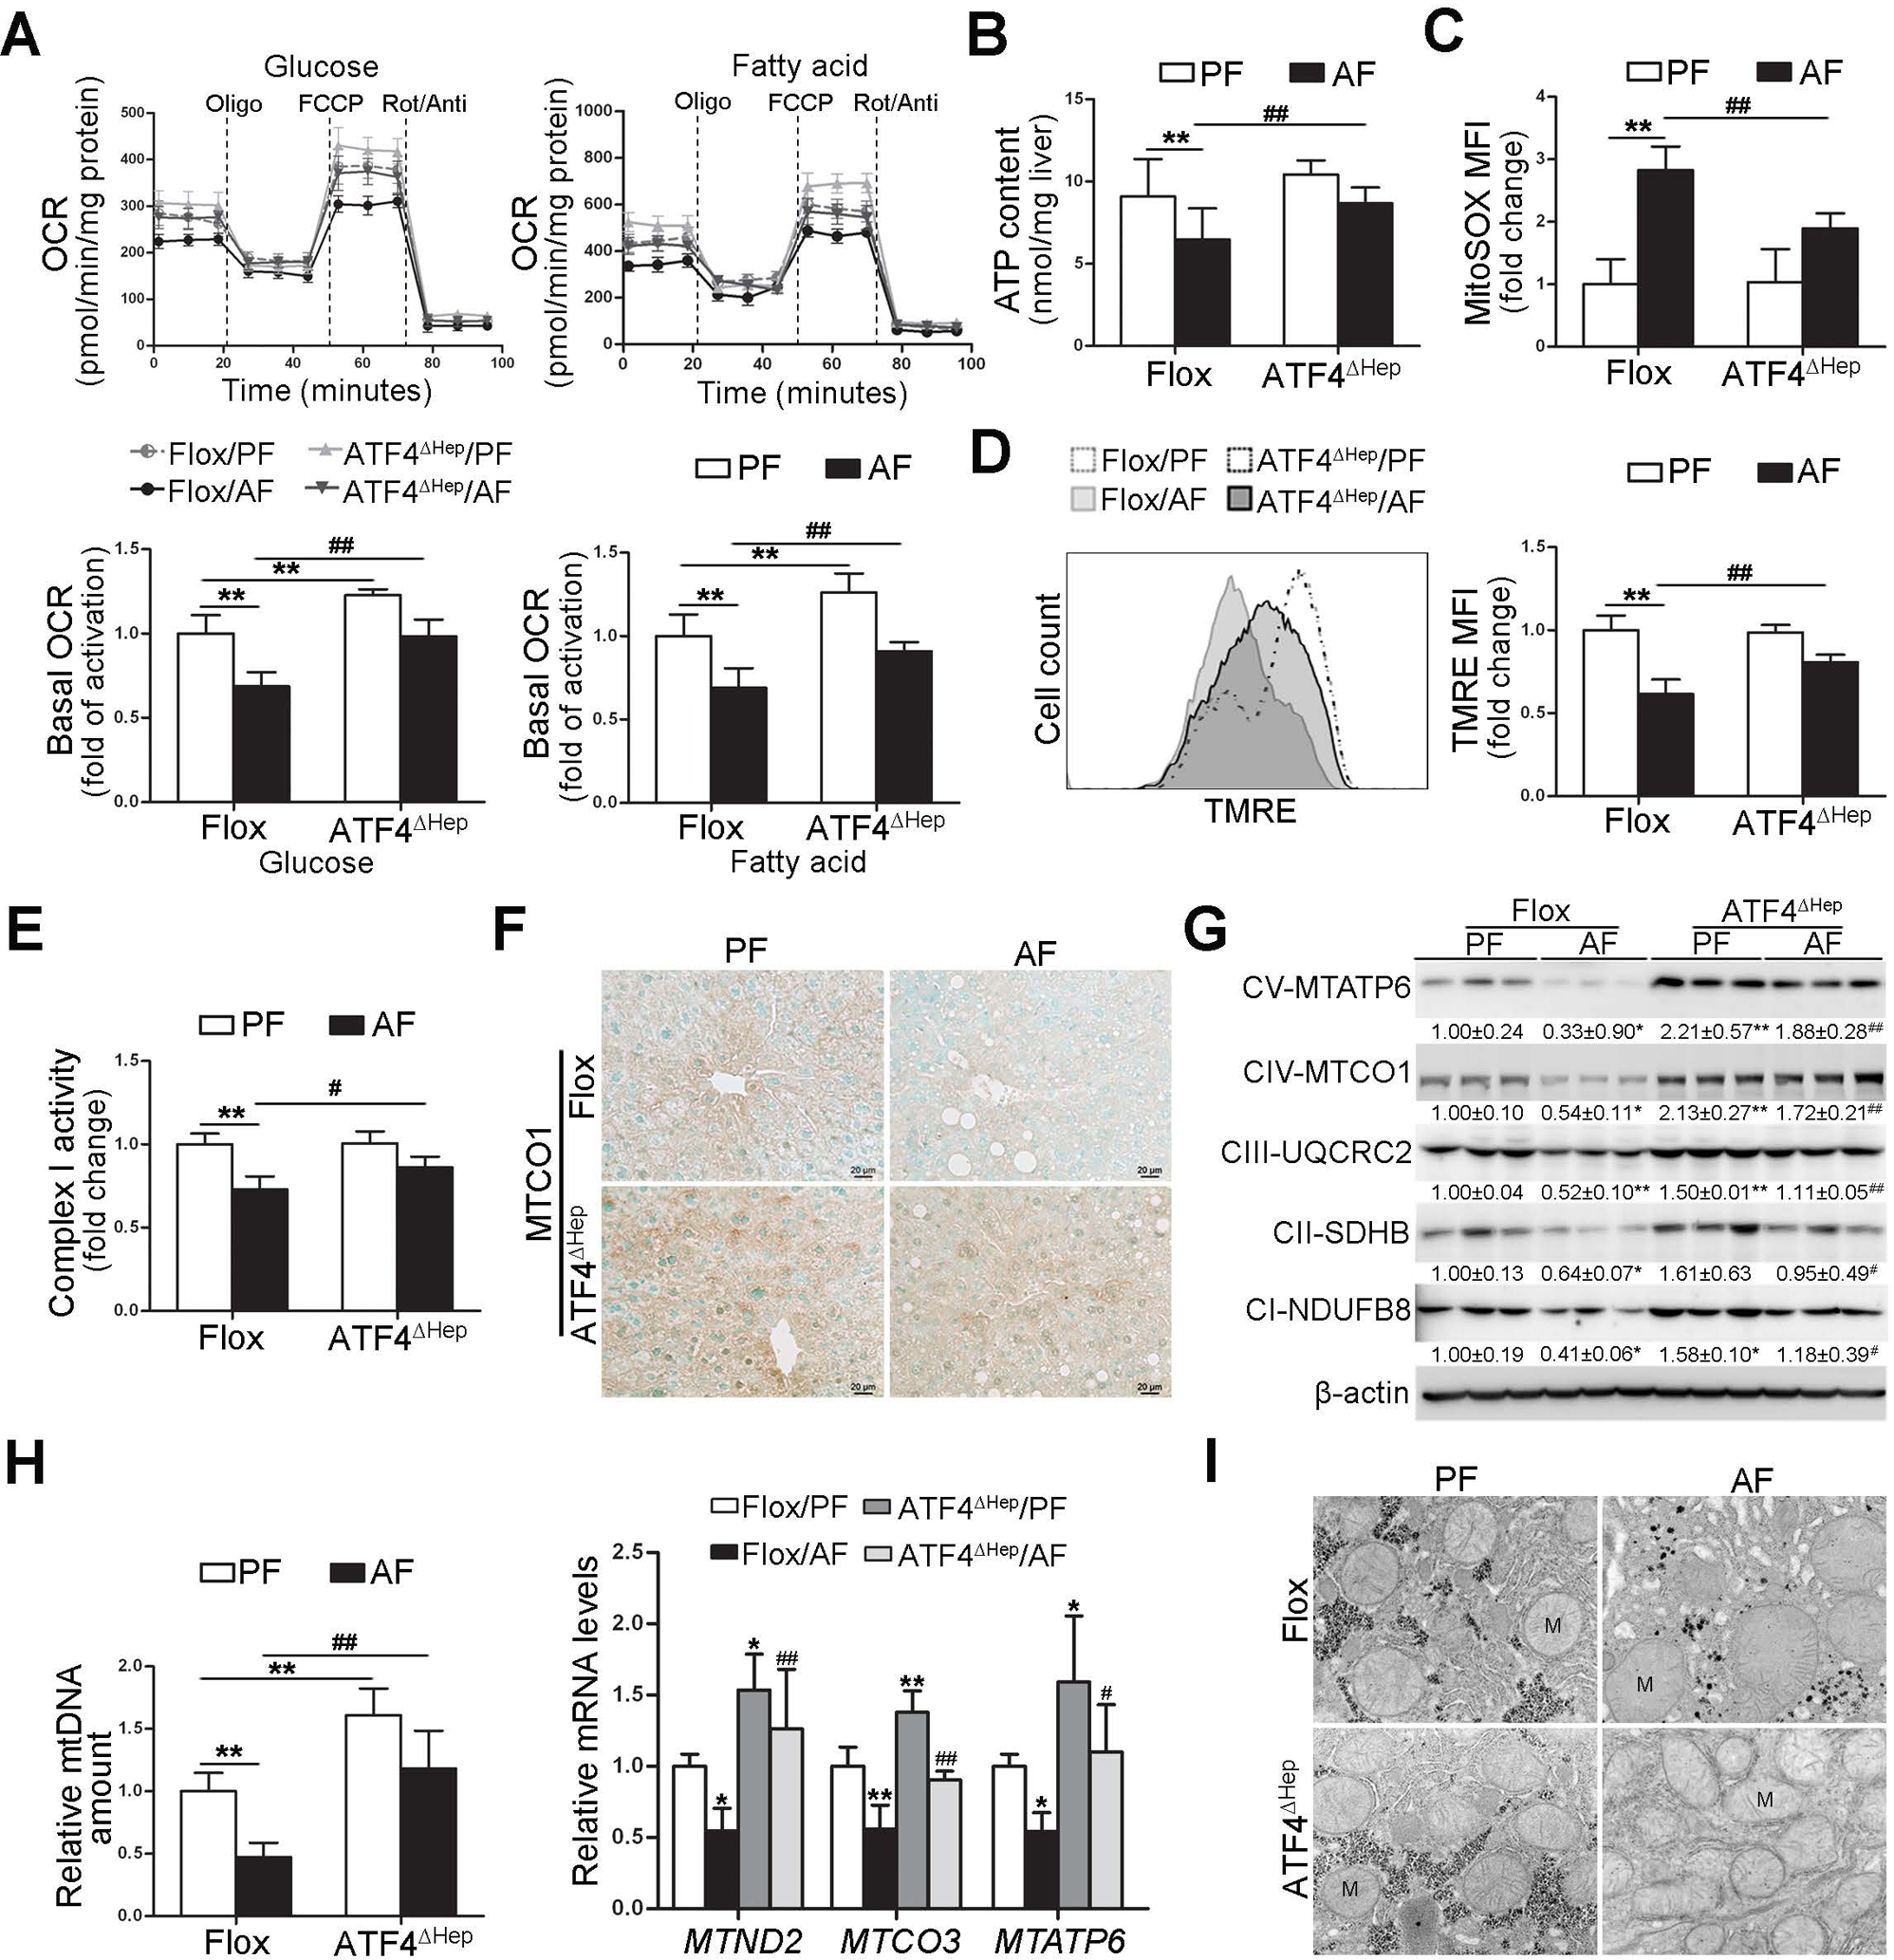
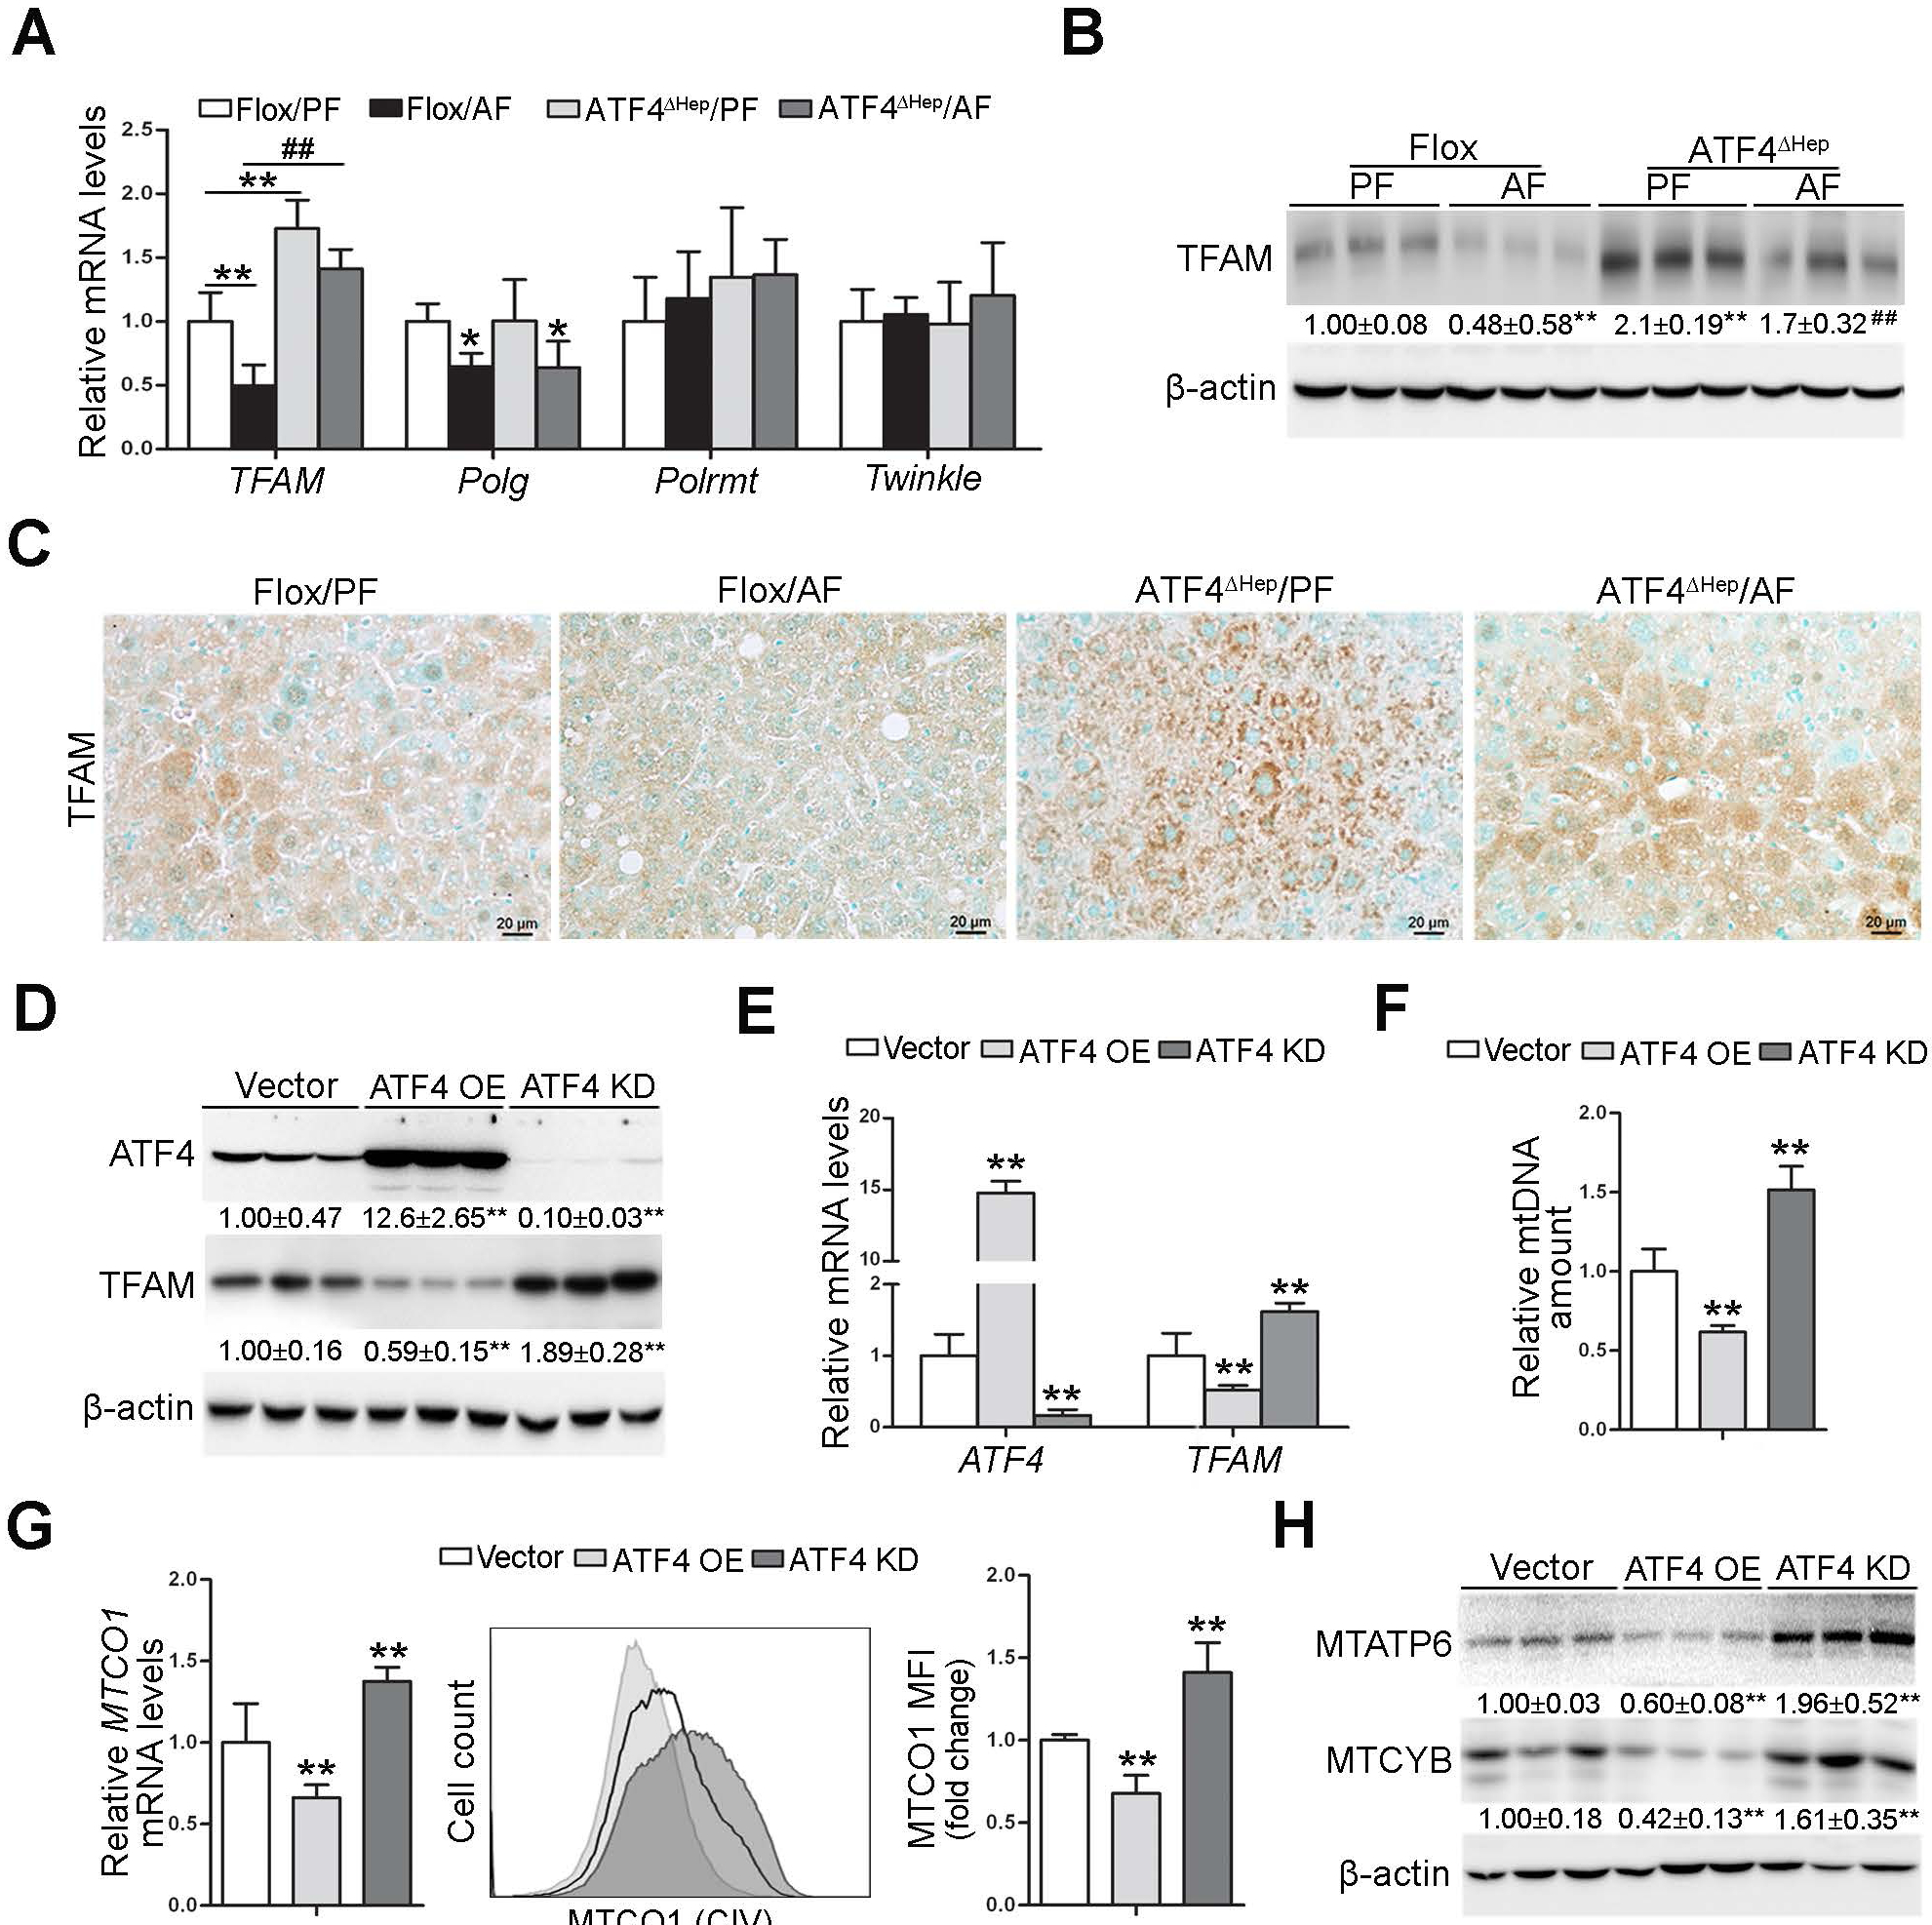
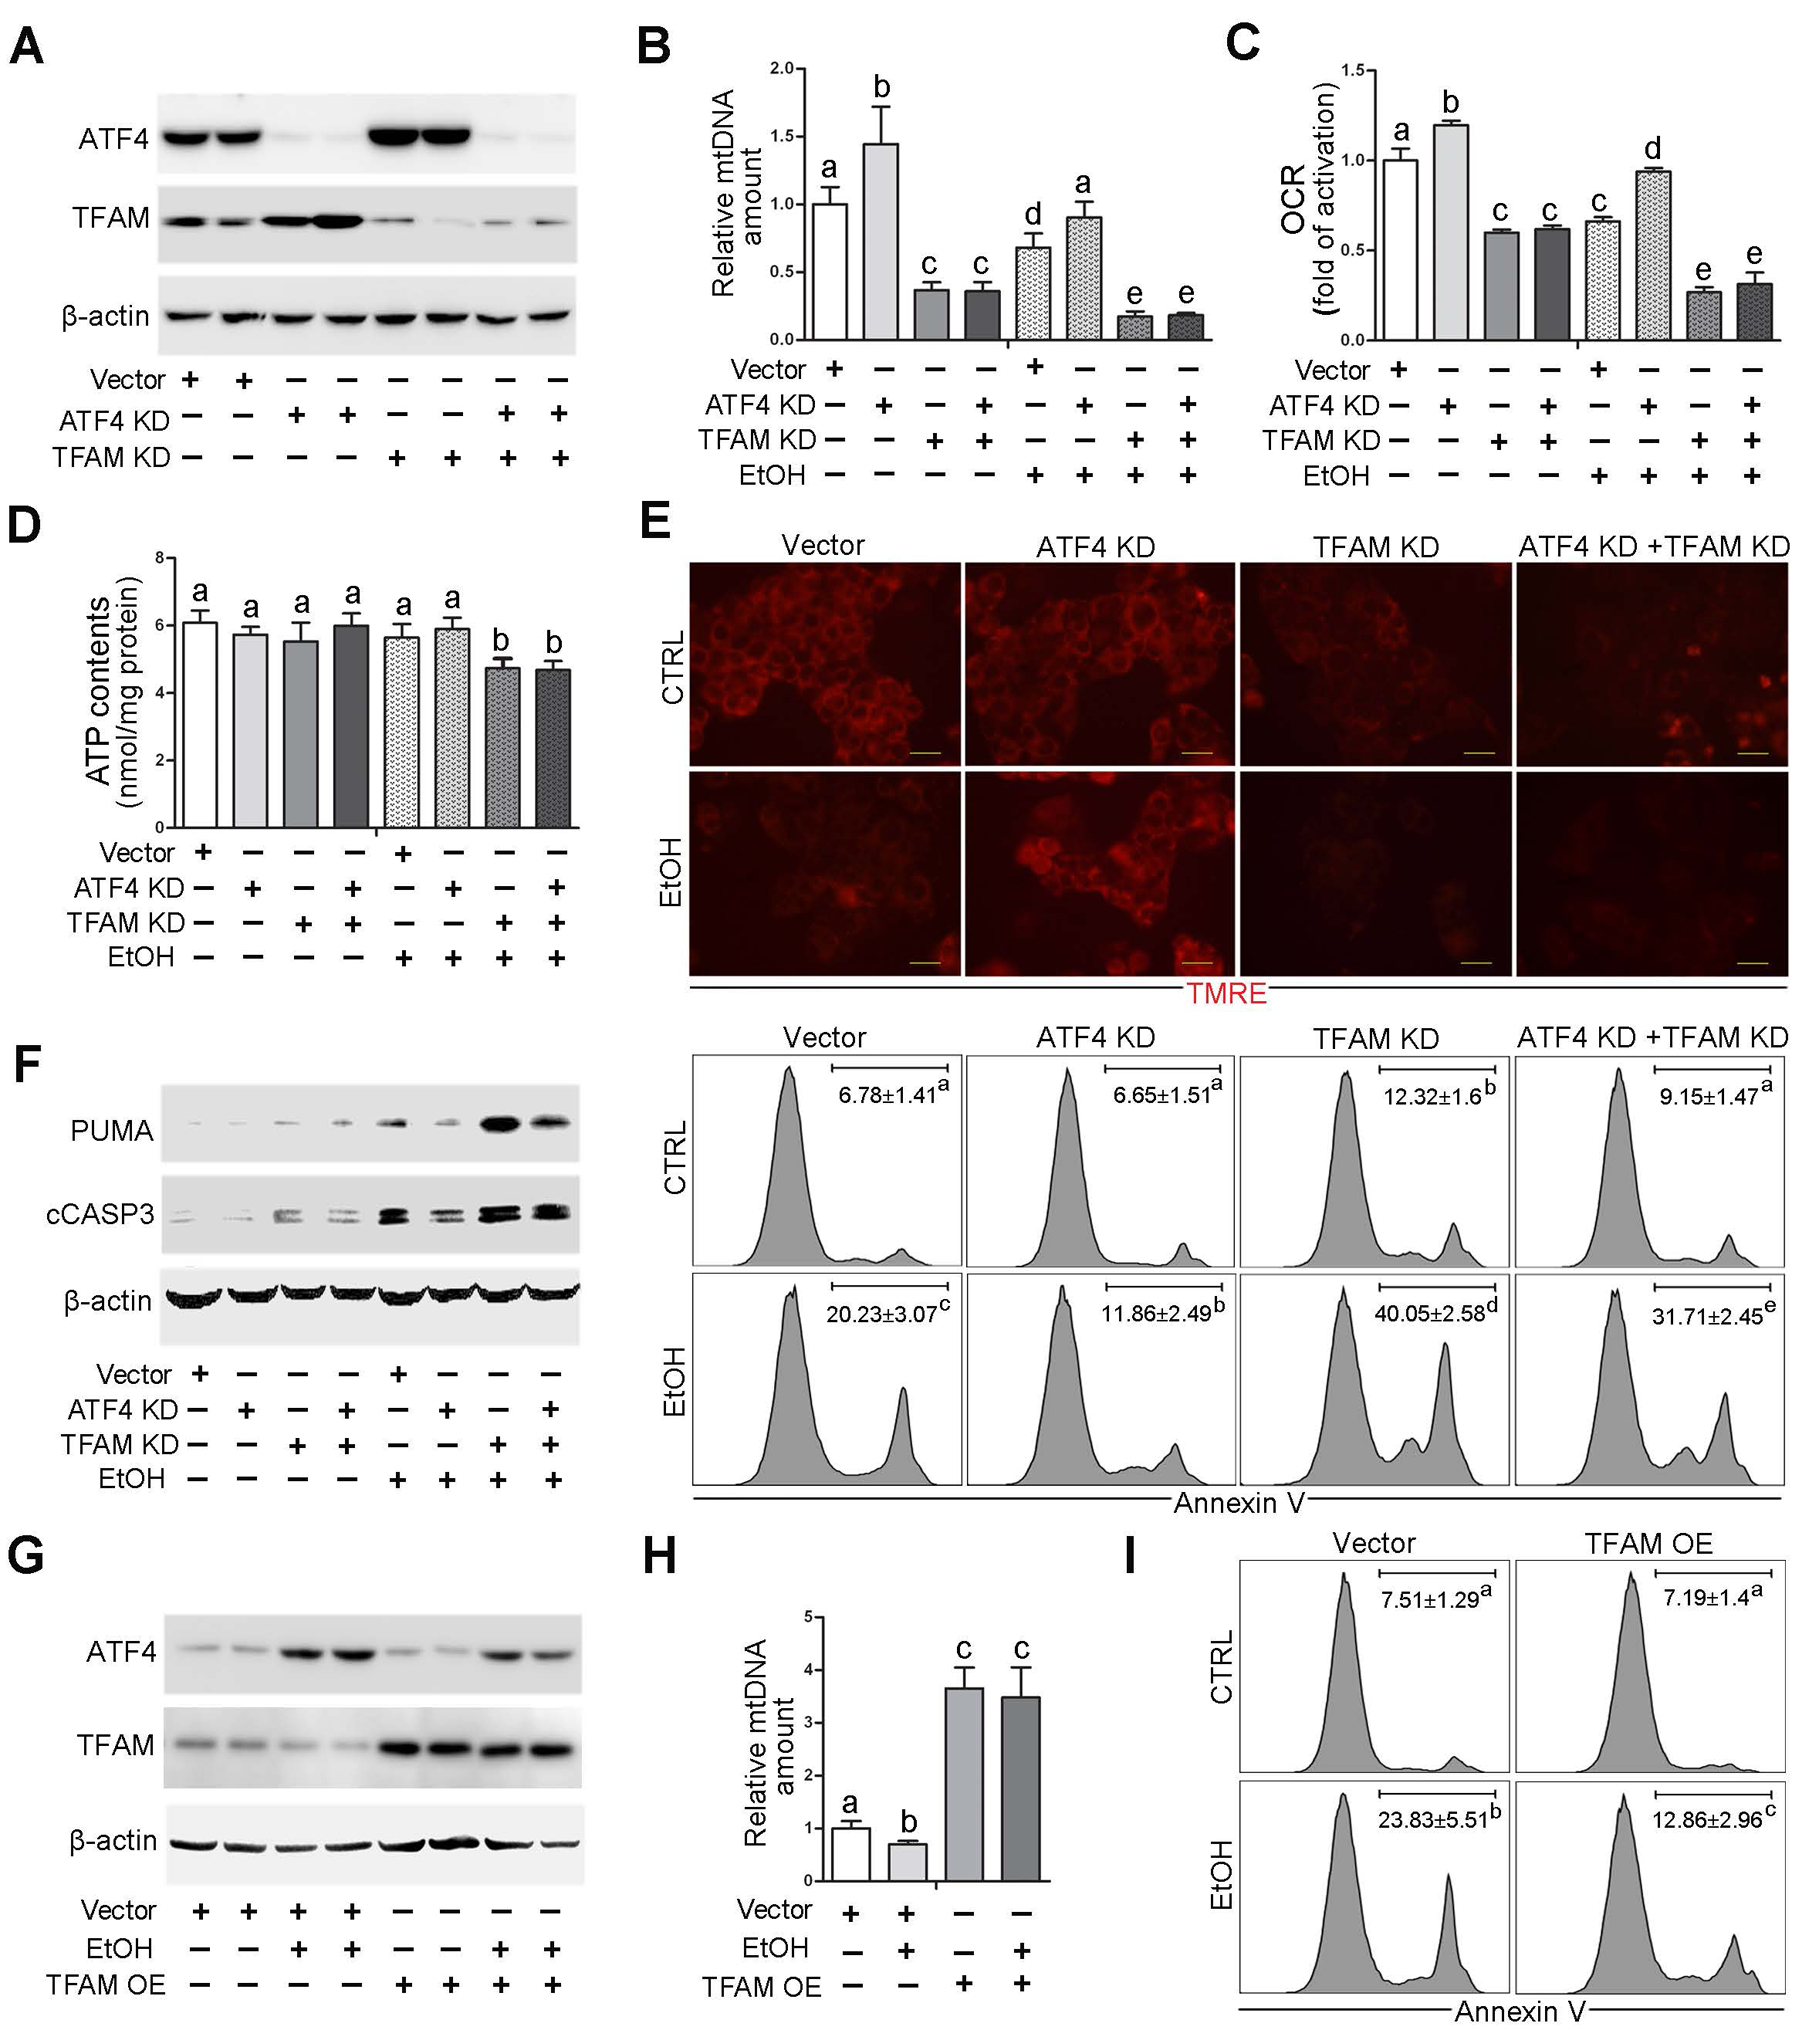
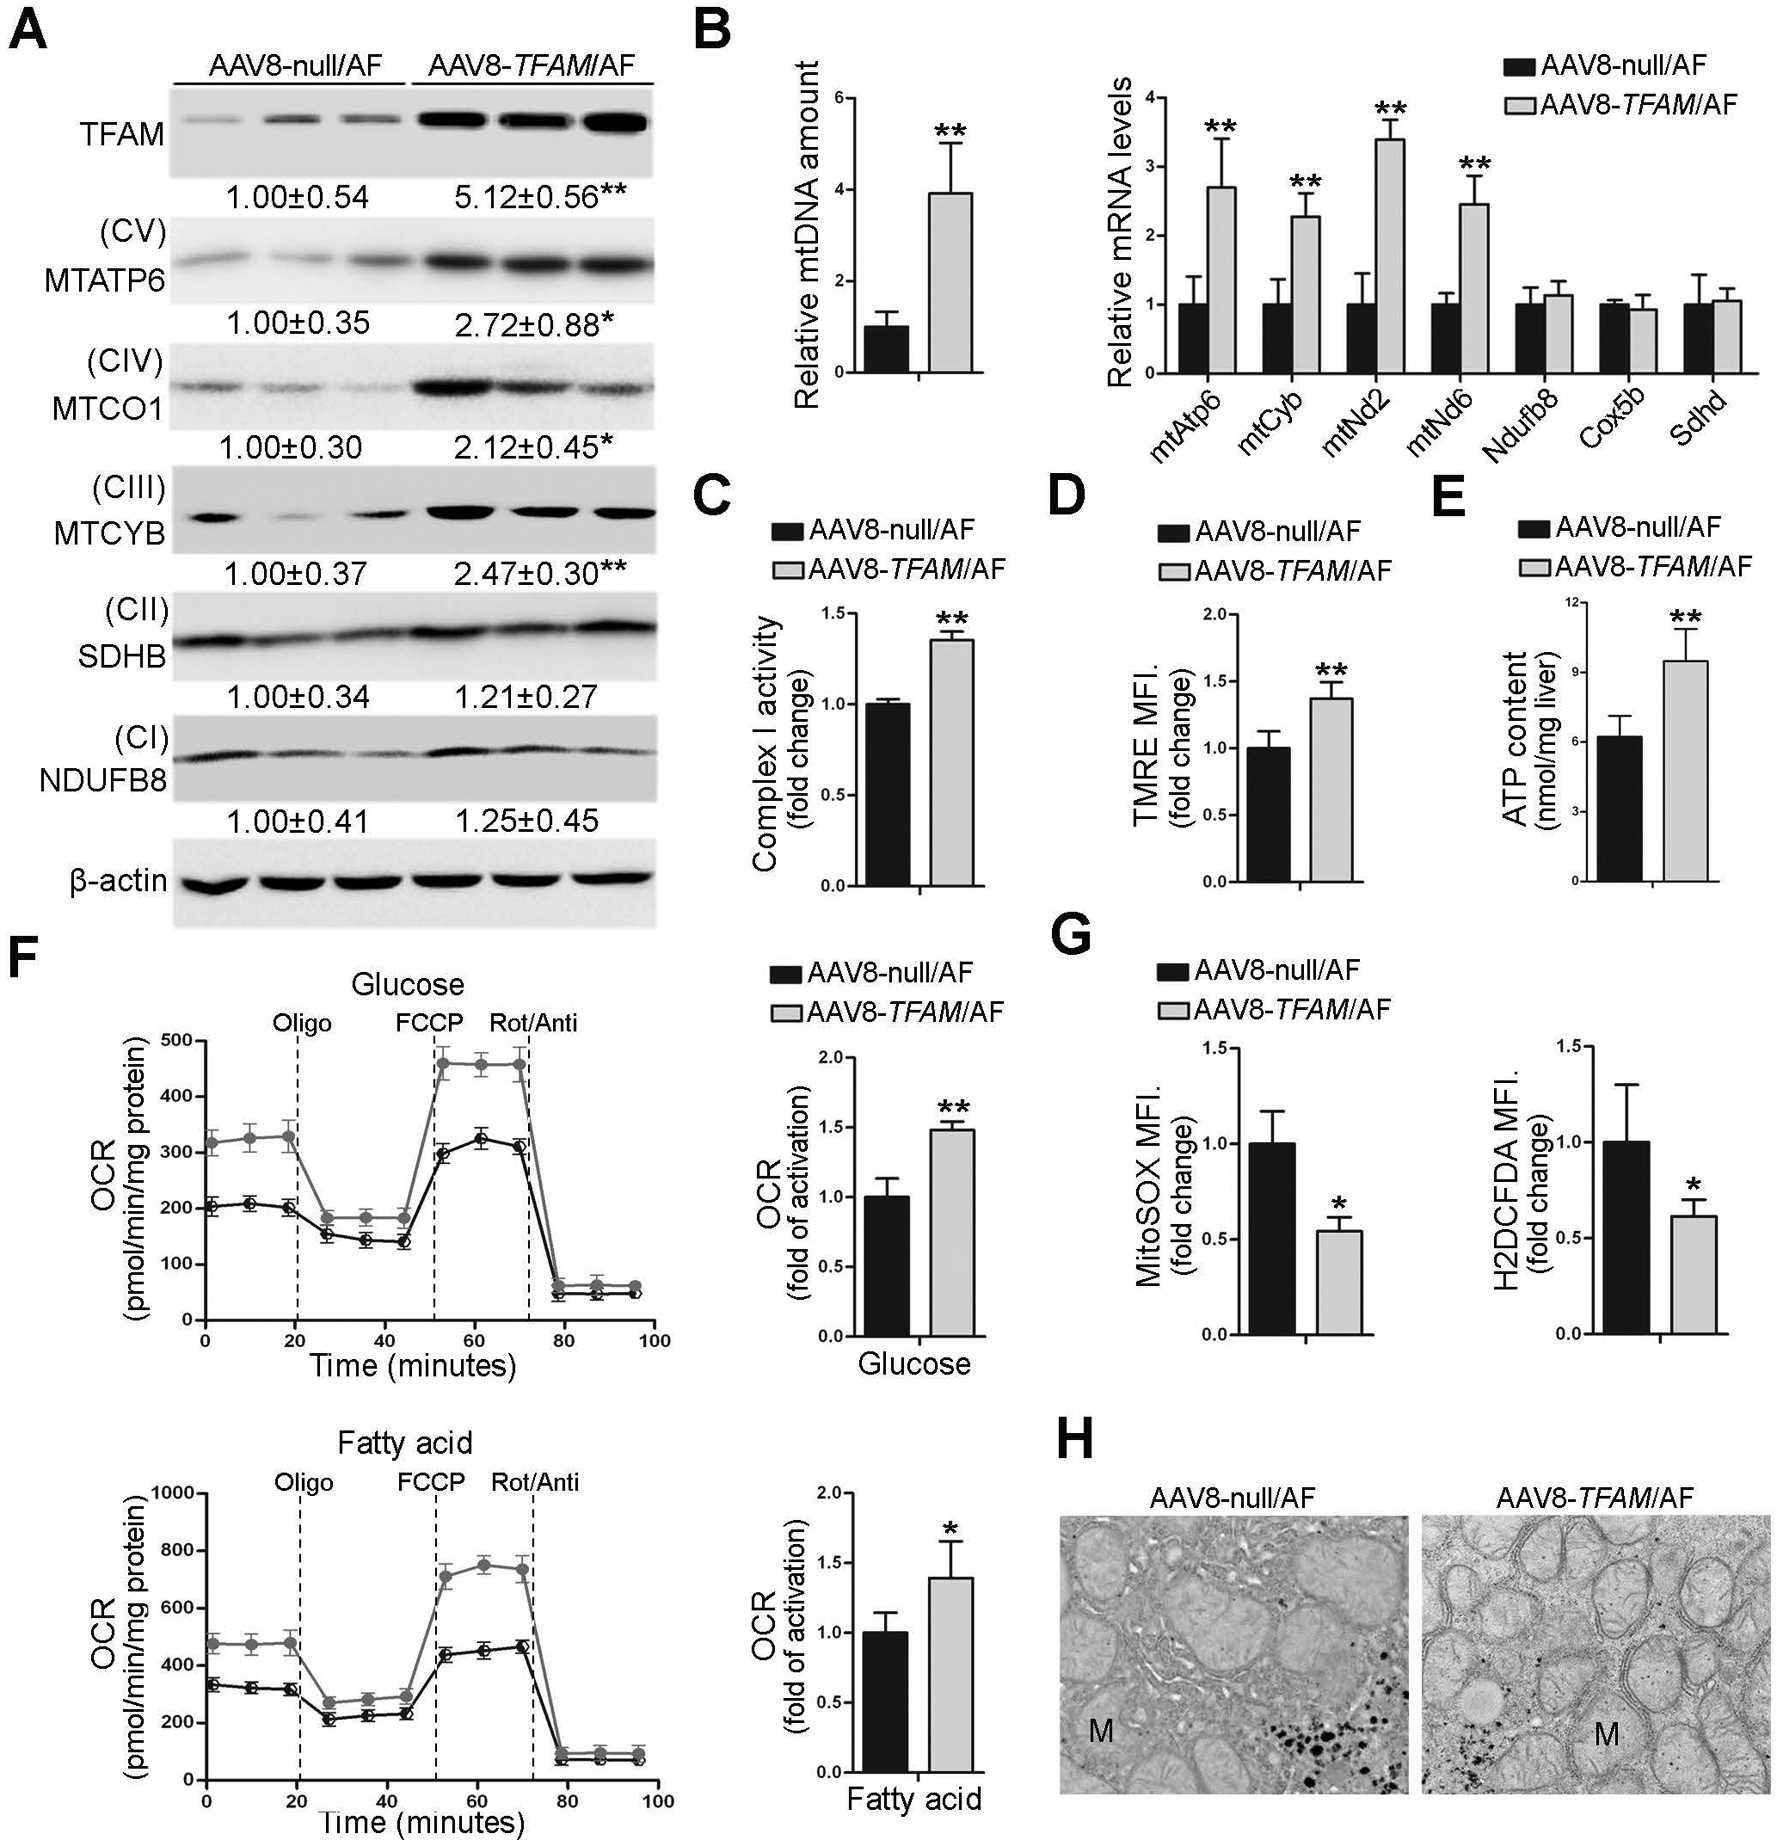
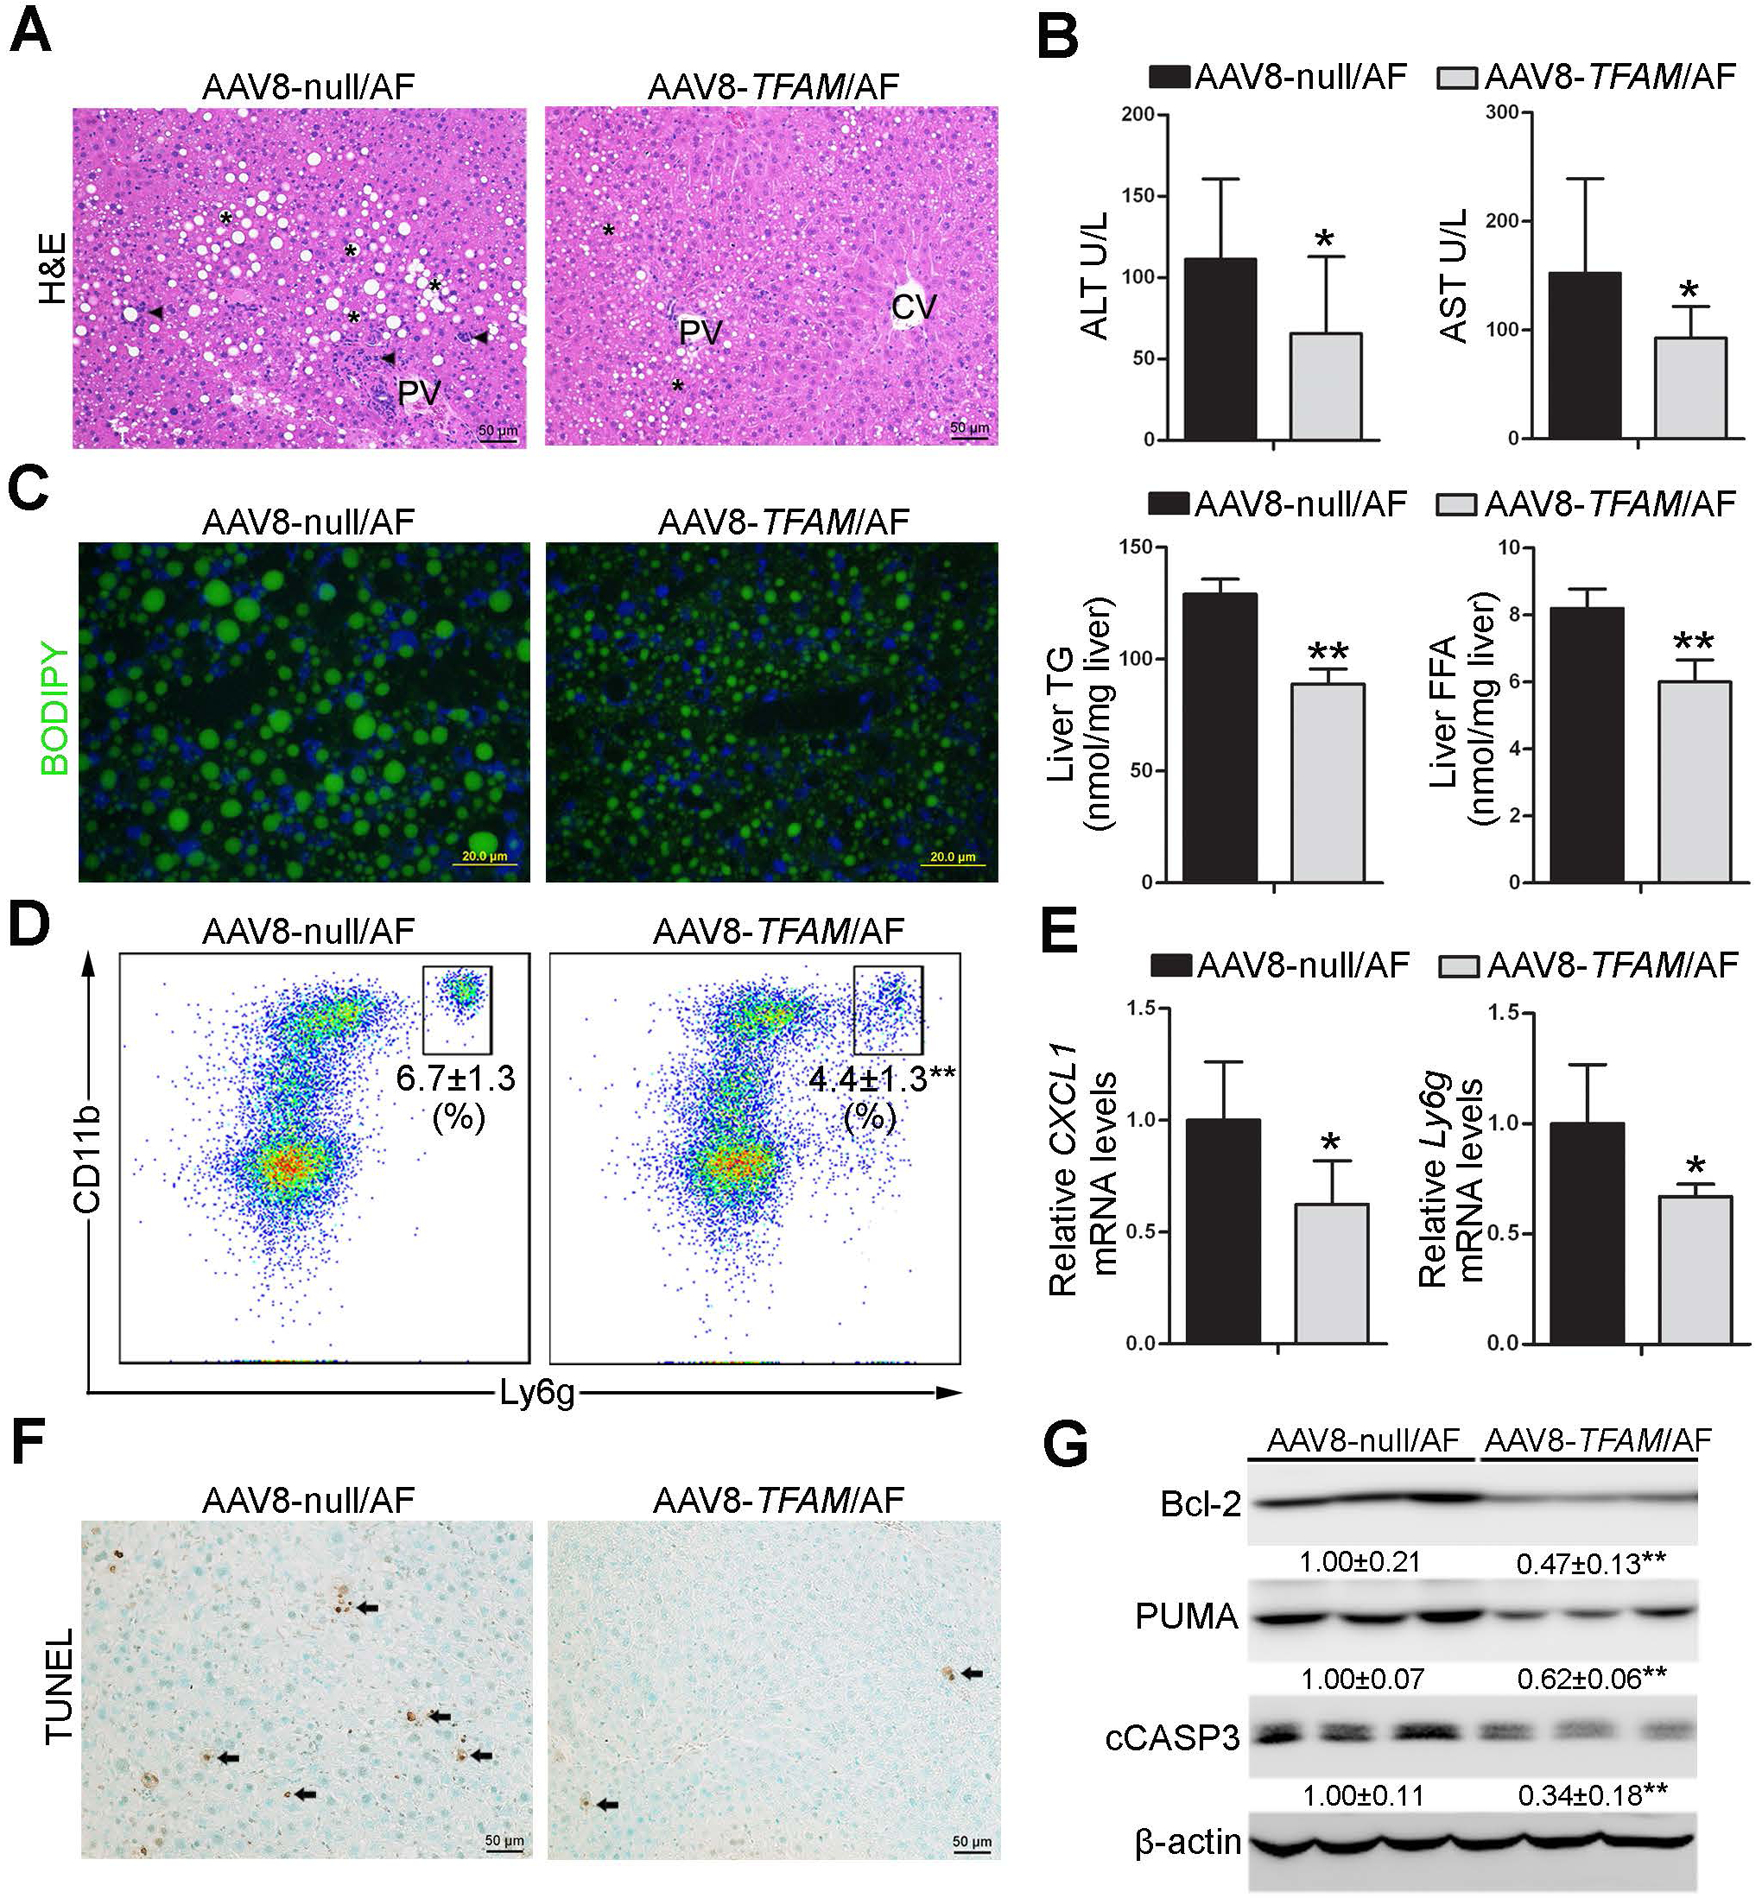
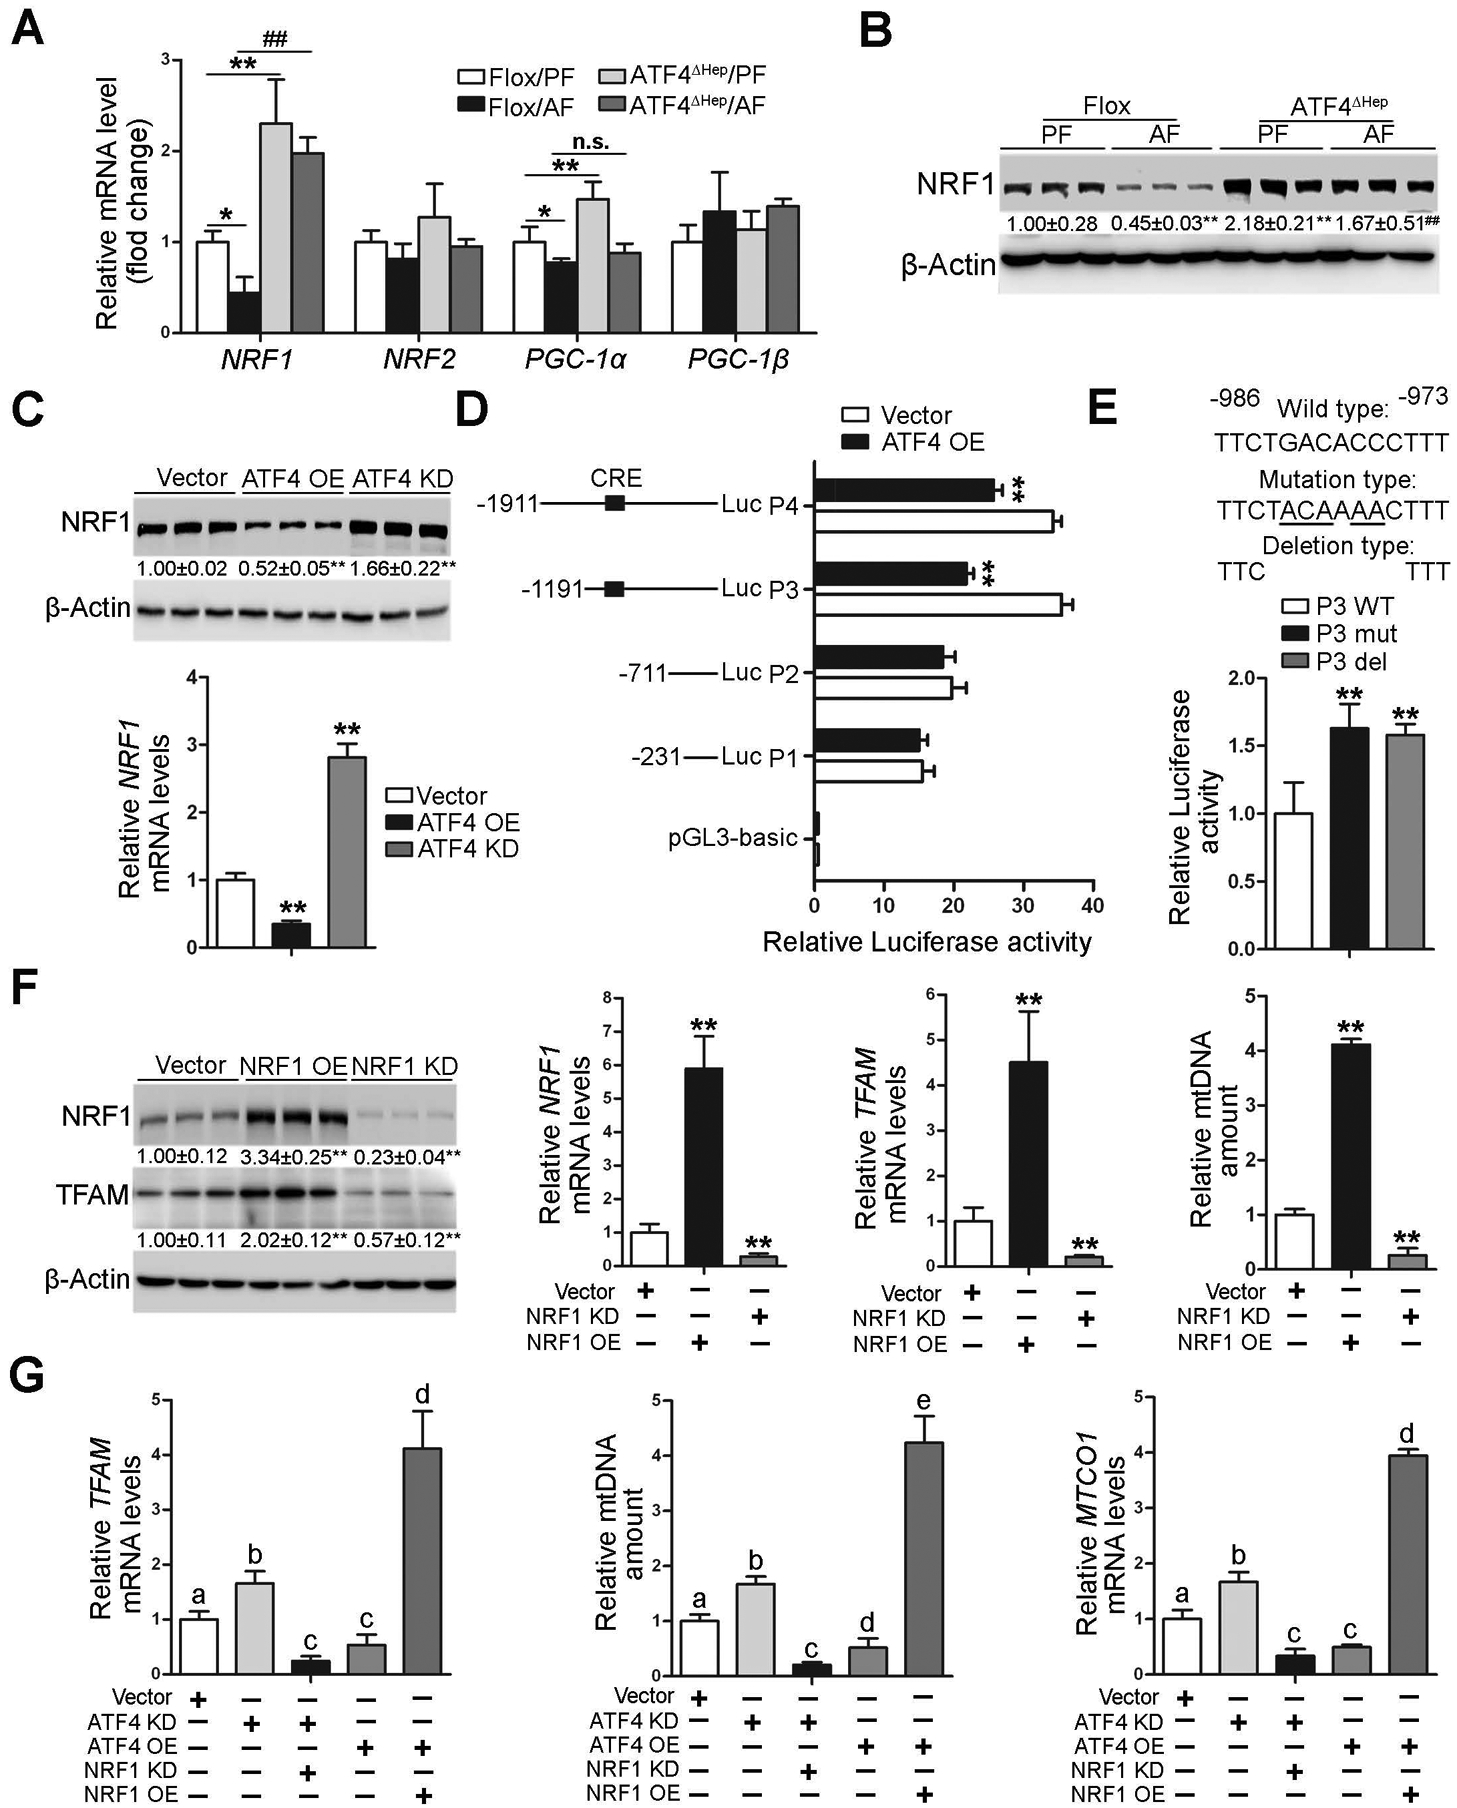
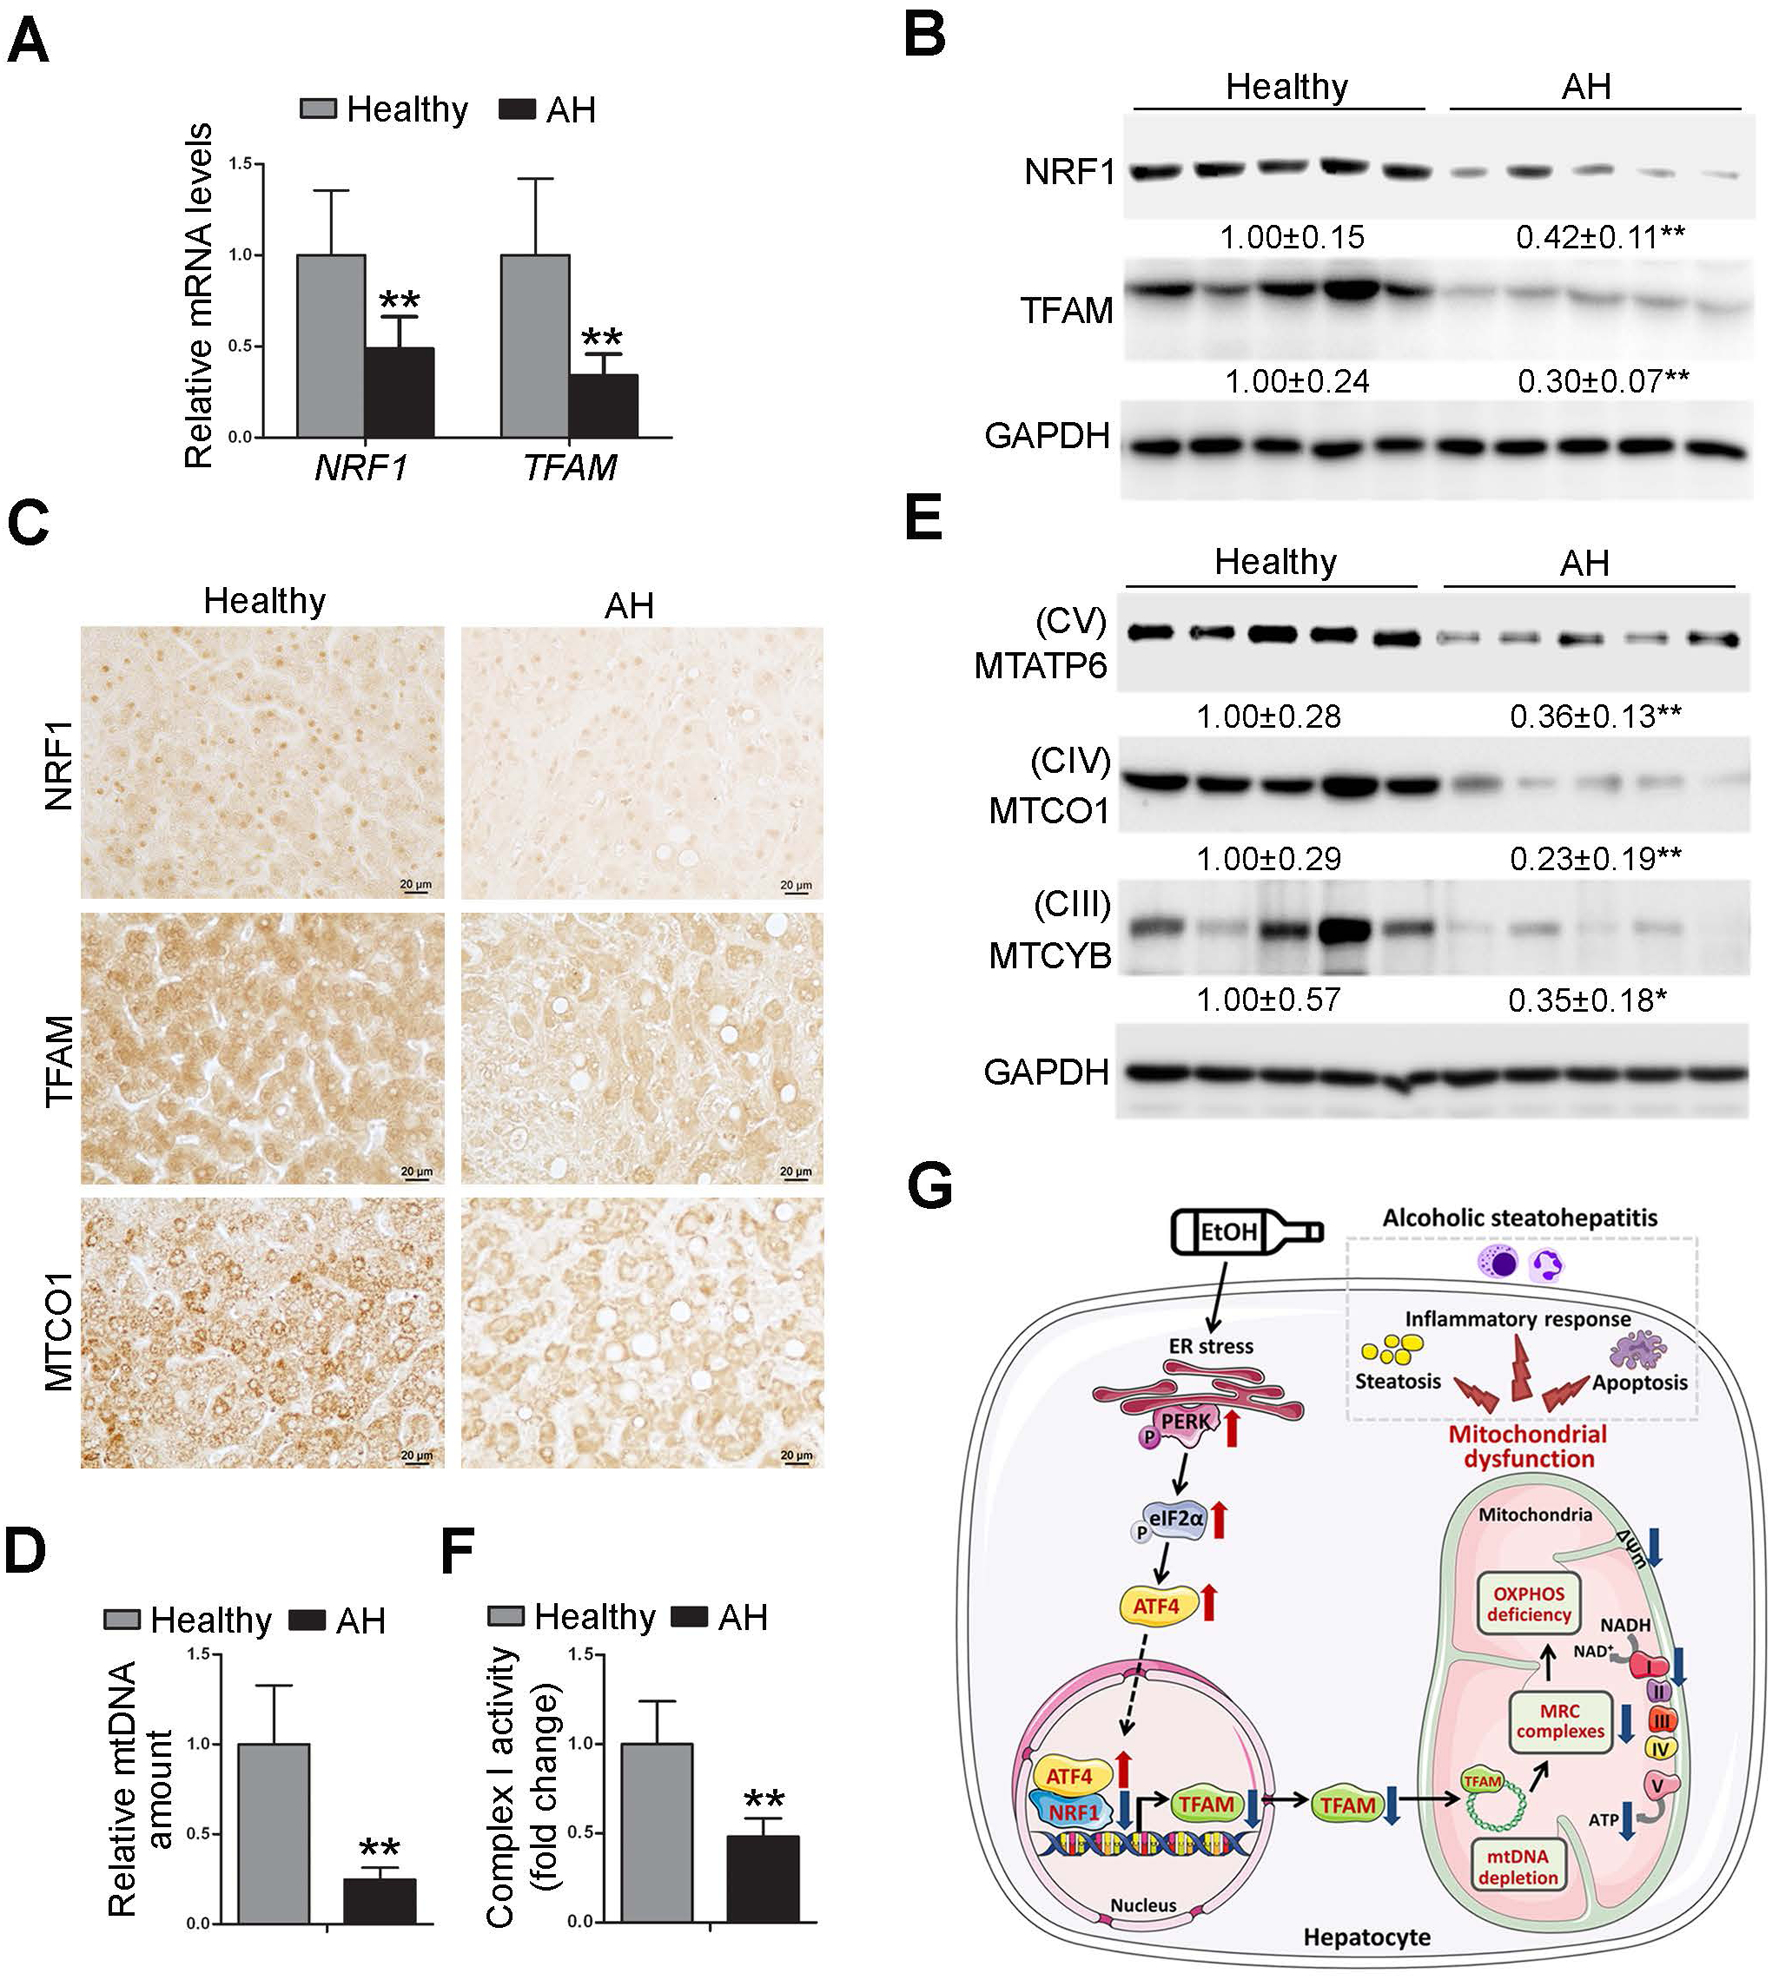
Results: Hepatic PERK-eIF2α-ATF4 ER stress signalling was upregulated in patients with AH. Hepatocyte-specific ablation of ATF4 in mice ameliorated alcohol-induced steatohepatitis. ATF4 ablation also attenuated alcohol-impaired mitochondrial biogenesis and respiratory function along with the restoration of TFAM. Cell studies confirmed that TFAM expression was negatively regulated by ATF4. TFAM silencing in hepatoma cells abrogated the protective effects of ATF4 knockdown on ethanol-mediated mitochondrial dysfunction and cell death. Moreover, hepatocyte-specific TFAM overexpression in mice attenuated alcohol-induced mitochondrial dysfunction and liver damage. Mechanistic studies revealed that ATF4 repressed the transcription activity of nuclear respiratory factor 1 (NRF1), a key regulator of TFAM, through binding to its promoter region. Clinical relevance among ATF4 activation, NRF1-TFAM pathway disruption and mitochondrial dysfunction was validated in the livers of patients with AH.

Conclusion: This study demonstrates that hepatic ATF4 plays a pathological role in alcohol-induced mitochondrial dysfunction and liver injury by disrupting the NRF1-TFAM pathway.

Keywords: alcoholic liver disease; energy metabolism; hepatocyte.


Conflict of interest statement

Competing interests: None declared.

Figures

Fig. 1.
Fig. 1.. Hepatic PERK-eIF2α-ATF4 signaling pathway is upregulated in ALD patients and hepatocyte-specific ablation of ATF4 protects alcohol-induced liver injury in mice.
(A-B) Liver tissues were obtained from ALD patients and healthy controls. (A) Western bolt and immunohistochemistry analysis of hepatic PERK-eIF2α-ATF4 signaling expression (n=5/group). Scale bars: 20 μm. (B) Analysis of mRNA levels of ATF4 in the livers (n=5/group). (C-G) ATF4 floxed and ATF4ΔHep male mice were pair-fed or alcohol-fed for 8 weeks plus a single binge of ethanol (4 g/kg) before 4 hours of tissue collection. (C) Protein and mRNA levels of ATF4 in the liver (n=3–8). (D) Liver histopathological changes shown by H&E staining. Scale bars: 50 μm. Asterisks: lipid droplets. Arrowheads: Infiltrated immune cells. (E) Serum ALT and AST activities (n=8–11). (F) Representative dot plot and gating strategy for 7-AADCD45+CD11b+ Ly6g+ neutrophils (n=6). (G) Immunohistochemistry of TUNEL and Western bolt analysis of hepatic CHOP, Bcl-2, PUMA, and cleaved caspase-3. Scale bars: 50 μm. Arrow: TUNEL positive cells. Protein bands intensity was quantified by ImageJ (NIH). Data are presented as means ± SD. In panels A and B, statistical comparisons were made using Student’s t-test; **P<0.01 vs. healthy control. In panels C-G, statistical comparisons were made using one-way ANOVA with Tukey’s post hoc test; **P<0.01 vs. Flox/PF mice; #P<0.05, ##P<0.01 vs. Flox/AF mice. PF, pair-fed; AF, alcohol-fed.
Fig. 2.
Fig. 2.. Ablation of ATF4 in hepatocyte protects alcohol-mediated mitochondrial dysfunction in the liver.
ATF4 floxed and ATF4ΔHep male mice were pair-fed or alcohol-fed for 8 weeks plus a single binge (4 g/kg) before 4 hours of tissue collection. (A) Representative oxygen consumption rate profile (OCR) and basal OCR in isolated primary hepatocytes. (B) ATP contents in the liver (n=5). (C) FACS analysis of mitochondrial ROS using MitoSOX dye (n=5). Data are the summary of the mean fluorescence intensity (MFI). (D) FACS analysis of mitochondrial membrane potential using TMRE probe (n=5). Data are the summary of the mean fluorescence intensity (MFI). (E) Hepatic complex I activity (n=6). (F) Immunohistochemistry of MTCO1 in the liver. Images were captured by light microscope. Scale bars: 20 μm. (G) Western blot analysis of mitochondrial respiratory complexes subunits (MTATP6, MTCO1, UQCRC2, SDHB, and NDUFB8). (H) mtDNA levels (MTND1) relative to nuclear DNA (SDHA) and the mRNA levels of mtDNA-encoded complexes subunits (n=5–6). (I) Mitochondrial morphology and ultrastructure. Protein bands intensity was quantified by ImageJ (NIH). Data are presented as means ± SD. Statistical comparisons were made using one-way ANOVA with Tukey’s post hoc test. *P<0.05, **P<0.01 vs. Flox/PF mice; #P<0.05, ##P<0.01 vs. Flox/AF mice. PF, pair-fed; AF, alcohol-fed; M, mitochondria.
Fig. 3.
Fig. 3.. ATF4 negatively regulates TFAM in hepatocyte.
(A-C) ATF4 floxed and ATF4ΔHep male mice were pair-fed or alcohol-fed for 8 weeks plus a single binge of ethanol (4 g/kg) 4 hours before tissue collection. (A) Relative mRNA levels of hepatic TFAM, Polg, Polrmt, and Twinkle (n=5). (B) Western blot of hepatic TFAM. (C) Immunohistochemistry of hepatic TFAM. Images were captured by light microscope. Scale bars: 20 μm. (D-H) VL-17 cells were transfected with either ATF4 overexpression or ATF4 knockdown CRISPR plasmids. (D) Western blot analysis of ATF4 and TFAM in VL-17A cells. (E) Analysis of mRNA levels of ATF4 and TFAM in VL-17A cells (n=5–8). (F) mtDNA levels (MTND1) relative to nuclear DNA (SDHA) in VL-17A cells (n=6). (G) The mRNA levels and protein levels of MTCO1 were measured by RT-PCR and flow cytometry, respectively (n=4–6). (H) Western blot analysis of MTATP6 and MTCYB in VL-17A cells. Protein bands intensity was quantified by ImageJ (NIH). Data are presented as means ± SD. Statistical comparisons were made using one-way ANOVA with Tukey’s post hoc test. Panel A and B, *P<0.05, **P<0.01 vs. Flox/PF mice. ##P<0.01 vs. Flox/AF mice. Panel D-H, **P<0.01 vs. control cells. PF, pair-fed; AF, alcohol-fed.
Fig. 4.
Fig. 4.. TFAM reduction is involved in ATF4-mediated mitochondrial dysfunction in VL-17A cells with alcohol exposure.
ATF4 knockdown, TFAM knockdown, ATF4/TFAM double knockdown VL-17A cells were generated and treated with 100 mM ethanol for 72 hours. (A) Western blot analysis of ATF4 and TFAM. (B) mtDNA levels (MTND1) relative to nuclear DNA (SDHA) in VL-17A cells (n=5). (C) Basal oxygen consumption rate of VL-17A cells (n=6). (D) ATP contents in VL-17A cells (n=5). (E) Immunofluorescent staining of mitochondrial membrane potential using TMRE probe. Scale bars: 20 μm. (F) Western blot analysis of PUMA and cleaved caspase-3, and FACS analysis of apoptotic cell death represented by Annexin V positive cells (n=4–6). (G-I) VL-17 cells were transfected with TFAM overexpression CRISPR plasmids and treated with 100 mM ethanol for 72 hours. (G) Western blot analysis of ATF4 and TFAM in VL-17A cells. (H) mtDNA levels (MTND1) relative to nuclear DNA (SDHA) in TFAM overexpression cells (n=5). (I) FACS analysis of apoptotic cell death represented by Annexin V positive cells. Protein bands intensity was quantified by ImageJ (NIH). Data are presented as means ± SD. Statistical comparisons were made using one-way ANOVA with Tukey’s post hoc test. Bars with different characters differ significantly (P < 0.05). EtOH, ethyl alcohol.
Fig. 5.
Fig. 5.. Hepatocyte-specific TFAM overexpression protects alcohol-induced mitochondrial dysfunction in mice.
Hepatocyte-specific TFAM overexpression mice were generated by injected in the retrial orbital sinus with recombinant adeno-associated viral (AAV) serotype 8 gene transfer vectors bearing a liver-specific promoter combination (TBG) with mouse TFAM sequence. Mice injected with null-vector are served as control. These mice were fed with alcohol for 8 weeks plus a single binge of alcohol (4 g/kg) 4 hours before tissue collection. (A) Protein levels of TFAM, MTATP6, MTCO1, MTCYB, SDHB, and NDFUB8 in the liver. (B) Hepatic mtDNA contents (MTND1 relative to SDHA) and mtDNA- and nuDNA-encoded genes expression (n=4–6). (C) Hepatic mitochondrial complex I activity (n=5). (D) FACS analysis of mitochondrial membrane potential using TMRE probe (n=5). Data are the summary of the mean fluorescence intensity (MFI). (E) ATP contents in the liver (n=5). (F) Representative oxygen consumption rate profile (OCR) and basal OCR in isolated primary hepatocytes. (G) FACS analysis of mitochondrial ROS and total ROS using MitoSOX dye and H2DCFDA dye, respectively (n=5). Data are the summary of the mean fluorescence intensity (MFI). (H) Mitochondrial morphology and ultrastructure. Protein bands intensity was quantified by ImageJ (NIH). Data are presented as means ± SD. Statistical comparisons were made using one Student’s t-test. *P<0.05, **P<0.01 vs. AAV8-null/AF mice. AF, alcohol-fed; M, mitochondria.
Fig. 6.
Fig. 6.. Hepatocyte-specific TFAM overexpression ameliorates alcoholic steatohepatitis in mice.
Hepatocyte-specific TFAM overexpression mice were generated by injected in the retrial orbital sinus with recombinant adeno-associated viral (AAV) serotype 8 gene transfer vectors bearing a liver-specific promoter combination (TBG) with mouse TFAM sequence. Mice injected with null-vector are served as control. These mice were fed with alcohol for 8 weeks plus a single binge of alcohol (4 g/kg) 4 hours before tissue collection. (A) H&E staining. Scale bars: 50 μm. Asterisks: lipid droplets. Arrowheads: Infiltrated immune cells. (B) Serum ALT and AST activities (n=6). (C) BODIPY staining of the neutral lipids in mouse liver, and hepatic TG and FFA contents (n=6). Scale bars: 20 μm. (D) Representative dot plot for CD11b+ and Ly6g+ neutrophils are displayed of singlet 7-AAD CD45+ cells (n=5). (E) The mRNA levels of hepatic Cxcl-1 and Ly6g (n=5). (F) Immunohistochemistry of hepatic TUNEL. Scale bars: 50 μm. Arrow: TUNEL positive cells. (G) The protein levels of Bcl-2, PUMA, and cleaved caspase3 in the liver. Protein bands intensity was quantified by ImageJ (NIH). Data are presented as means ± SD. Statistical comparisons were made using one Student’s t-test. *P<0.05, **P<0.01 vs. AAV8-null/AF mice. AF, alcohol-fed.
Fig. 7.
Fig. 7.. NRF1 is directly interact and inactivated by ATF4.
(A-B) ATF4 floxed and ATF4ΔHep male mice were pair-fed or alcohol-fed for 8 weeks plus a single binge of ethanol (4 g/kg) 4 hours before tissue collection. (A) Analysis of mRNA levels of NRF1, NRF2, PGC-1α, and PGC-1β in livers (n=5). (B) Western blot analysis of NRF1. (C) The expression of NRF1 in VL-17A cells transfected with either ATF4 overexpression CRISPR plasmid or ATF4 knockdown CRISPR plasmid. (D) The Relative luciferase activity of NRF1 promoters. (E) Relative promoter activity of wild-type of P3 (P3 WT) promoter and the mutated (P3 mut) and deleted (P3 del) constructs. The dual-luciferase activity was measured after 48 h transfection. (F) The protein levels and mRNA levels of NRF1 and TFAM after transfected either NRF1 overexpression CRISPR plasmid or NRF1 knockdown CRISPR plasmid. (G) Relative TFAM mRNA levels, mtDNA contents (MTND1 relative to SDHA), and mRNA levels of MTCO1 in ATF4/NRF1 double overexpression and ATF4/NRF1 double knockout VL-17A cell lines. Protein bands intensity was quantified by ImageJ (NIH). Data are presented as means ± SD. Statistical comparisons were made using one-way ANOVA with Tukey’s post hoc test (n=3–6). In panels A and B, *P<0.05, **P<0.01 vs. Flox/PF mice; # P<0.05, ##P<0.01 vs. Flox/AF mice. In panels C-F, **P < 0.05 versus corresponding control. In panel G, bars with different characters differ significantly (P < 0.05). PF, pair-fed; AF, alcohol-fed.
Fig. 8.
Fig. 8.. NRF1-TFAM signaling pathway is disrupted in the liver of patients with alcoholic hepatitis.
We obtained liver tissues from severe ALD patients and healthy donors. (A) The mRNA levels of hepatic NRF1 and TFAM (n=5). (B) Western blot analysis of hepatic NRF1 and TFAM. (C) Immunohistochemistry staining of NRF1, TFAM, and MTCO1 in the liver. Images were captured by light microscope. Scale bars: 20 μm. (D) mtDNA levels (MTND1) relative to nuclear DNA (SDHA) in the liver (n=5). (E) Western blot analysis of hepatic MTATP6, MTCO1, and MTCYB (n=5). (F) Hepatic complex I activity (n=5). Protein bands intensity was quantified by ImageJ (NIH). Data are presented as means ± SD. Statistical comparisons were made using Student’s t-test (n=5). *P<0.05, **P<0.01 vs. healthy controls.

References

    1. Gao B, Bataller R. Alcoholic liver disease: pathogenesis and new therapeutic targets. Gastroenterology 2011;141:1572–1585. - PMC - PubMed
    1. Seitz HK, Bataller R, Cortez-Pinto H, et al.Alcoholic liver disease. Nature reviews Disease primers 2018;4:16. - PubMed
    1. Thursz M, Kamath PS, Mathurin P, et al.Alcohol-related liver disease: Areas of consensus, unmet needs and opportunities for further study. Journal of hepatology 2019;70:521–530. - PubMed
    1. Spinelli JB, Haigis MC. The multifaceted contributions of mitochondria to cellular metabolism. Nature cell biology 2018;20:745–754. - PMC - PubMed
    1. Koopman WJ, Distelmaier F, Smeitink JA, et al.OXPHOS mutations and neurodegeneration. The EMBO journal 2013;32:9–29. - PMC - PubMed

Publication types