. 2020 Nov 11;12(569):eaax0091.
doi: 10.1126/scitranslmed.aax0091.

Amyloid-like oligomerization of AIMP2 contributes to α-synuclein interaction and Lewy-like inclusion

Affiliations

Amyloid-like oligomerization of AIMP2 contributes to α-synuclein interaction and Lewy-like inclusion

Sangwoo Ham et al. Sci Transl Med. .

Abstract

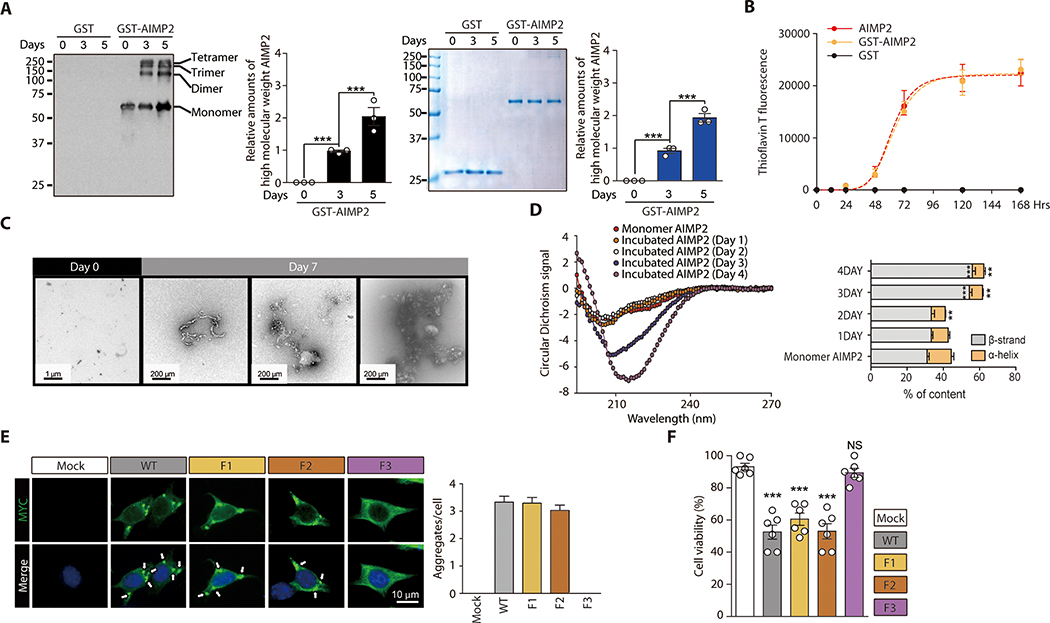
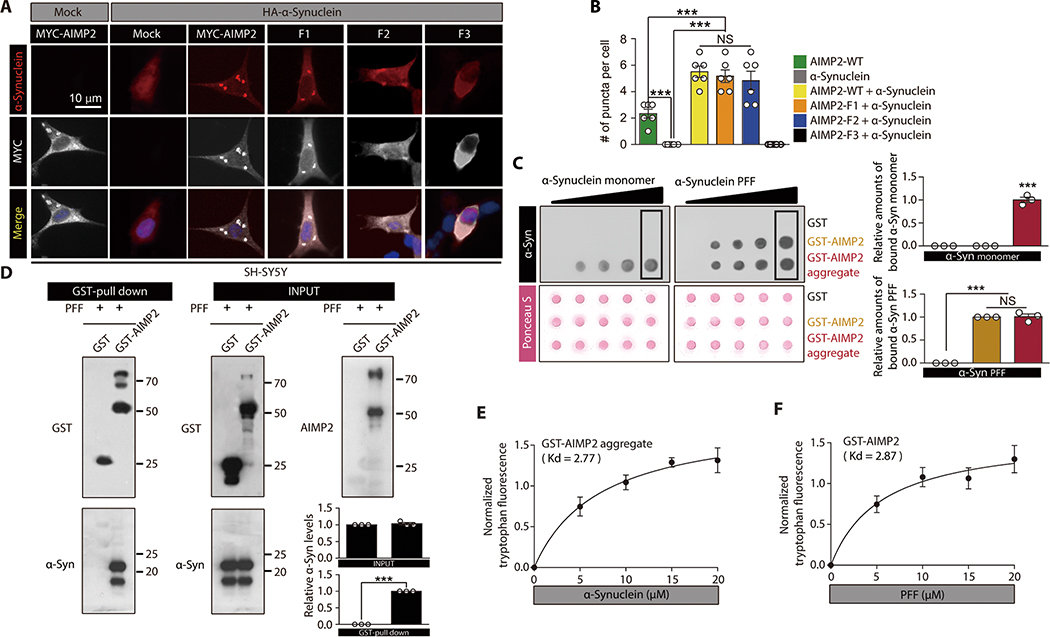
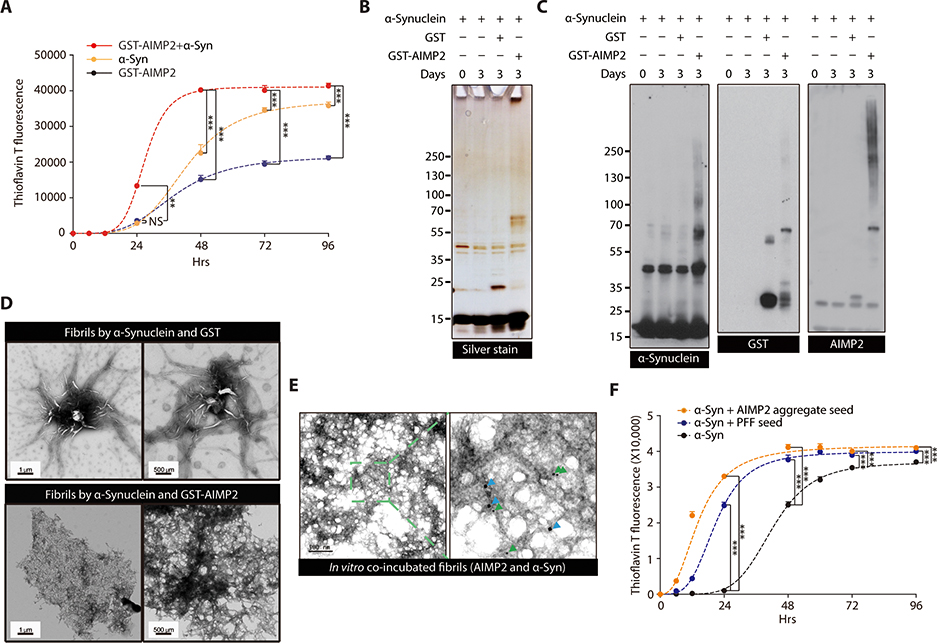
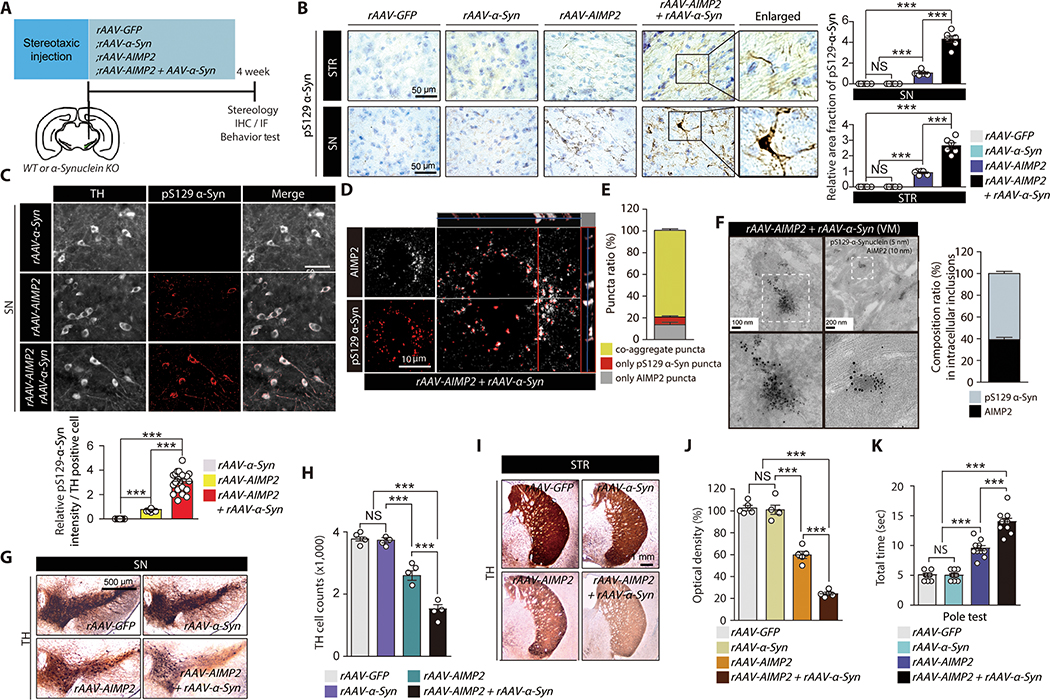
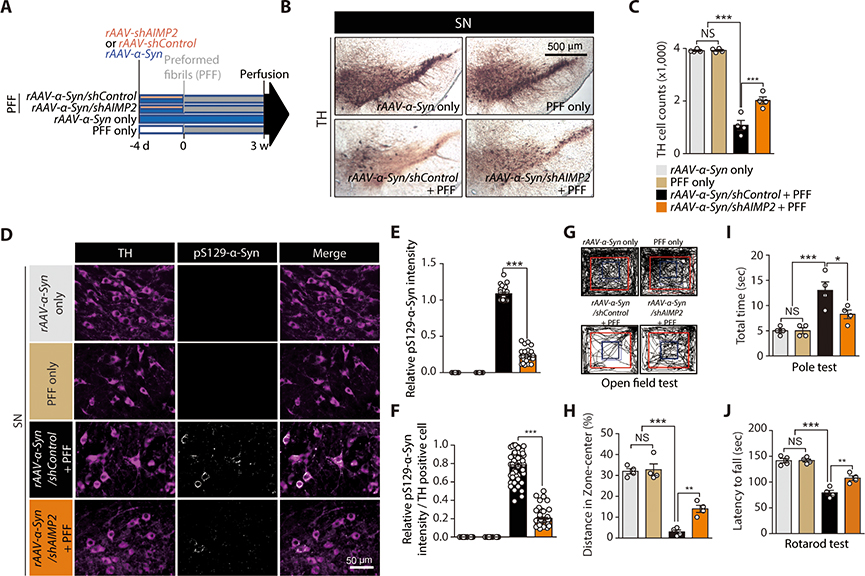
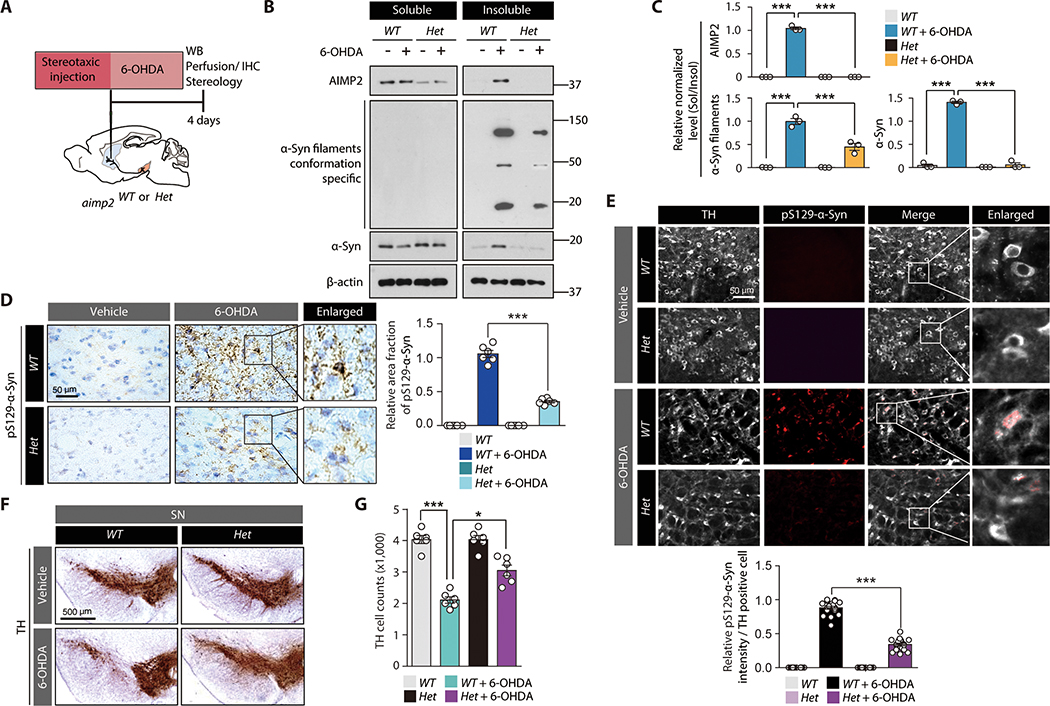
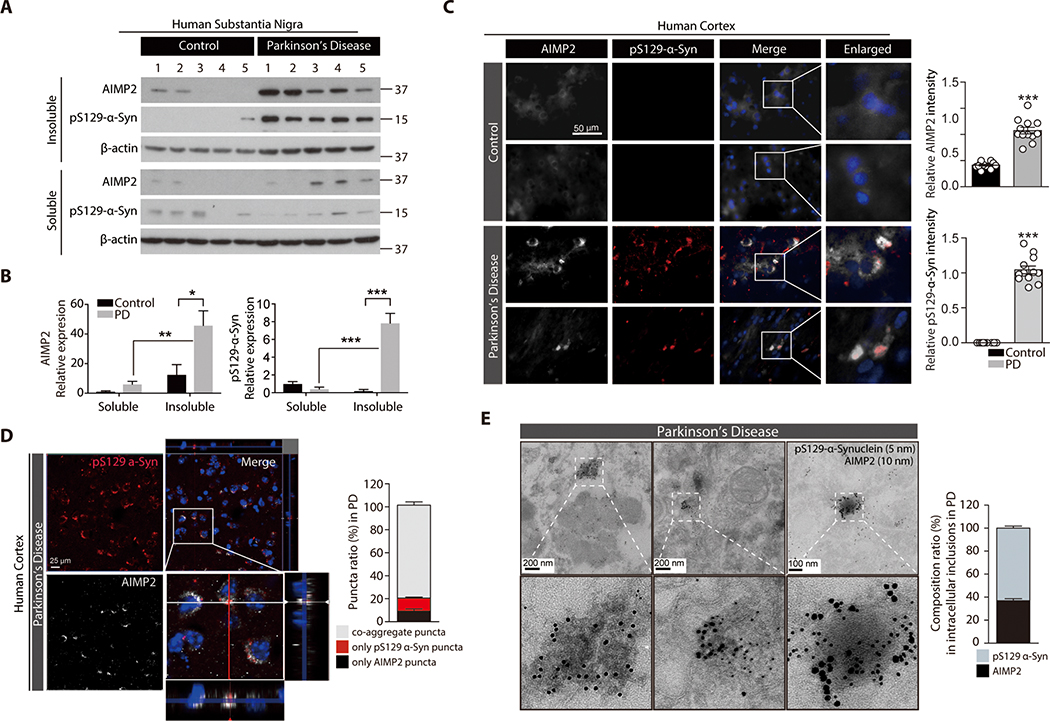
Lewy bodies are pathological protein inclusions present in the brain of patients with Parkinson's disease (PD). These inclusions consist mainly of α-synuclein with associated proteins, such as parkin and its substrate aminoacyl transfer RNA synthetase complex-interacting multifunctional protein-2 (AIMP2). Although AIMP2 has been suggested to be toxic to dopamine neurons, its roles in α-synuclein aggregation and PD pathogenesis are largely unknown. Here, we found that AIMP2 exhibits a self-aggregating property. The AIMP2 aggregate serves as a seed to increase α-synuclein aggregation via specific and direct binding to the α-synuclein monomer. The coexpression of AIMP2 and α-synuclein in cell cultures and in vivo resulted in the rapid formation of α-synuclein aggregates with a corresponding increase in toxicity. Moreover, accumulated AIMP2 in mouse brain was largely redistributed to insoluble fractions, correlating with the α-synuclein pathology. Last, we found that α-synuclein preformed fibril (PFF) seeding, adult Parkin deletion, or oxidative stress triggered a redistribution of both AIMP2 and α-synuclein into insoluble fraction in cells and in vivo. Supporting the pathogenic role of AIMP2, AIMP2 knockdown ameliorated the α-synuclein aggregation and dopaminergic cell death in response to PFF or 6-hydroxydopamine treatment. Together, our results suggest that AIMP2 plays a pathological role in the aggregation of α-synuclein in mice. Because AIMP2 insolubility and coaggregation with α-synuclein have been seen in the PD Lewy body, targeting pathologic AIMP2 aggregation might be useful as a therapeutic strategy for neurodegenerative α-synucleinopathies.


Figures

Figure 1.
Figure 1.. Amyloid-like self-oligomerization and cell toxicity by AIMP2
(A) Aggregation of recombinant GST-AIMP2-FLAG (50 uM) in 100 mM sodium acetate buffer (pH 7.5) during in vitro incubation based on Western blot analysis and Coomassie brilliant blue staining. Quantification of AIMP2 Western blots and Coomassie bands (n = 3). (B) Amyloid formation for GST, GST-AIMP2-FLAG or AIMP2-FLAG (50 uM) incubated in vitro for indicated days determined by ThT fluorescence staining (n = 3). (C) Ultrastructure of native or aggregated recombinant GST-AIMP2-FLAG (7 d incubation) monitored by TEM. (D) CD spectra of AIMP2 monomer and aggregates formed during incubation for the indicated days (left panel). Secondary structure analysis by Dichroweb (n =3 experiments, right panel, statistical comparisons with monomer AIMP2) (E) Aggregate formation in SH-SY5Y cells transfected with MYC-tagged wild type AIMP2 (WT), and deletion mutants monitored by immunofluorescence (left panel). Quantification of aggregate puncta number per cell (n = mock 136, WT 115, F1 124, F2 120 cells total from 6 slides, right panel). (F) Trypan blue exclusion cell viability assay for SH-SY5Y cells transfected with the indicated constructs (48 hrs) (n = 6 per group). Quantified data are expressed as mean ± SEM. Statistical significance was determined by ANOVA test with Tukey post-hoc analysis, **p < 0.01, and ***p < 0.001; NS: not significant.
Figure 2.
Figure 2.. Interaction between AIMP2 and α-synuclein is conformation specific.
(A) Immunofluorescence images showing co-localization and perinuclear aggregation of α-synuclein with AIMP2 in SH-SY5Y cells with the indicated transfections. The MYC signal is peudo-colored for original green fluorescence. (B) Quantification of aggregates puncta with AIMP2 or α-synuclein in panel A (n = 6 slides per group, analyzed cell number is presented in data file S1) (C) Dot blot analysis showing specific interaction of either α-synuclein monomer with AIMP2 aggregate or PFF with both monomeric and aggregate AIMP2. Equal loading was confirmed by Ponceau S staining. Affinity association of monomeric or fibril α-synuclein with blotted proteins were evaluated by using anti-α-synuclein antibody. Quantification of the boxed dot blot intensities (n = 3, right panel). (D) Direct physical association of recombinant AIMP2 with PFF determined by a GST pull down assay. Quantification of Western blots (n = 3, right panel). (E) Tryptophan fluorescence measurement of aggregated GST-AIMP2-FLAG (10 uM) incubated with increasing amounts of recombinant α-synuclein (n = 4 per group). (F) Tryptophan fluorescence measurement of GST-AIMP2-FLAG (10 uM) incubated with increasing amounts of sonicated recombinant PFF (n = 4 per group). Quantified data are expressed as mean ± SEM. Statistical significance was determined by ANOVA test with Tukey post-hoc analysis or unpaired two-tailed Student’s t-test, ***p < 0.001; NS: not significant.
Figure 3.
Figure 3.
α-synuclein oligomer/fibril formation is enhanced by AIMP2 in vitro (A) ThT fluorescence assay of in vitro aggregation for recombinant α-synuclein (50 uM) and/or GST-AIMP2-FLAG (50 uM) (n = 4 per group). (B) Silver-stained gel image of in vitro incubation samples of α-synuclein (50 uM) and/or GST-AIMP2-FLAG (50 uM). (C) Representative immunoblots of α-synuclein or AIMP2 for in vitro incubation samples with various combinations. (D) Ultrastructure of protein aggregates prepared from α-synuclein incubation (7 d) with either GST or GST-AIMP2-FLAG monitored by a TEM. (E) Localization of AIMP2 and α-synuclein in protein aggregate formed by in vitro coincubation of recombinant AIMP2 and α-synuclein determined by immuno-Gold EM using 10 nm (green arrow) or 20 nm (blue arrow) nanoGold particles conjugated to anti-AIMP2 and anti-α-synuclein antibodies, respectively. (F) ThT fluorescence assay of in vitro aggregation for recombinant α-synuclein (50 uM) alone or with small amounts of PFF (2.5 uM) or AIMP2 preformed aggregate (2.5 uM) (n = 3 per group). Quantified data are expressed as mean ± SEM. Statistical significance was determined by ANOVA test with Tukey post-hoc analysis, **p < 0.01, and ***p < 0.001; NS: not significant.
Figure 4.
Figure 4.. Co-expression and interaction of AIMP2 and α-synuclein in vivo enhanced α-synuclein aggregation and dopaminergic cell loss.
(A) Schematics of in vivo rAAV nigral injection to 2 month old C57BL/6 or α-synuclein KO mice. Experimental schedules for Western blot (WB), immunohistochemistry (IHC), TH stereology, and behavior test are indicated. (B) Neuropathological assessment (Nissl counter stain) of phosphorylated α-synuclein in nigral and striatal sections from the indicated experimental mouse groups. Quantification of pS129-α-Syn immunohistochemistry (n = 6 slides from 3 mice per group, right panel). (C) Immunofluorescence images showing pS129-α-synuclein and TH (pseudo-colored for original green fluorescence) expression in SN of mouse brains after intranigral injection of rAAV-α-synuclein, rAAV-AIMP2 or both. Quantification of pS129-α-Syn immunofluorescence (n = 23 cells from 3 mice per group, bottom panel). (D) Confocal analysis of co-localization and aggregation of phosphorylated α-synuclein and AIMP2 (pseudo-colored for original green fluorescence). (E) % ratio of aggregates with different composition of AIMP2 or/and phosphorylated α-synuclein (n = 66 cells from 3 mice). (F) Ultrastructure of inclusion and co-labelling of AIMP2 and pS129-α-synuclein by nanogold particles for VM tissues from mice co-injected with rAAV-AIMP2 and rAAV-α-synuclein. 10 nm and 5 nm nanogold particles were used to detect anti-AIMP2 and anti-pS129-α-synuclein antibodies, respectively. Composition ratio of AIMP2 and pS129-α-Syn in inclusion structures (n = 41 inclusions from 3 mice, right panel). (G) TH immunohistochemistry of SN sections from the experimental mouse groups. (H) Stereological counting of dopamine neurons in the SN pars compacta of mouse groups in panel G (n = 4 mice per group). (I) TH immunohistochemistry of striatum (STR) sections from the experimental mouse groups. (J) Quantification of striatal TH fiber density for panel I determined by optical density measurement (n = 4 mice per group) (K) Pole test for mouse groups with nigral injection of the indicated rAAV viruses (n = 11 mice per group). Quantified data are expressed as mean ± SEM. Statistical significance was determined by ANOVA test with Tukey post-hoc analysis, ***p < 0.001; NS: not significant.
Figure 5.
Figure 5.. AIMP2 is required for PFF-induced α-synuclein aggregation and toxicity in vivo.
(A) Schematics of in vivo PFF and AAV viruses (expressing AIMP2, α-synuclein, shAIMP2, or shControl) injections to 2 month old C57/BL6 mice. Experimental schedules for virus or PFF injections and perfusion are indicated (B) TH immunohistochemistry of SN sections from the indicated mouse groups. (C) Stereological counting of dopamine neurons in the SN pars compacta of the indicated experimental mouse groups (n = 4 mice per group). (D) Immunofluorescence images showing pS129-α-synuclein and TH expression in the SN of each experimental group. Note, rAAV-shControl and rAAV-shAIMP2 co-express reporter fluorescence GFP and RFP, respectively. pS129-α-synuclein signal is pseudo-colored in white in this image. (E) Quantification of relative pS129-α-synuclein signal intensities in the VM from the indicated experimental groups (n = 20~29 cells from 4 mice per group). (F) Quantification of relative pS129-α-synuclein signal intensities in TH-positive dopaminergic neurons of the VM from the indicated experimental groups (n = 60 dopamine cells from 4 mice per group). (G) Representative exploration paths of mice from each group in the open field test. (H) Assessment of anxiety in each experimental mouse group determined by % of exploration distance in the center zone (n = 4 per group). (I) Assessment of bradykinesia in each experimental mouse group monitored by measuring the time taken to descend the vertical pole in pole test (n = 4 mice per group). (J) Motor coordination of each experimental mouse group determined by latency to fall in accelerating rotarod test (n = 4 mice per group). Quantified data are expressed as mean ± SEM. Statistical significance was determined by ANOVA test with Tukey post-hoc analysis, *p < 0.05, **p < 0.01, and ***p < 0.001; NS: not significant.
Figure 6.
Figure 6.. AIMP2 is required for 6-OHDA-induced α-synuclein aggregation and toxicity in vivo.
(A) Schematics of in vivo 6-OHDA striatal injection to 2 month old heterozygous Aimp2 KO mice (Aimp2 Het) or wild type littermate control (WT). Experimental schedules for western blot (WB), IHC, and TH stereology are indicated. (B) Western blots of AIMP2, α-synuclein, and filament conformation α-synuclein expression in Triton X-100 soluble and insoluble fractions of the VM from the indicated experimental mouse groups. (C) Quantification of relative amounts of AIMP2, α-synuclein, and filament conformation α-synuclein expression in insoluble fractions normalized to those in soluble fractions from sample groups in panel B (n = 3 mice per group). (D) Neuropathological assessment of phosphorylated α-synuclein-positive inclusions in mouse brains of each experimental group monitored by immunohistochemistry using pS129 α-synuclein antibody and Nissl counter staining. Quantification of pS129-α-Syn immunohistochemistry (n = 6 slides from 3 mice per group, right panel). (E) Representative immunofluorescence images showing pS129-α-synuclein and TH (pseudo-colored for original green fluorescence) expression in the SN of each experimental mouse group. Quantification of pS129-α-Syn immunofluorescence in TH-positive cells (n = 20 cells from 3 mice per group, bottom panel). (F) TH immunohistochemistry images of SN sections from the indicated experimental mouse groups. (G) Stereological counting of dopamine neurons in the SN pars compacta of each experimental mouse group (n = 5~6 mice per group). Quantified data are expressed as mean ± SEM. Statistical significance was determined by ANOVA test with Tukey post-hoc analysis, *p < 0.05, and ***p < 0.001.
Figure 7.
Figure 7.. Insoluble co-aggregation of α-synuclein with AIMP2 in human PD brains
(A) Distribution of AIMP2 and phosphorylated α-synuclein (pS129-α-syn) in NP-40 soluble and insoluble fractions prepared from postmortem human brains of patients with PD and age matched controls based on Western blot analysis. (B) Relative distribution of AIMP2 and phosphorylated α-synuclein (pS129-α-syn) into each fractions normalized to β-actin (n = 5 per group). (C) Co-aggregation of AIMP2 (pseudo-colored for original green fluorescence) into LB inclusions in temporal lobe from postmortem PD brains monitored by immunofluorescence. Quantification of AIMP2 and pS129-α-Syn immunofluorescence (n = 12 slides from 4 Con and 12 slides from 4 PD, right panel). (D) Confocal microscopic and Z-stack images showing colocalization of AIMP2 (pseudo-colored for original green fluorescence) in the pS129 α-synuclein-positive LB in PD human brain samples. % puncta ratio composed of AIMP2 or/and phosphorylated α-synuclein (n = 21 cells from 4 PD, right panel) (E) Ultrastructure of inclusion and colabeling of AIMP2 and pS129-α-synuclein by nanogold particles for postmortem human PD brain tissues determined by an immunoGold EM. 10 nm and 5 nm nanogold particles were used to detect anti-AIMP2 and anti-pS129-α-synuclein antibodies, respectively. Composition ratio of AIMP2 and pS129-α-Syn in inclusion structures (n = 26 inclusions from 4 PD, right panel). Quantified data are expressed as mean ± SEM. Statistical significance was determined by ANOVA test with Tukey post-hoc analysis or unpaired two-tailed Student’s t-test, *p < 0.05, **p < 0.01, and ***p < 0.001.

Similar articles

Cited by

References

    1. Spillantini MG, Goedert M, The alpha-synucleinopathies: Parkinson’s disease, dementia with Lewy bodies, and multiple system atrophy. Ann N Y Acad Sci 920, 16–27 (2000). - PubMed
    1. Lang AE, Lozano AM, Parkinson’s disease. Second of two parts. N Engl J Med 339, 1130–1143 (1998). - PubMed
    1. Lang AE, Lozano AM, Parkinson’s disease. First of two parts. N Engl J Med 339, 1044–1053 (1998). - PubMed
    1. Norris EH, Giasson BI, Lee VM, Alpha-synuclein: normal function and role in neurodegenerative diseases. Curr Top Dev Biol 60, 17–54 (2004). - PubMed
    1. Brahmachari S, Ge P, Lee SH, Kim D, Karuppagounder SS, Kumar M, Mao X, Shin JH, Lee Y, Pletnikova O, Troncoso JC, Dawson VL, Dawson TM, Ko HS, Activation of tyrosine kinase c-Abl contributes to alpha-synuclein-induced neurodegeneration. J Clin Invest 126, 2970–2988 (2016). - PMC - PubMed

Publication types