. 2020 Dec 1;117(48):30285-30294.
doi: 10.1073/pnas.2014297117. Epub 2020 Nov 11.

Network interventions for managing the COVID-19 pandemic and sustaining economy

Affiliations

Network interventions for managing the COVID-19 pandemic and sustaining economy

Akihiro Nishi et al. Proc Natl Acad Sci U S A. .

Abstract

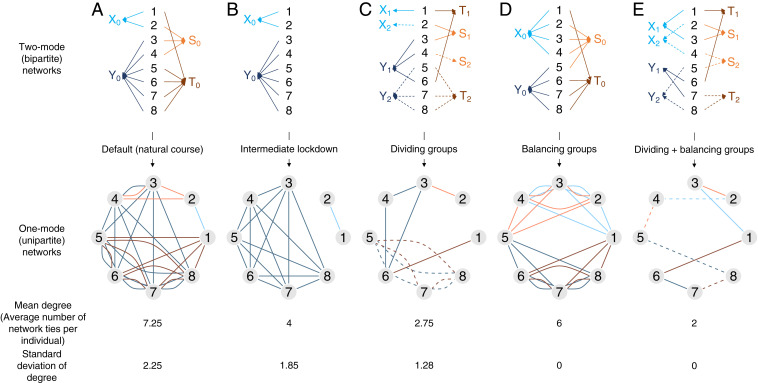
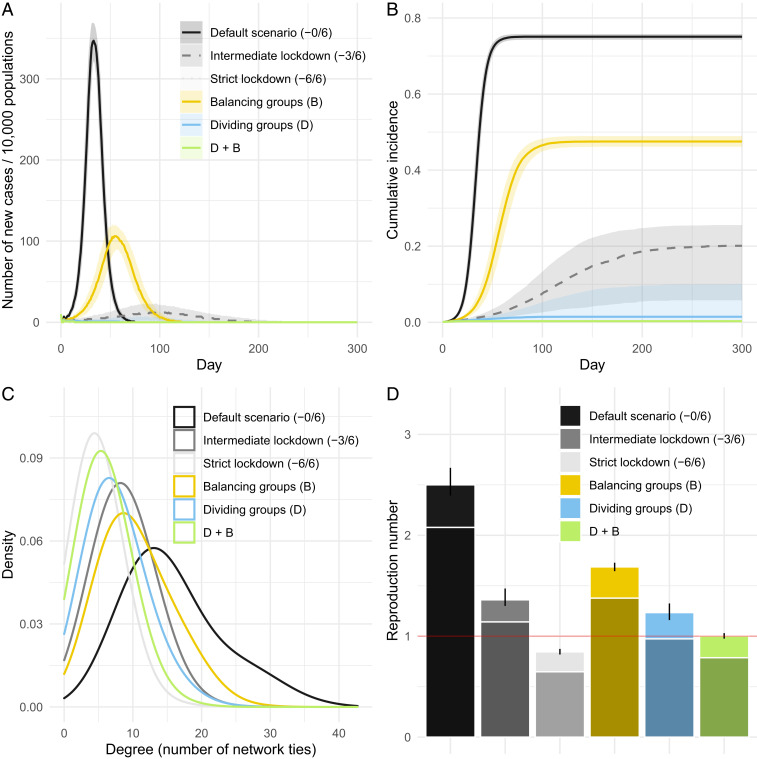
Sustaining economic activities while curbing the number of new coronavirus disease 2019 (COVID-19) cases until effective vaccines or treatments become available is a major public health and policy challenge. In this paper, we use agent-based simulations of a network-based susceptible-exposed-infectious-recovered (SEIR) model to investigate two network intervention strategies for mitigating the spread of transmission while maintaining economic activities. In the simulations, we assume that people engage in group activities in multiple sectors (e.g., going to work, going to a local grocery store), where they interact with others in the same group and potentially become infected. In the first strategy, each group is divided into two subgroups (e.g., a group of customers can only go to the grocery store in the morning, while another separate group of customers can only go in the afternoon). In the second strategy, we balance the number of group members across different groups within the same sector (e.g., every grocery store has the same number of customers). The simulation results show that the dividing groups strategy substantially reduces transmission, and the joint implementation of the two strategies could effectively bring the spread of transmission under control (i.e., effective reproduction number ≈ 1.0).

Keywords: COVID-19; agent-based simulation; network interventions; pandemic preparedness.


Conflict of interest statement

Competing interest statement: A.N. is a consultant to Urbanic & Associates. A.E. received a research grant from Taisho Pharmaceutical Co., Ltd.

Figures

Fig. 1.
Fig. 1.
The two network intervention strategies (dividing groups and balancing groups). The flow is AB, AC, AD, and CE. We display a hypothetical network of eight people across two sectors (groups X and Y are in the same sector, and groups S and T are in the same sector). In the simulation, we used a network of 10,000 people across eight sectors. The two-mode networks (Top) show the distribution of group activities and sectors in which each subject (IDs 1 to 8) participates. For example, ID1 belongs to X0 (e.g., go to workplace X0) and T0 (e.g., go to supermarket T0) and regularly engages in his or her activities (e.g., working and shopping, respectively) at the appropriate locations (X0 and T0). The two-mode networks can be converted to one-mode networks (Bottom), in which a shared group connects two individuals. For example, ID1 and ID2 may be involved in transmission at X0 and the network tie between ID1 and ID2. A network tie in one-mode networks represents a chance of transmission, while an arrow in two-mode networks represents an individual going to a location and engaging in economic activities. In this example, the mean degree (number of the network ties per individual) and its variation (SD) are smaller when dividing groups (AC) and balancing groups (AD).
Fig. 2.
Fig. 2.
The results of agent-based simulations. (A) Incidence dynamics over 300 d. The lines and shades represent medians and interquartile ranges for 1,000 iterations of our simulation. The curves for the strict lockdown scenario and others are invisible because they are located near the x axis (this also occurs in B). The legend for A is shared with B. (B) Cumulative incidence dynamics over 300 d. (C) Degree distributions (density plots) in each scenario. Distributions are drawn using a single random seed for illustration purposes. (D) The network-based reproduction number in each scenario. Error bars represent the 95% QRs obtained from 1,000 simulations. The top, light parts of the bars show the increment effect due to the SD in the degree distribution (see Converting R0 to β for Agent-Based Simulations for details). The red horizontal line represents a reproduction number of 1.

Comment in

  • Considering network interventions.
    Centola D. Centola D. Proc Natl Acad Sci U S A. 2020 Dec 29;117(52):32833-32835. doi: 10.1073/pnas.2022584118. Epub 2020 Dec 21. Proc Natl Acad Sci U S A. 2020. PMID: 33376213 Free PMC article. No abstract available.

References

    1. Valente T. W., Network interventions. Science 337, 49–53 (2012). - PubMed
    1. Centola D., The spread of behavior in an online social network experiment. Science 329, 1194–1197 (2010). - PubMed
    1. Organisation for Economic Co-operation and Development , Flattening the COVID-19 peak: Containment and mitigation policies. http://www.oecd.org/coronavirus/policy-responses/flattening-the-covid-19.... Accessed 20 April 2020.
    1. Ferguson N. M., et al. , “Impact of non-pharmaceutical interventions (NPIs) to reduce COVID-19 mortality and healthcare demand” (Rep. 9, Imperial College London, 2020). - PMC - PubMed
    1. Koo J. R., et al. , Interventions to mitigate early spread of SARS-CoV-2 in Singapore: A modelling study. Lancet Infect. Dis. 20, 678–688 (2020). - PMC - PubMed

Publication types

LinkOut - more resources