. 2020 Nov 11;12(21):21544-21558.
doi: 10.18632/aging.103943. Epub 2020 Nov 11.

TCGA and ESTIMATE data mining to identify potential prognostic biomarkers in HCC patients

Affiliations

TCGA and ESTIMATE data mining to identify potential prognostic biomarkers in HCC patients

Guolin He et al. Aging (Albany NY). .

Abstract

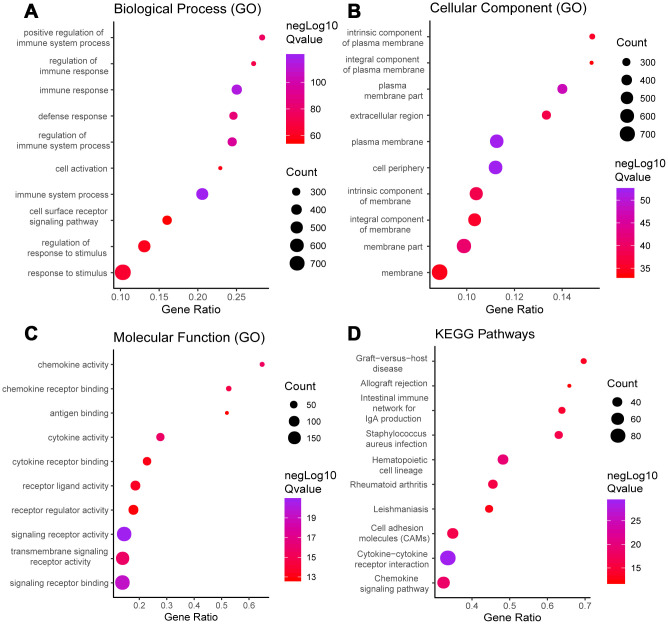
Hepatocellular carcinoma (HCC) is an aggressive form of cancer characterized by a high recurrence rate following resection. Studies have implicated stromal and immune cells, which form part of the tumor microenvironment, as significant contributors to the poor prognoses of HCC patients. In the present study, we first downloaded gene expression datasets for HCC patients from The Cancer Genome Atlas database and categorized the patients into low and high stromal or immune score groups. By comparing those groups, we identified differentially expressed genes significantly associated with HCC prognosis. The Gene Ontology database was then used to perform functional enrichment analysis, and the STRING network database was used to construct protein-protein interaction networks. Our results show that most of the differentially expressed genes were involved in immune processes and responses and the plasma membrane. Those results were then validated using another a dataset from a HCC cohort in the Gene Expression Omnibus database and in 10 pairs of HCC tumor tissue and adjacent nontumor tissue. These findings enabled us to identify several tumor microenvironment-related genes that associate with HCC prognosis, and some those appear to have the potential to serve as HCC biomarkers.

Keywords: GEO; TCGA; disease-free survival; immune scores; tumor microenvironment.


Conflict of interest statement

CONFLICTS OF INTEREST: The authors declare there is no conflicts of interest regarding the publication of this paper.

Figures

Figure 1
Figure 1
Immune scores and stromal scores are associated with HCC disease-free survival. (A) TCGA liver cancer expression profile data using ESTIMATE method to calculate immune score and matrix score. Box-plot shows that the level of Immune scores and stromal scores. (B) Heatmap of the DEGs of immune scores of top half (high score) vs. bottom half (low score). p<0.05, fold change >1). Genes with higher expression are shown in red, lower expression are shown in green, genes with same expression level are in black. (C) HCC cases were divided into two groups based on their immune scores. Median disease-free survival of the high score group is longer than low score group (log-rank test, p<0.05). (D) Similarly, HCC cases were divided into two groups based on their stromal scores. The median disease-free survival of the low score group is longer than the high score group (log-rank test p=0.43), however, it is not statistically different.
Figure 2
Figure 2
GO term and KEGG pathway analysis for all DEGs. Top 10 GO terms. False discovery rate (FDR) of GO analysis was acquired from STRING database. p <0.05. (A) biological process, (B) cellular component, (C) molecular function, and (D) KEGG pathway.
Figure 3
Figure 3
Correlation of expression of individual DEGs in disease-free survival in TCGA. Kaplan-Meier survival curves were generated for selected DEGs extracted from the comparison of groups of high (red line) and low (blue line) gene expression. p<0.05 in Log-rank test. DFS, disease-free survival.
Figure 4
Figure 4
(A) The whole PPI networks of the 214 predictive DEGs. (B) The module 1 of the two most significant modules in the whole PPI network. (C) The module 2 of the two most significant modules in the whole PPI network.
Figure 5
Figure 5
GO term and KEGG pathway analysis for DEGs significantly associated with disease-free survival. Top pathways with FDR < 0.05, -log FDR >1.301 are shown: (A) biological process, (B) cellular component, (C) molecular function, and (D) KEGG pathway.
Figure 6
Figure 6
Validation of DEGs extracted from TCGA database with disease-free survival in GEO cohort. Kaplan-Meier survival curves were generated for selected DEGs extracted from the comparison of groups of high (red line) and low (blue line) gene expression. p<0.05 in Log-rank test. DFS, disease-free survival.
Figure 7
Figure 7
Verification of these 8 interested DEGs in clinical samples. Relative mRNA levels of 8 genes in 10 HCC samples were frequently overexpressed in nontumor tissues compared with matched HCC tissues(p<0.05) by qRT-PCR except CD3E.
Figure 8
Figure 8
Correlation between expression of interested DEGs and immune checkpoint gene. Pearson correlation of expression and ImmuneScore dataset. The all 8 interested genes had significant correlation(p<0.05), especially CD3E, ITK and TRAF3IP3. X-axis represented expression level of 8 interested genes in each sample. Y-axis represented expression level of PDCD1 in each sample.

References

    1. Waly Raphael S, Yangde Z, Yuxiang C. Hepatocellular carcinoma: focus on different aspects of management. ISRN Oncol. 2012; 2012:421673. 10.5402/2012/421673 - DOI - PMC - PubMed
    1. McGlynn KA, London WT. The global epidemiology of hepatocellular carcinoma: present and future. Clin Liver Dis. 2011; 15:223–43. 10.1016/j.cld.2011.03.006 - DOI - PMC - PubMed
    1. Lee JG, Kang CM, Park JS, Kim KS, Yoon DS, Choi JS, Lee WJ, Kim BR. The actual five-year survival rate of hepatocellular carcinoma patients after curative resection. Yonsei Med J. 2006; 47:105–12. 10.3349/ymj.2006.47.1.105 - DOI - PMC - PubMed
    1. Hernandez-Gea V, Toffanin S, Friedman SL, Llovet JM. Role of the microenvironment in the pathogenesis and treatment of hepatocellular carcinoma. Gastroenterology. 2013; 144:512–27. 10.1053/j.gastro.2013.01.002 - DOI - PMC - PubMed
    1. Wu T, Dai Y. Tumor microenvironment and therapeutic response. Cancer Lett. 2017; 387:61–68. 10.1016/j.canlet.2016.01.043 - DOI - PubMed

Publication types

MeSH terms

Substances