. 2020 Nov 11;11(1):5704.
doi: 10.1038/s41467-020-19555-6.

MEKK2 mediates aberrant ERK activation in neurofibromatosis type I

Affiliations

MEKK2 mediates aberrant ERK activation in neurofibromatosis type I

Seoyeon Bok et al. Nat Commun. .

Abstract

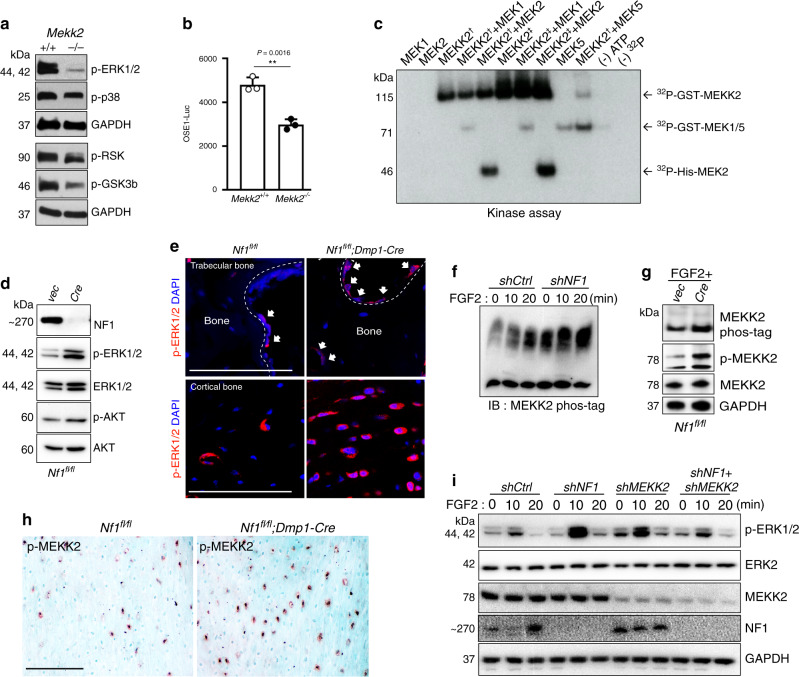
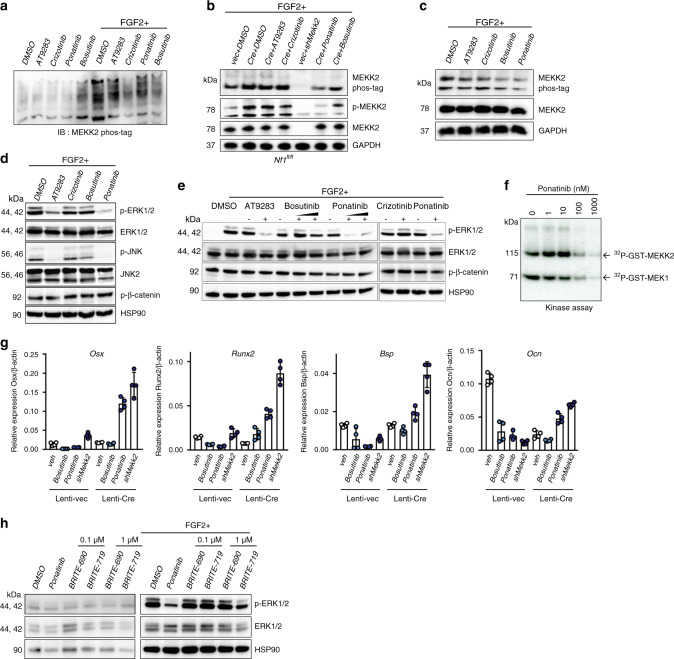
Neurofibromatosis type I (NF1) is characterized by prominent skeletal manifestations caused by NF1 loss. While inhibitors of the ERK activating kinases MEK1/2 are promising as a means to treat NF1, the broad blockade of the ERK pathway produced by this strategy is potentially associated with therapy limiting toxicities. Here, we have sought targets offering a more narrow inhibition of ERK activation downstream of NF1 loss in the skeleton, finding that MEKK2 is a novel component of a noncanonical ERK pathway in osteoblasts that mediates aberrant ERK activation after NF1 loss. Accordingly, despite mice with conditional deletion of Nf1 in mature osteoblasts (Nf1fl/fl;Dmp1-Cre) and Mekk2-/- each displaying skeletal defects, Nf1fl/fl;Mekk2-/-;Dmp1-Cre mice show an amelioration of NF1-associated phenotypes. We also provide proof-of-principle that FDA-approved inhibitors with activity against MEKK2 can ameliorate NF1 skeletal pathology. Thus, MEKK2 functions as a MAP3K in the ERK pathway in osteoblasts, offering a potential new therapeutic strategy for the treatment of NF1.


Conflict of interest statement

The authors declare no competing interests.

Figures

Fig. 1
Fig. 1. The MAP3K MEKK2 contributes to the aberrant ERK activation occurring with NF1 loss.
a ERK phosphorylation levels were assessed by immunoblotting in primary COBs isolated from Mekk2+/+ and Mekk2−/− mice. Cell lysates were immunoblotted with the indicated antibodies. b Primary Mekk2+/+ and Mekk2−/− COBs were transfected with the OSE1-Luc (ATF4) reporter (n = 3 biologically independent samples). Mean ± s.e.m., unpaired, two-tailed Student’s t test: **P < 0.01. c Purified unactivated GST-MEK1 or His-MEK2 was incubated with purified GST-MEKK2 and an in vitro kinase assay was conducted. Two types of recombinant GST-tagged MEKK2 as indicated with a dagger and double dagger were used as described in the Methods section. GST-MEK5 was used as a positive control. d Representative blot from three independent experiments. Primary Nf1fl/fl COBs infected with either vector (Vec) or Cre lentivirus, were cultured for 7 days under differentiation conditions. Levels of NF1, phospho-ERK1/2, and ERK1/2 were analyzed by immunoblotting. e Representative images of immunostaining for p-ERK (red) in femurs from 16 weeks old Nf1fl/fl and Nf1fl/fl;Dmp1-Cre mice. White arrows indicate p-ERK positive osteoblasts. Nuclei are counterstained with DAPI (blue) and scale bar indicates 100 µm. Three independent fields were examined per mouse (n = 3 mice per group). f human MSCs (hMSCs) were infected with shRNA lentiviruses expressing control (shCtrl) or NF1 (shNF1) targeting shRNAs and stimulated with FGF2 (25 ng/ml) for the indicated times, then MEKK2 phosphorylation was analyzed by phos-tag electrophoresis. g MEKK2 phosphorylation was analyzed by either phos-tag electrophoresis or immunoblotting with p-MEKK2 antibody in primary Nf1fl/fl osteoblasts infected with either vec or Cre lentivirus cultured for 14 days under differentiation conditions. All blotting was confirmed by at least three independent repeats. h Immunohistochemistry for p-MEKK2 was performed in femurs from 16-week-old Nf1fl/fl and Nf1fl/fl;Dmp1-Cre mice. Scale bar denotes 100 µm. Three independent fields were examined per mouse (n = 3 mice per group). i hMSCs were infected with the indicated shRNA lentiviruses and then stimulated with FGF2 for the indicated times before immunoblotting, and ERK1/2 activation was analyzed by immunoblotting. Except where otherwise indicated, all data shown are representative of at least two independent experiments. All unprocessed blots are provided in Supplementary Fig. 5. Source data are provided as a Source Data file.
Fig. 2
Fig. 2. MEKK2 deficiency partially reverses NF1-associated skeletal pathology in mice.
a Femurs from 16-week-old Nf1fl/fl, Nf1fl/fl;Mekk2−/−, Nf1fl/fl;Dmp1-Cre, and Nf1fl/fl;Mekk2−/−;Dmp1-Cre mice were analyzed by μCT. b Quantitative parameters are porous volume, porosity (porous volume/total volume), and porous surface from 16-week-old Nf1fl/fl (n = 5), Nf1fl/fl;Mekk2−/− (n = 8), Nf1fl/fl;Dmp1-Cre (n = 8), and Nf1fl/fl;Mekk2−/−;Dmp1-Cre (n = 10) mice. Mean ± s.d., one-way ANOVA with Tukey’s multiple comparison test. c Representative μCT 3D-reconstuction images of trabecular bone in the distal femur metaphysis. d Quantitative parameters include trabecular bone volume/total volume (BV/TV), thickness (Tb.Th), trabecular number (Tb.N), and spacing (Tb.sp) in 16-week-old Nf1fl/fl (n = 8), Nf1fl/fl;Mekk2−/− (n = 6), Nf1fl/fl;Dmp1-Cre (n = 9), and Nf1fl/fl;Mekk2−/−;Dmp1-Cre (n = 8) mice. mean ± s.d., one-way ANOVA with Tukey’s multiple comparison test. e μCT scans of mouse skulls at 16 weeks Nf1fl/fl, Nf1fl/fl;Mekk2−/−, Nf1fl/fl;Dmp1-Cre, and Nf1fl/fl;Mekk2−/−;Dmp1-Cre mice. f Serum levels of P1NP, CTX, FGF23, PTH, 25(OH) vitamin D, and phosphate in 16-week-old mice. Data are represented as box plots with the middle line representing the median, the box representing the 95% confidence interval of the median, and the whiskers representing the range. Each dot represents a separate mouse. g Representative images and quantification of immunostaining for p-MEKK2 (green), p-MEK1 (magenta), and p-ERK (red) in trabecular (left panels) and cortical bone (right panels) from 16-week-old Nf1fl/fl, Nf1fl/fl;Dmp1-Cre, and Nf1fl/fl;Mekk2−/−;Dmp1-Cre mice. Nuclei are counterstained with DAPI (blue) and the scale bar indicates 100 µm. Three independent fields were examined per mouse (n = 3 mice per group). mean ± s.d., one-way ANOVA with Tukey’s multiple comparison test. *P < 0.05; **P < 0.01; ***P < 0.001; ****P < 0.0001.
Fig. 3
Fig. 3. Pharmacologic inhibition of MEKK2 prohibits ERK activation.
a Primary COBs were immortalized through infection with a retrovirus expressing SV40 large T-Antigen. COBs were pre-treated with the indicated inhibitors (1 µM, 30 min), then stimulated with or without FGF2 (25 ng/ml, 20 min) 30 min later. MEKK2 phosphorylation was analyzed by phos-tag electrophoresis. b MEKK2 phosphorylation was analyzed by either phos-tag electrophoresis or immunoblotting with anti-p-MEKK2 in primary Nf1fl/fl osteoblasts infected with either vec or Cre lentivirus with the indicated inhibitors and FGF2 stimulation. c hMSCs were treated with the indicated inhibitors, then MEKK2 phosphorylation was examined by phos-tag electrophoresis. d WT immortalized COBs were lysed and immunoblotted for the indicated antibodies after inhibitor treatment. e Activation of ERK was detected in Saos-2 cells after incubation with the indicated inhibitors and stimulation with or without FGF2. f Purified unactivated GST-MEK1 was incubated with purified GST-MEKK2 and the indicated doses of ponatinib, and kinase activity of MEKK2 was analyzed by an in vitro kinase assay. g Expression levels of osteoblast genes in primary Nf1fl/fl osteoblasts infected with either vec or Cre lentivirus. After infection, these cells are treated with the indicated inhibitors or a Mekk2-targeting shRNA and cultured for 14 days (n = 4 biologically independent samples). mean ± s.d. h Saos-2 cells were treated with DMSO, ponatinib (1 µM), BRITE-0600690 (BRITE-690, inactive compound), and BRITE-0600719 (BRITE-719, active compound) for 1 h with or without FGF2 stimulation. Phosphorylation levels of ERK1/2 were assessed by immunoblotting. All data shown are representative of either two or three total independent experiments. All unprocessed blots are provided in Supplementary Fig. 5. Source data are provided as a Source Data file.
Fig. 4
Fig. 4. Inhibition of MEKK2 ameliorates skeletal defects in a mouse model of skeletal NF1.
a Femurs from 16-week-old Nf1fl/fl mice treated with vehicle (n = 4) or ponatinib (n = 5) and Nf1fl/fl;Dmp1-Cre mice treated with vehicle (n = 7) or ponatinib (n = 6) were analyzed by μCT. b Quantitative parameters are porous volume, porosity (porous volume/total volume), and porous surface from vehicle (veh) and ponatinib-treated groups (pon) of Nf1fl/fl;Dmp1-Cre mice. Mean ± s.d., one-way ANOVA with Tukey’s multiple comparison test. c Representative μCT 3D-reconstruction images of trabecular bone in the distal femur metaphysis. d Relative quantitative analysis of trabecular BV/TV, thickness (Tb.Th), trabecular number (Tb.N), and spacing (Tb.sp) in vehicle (n = 8) and ponatinib-treated (n = 7) group of Nf1fl/fl;Dmp1-Cre. Mean ± s.d., unpaired, two-tailed Student’s t test. e μCT scans of mouse skulls in 16-week-old Nf1fl/fl and Nf1fl/fl;Dmp1-Cre mice treated with vehicle or ponatinib. f Serum levels of PINP, 25(OH) vitamin D, and phosphate in 16-week-old Nf1fl/fl and Nf1fl/fl;Dmp1-Cre mice treated with vehicle (veh) or ponatinib (pon). Data are represented as box plots with the middle line representing the median, the box representing the 95% confidence interval of the median, and the whiskers representing the range. Each dot represents a separate mouse. g Representative immunofluorescent images and quantification for p-MEKK2 (green), p-MEK1 (magenta), and p-ERK (red) in femurs from 16-week-old Nf1fl/fl (WT) and Nf1fl/fl;Dmp1-Cre mice treated with vehicle or ponatinib. Far right images show enlarged views of the dotted orange boxes. White arrows indicate signal positive osteoblasts. Nuclei are counterstained with DAPI (blue) and the scale bar indicates 100 µm. Three independent fields were examined per mouse (n = 3 mice per group). Mean ± s.d., one-way ANOVA with Tukey’s multiple comparison test. *P < 0.05; **P < 0.01; ***P < 0.001; ****P < 0.0001. Source data are provided as a Source Data file.

References

    1. Cichowski K, Jacks T. NF1 tumor suppressor gene function: narrowing the GAP. Cell. 2001;104:593–604. - PubMed
    1. De La Croix Ndong J, et al. Combined MEK inhibition and BMP2 treatment promotes osteoblast differentiation and bone healing in Nf1Osx−/− mice. J. Bone Miner. Res. 2015;30:55–63. - PMC - PubMed
    1. Chang T, et al. Sustained MEK inhibition abrogates myeloproliferative disease in Nf1 mutant mice. J. Clin. Invest. 2013;123:335–339. - PMC - PubMed
    1. Staser K, et al. Normal hematopoiesis and neurofibromin- deficient myeloproliferative disease require Erk. J. Clin. Invest. 2013;123:329–334. - PMC - PubMed
    1. Dombi E, et al. Activity of selumetinib in neurofibromatosis type 1–related plexiform neurofibromas. N. Engl. J. Med. 2016;375:2550–2560. - PMC - PubMed

Publication types

MeSH terms