. 2020 Nov 11;7(1):385.
doi: 10.1038/s41597-020-00689-7.

A late Pleistocene dataset of Agulhas Current variability

Affiliations

A late Pleistocene dataset of Agulhas Current variability

Margit H Simon et al. Sci Data. .

Abstract

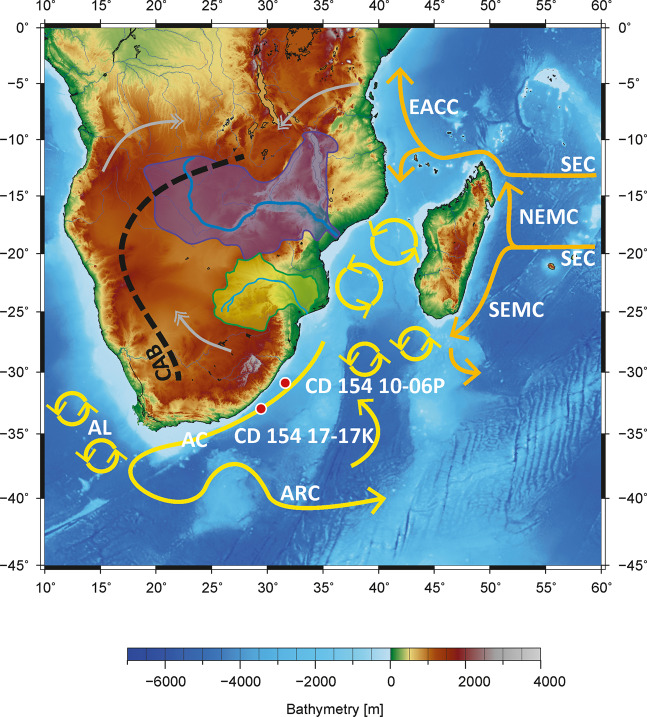
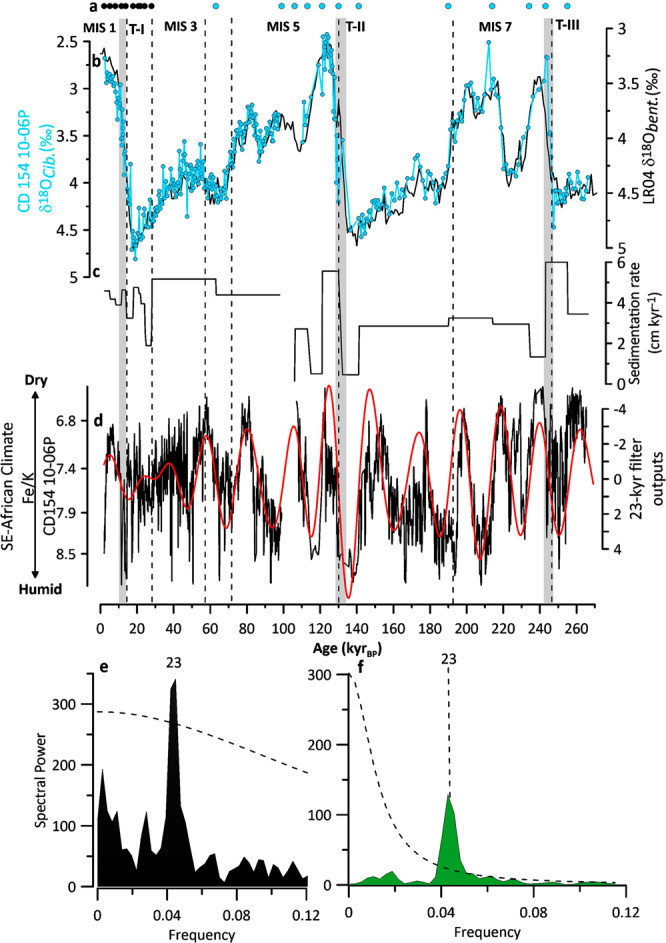
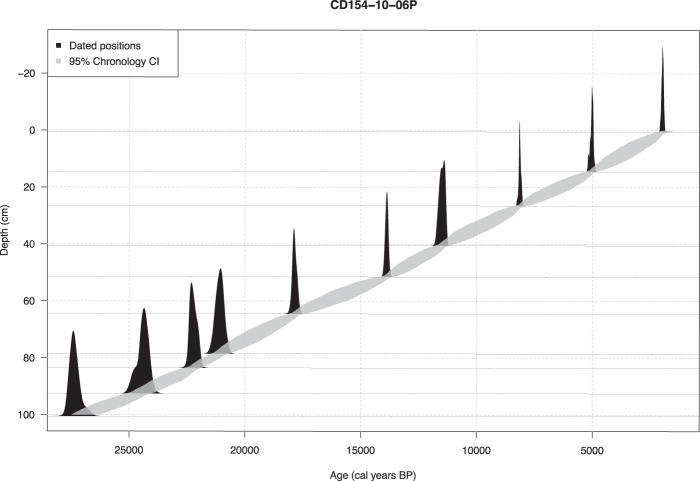
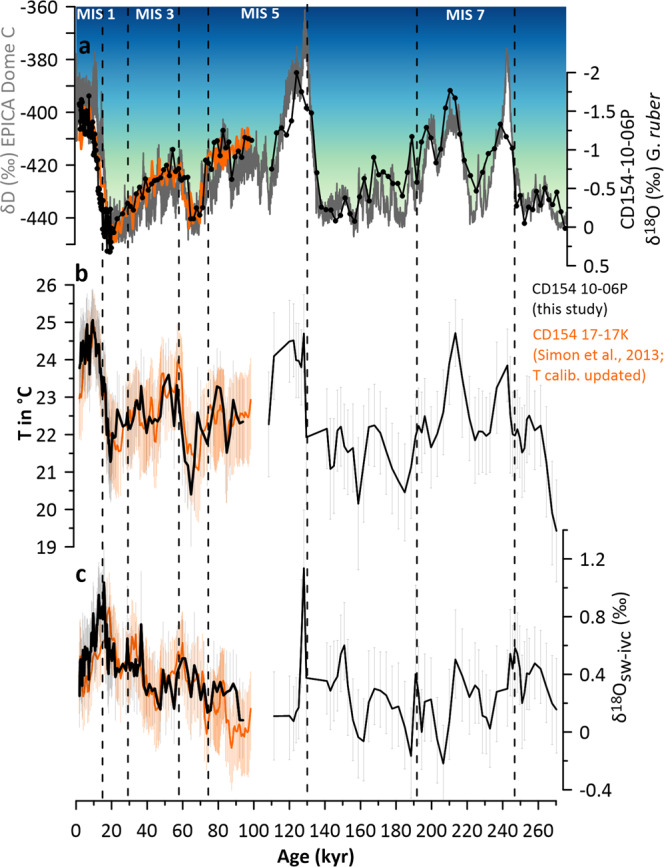
The interocean transfer of thermocline water between the Indian and the Atlantic Oceans known as 'Agulhas leakage' is of global significance as it influences the Atlantic Meridional Overturning Circulation (AMOC) on different time scales. Variability in the Agulhas Current regime is key in shaping hydroclimate on the adjacent coastal areas of the African continent today as well as during past climates. However, the lack of long, continuous records from the proximal Agulhas Current region dating beyond the last glacial cycle prevents elucidation of its role in regional and wider global climate changes. This is the first continuous record of hydrographic variability (SST; δ18Osw) from the Agulhas Current core region spanning the past 270,000 years. The data set is analytical sound and provides a solid age model. As such, it can be used by paleoclimate scientists, archaeologists, and climate modelers to evaluate, for example, linkages between the Agulhas Current system and AMOC dynamics, as well as connections between ocean heat transport and Southern African climate change in the past and its impact on human evolution.


Conflict of interest statement

The authors declare no competing interests.

Figures

Fig. 1
Fig. 1
Location map of Site CD154 10-06 P (this study) and CD154 17-17 K with main surface currents (arrows) in the southwest Indian Ocean and atmospheric circulation over southern Africa during austral summer (December, January, February) with the approximate position of the Congo Air Boundary (CAB) (dashed lines; adapted from Reason et al., 2006). AC = Agulhas Current, AL = Agulhas Leakage; SEC = South Equatorial Current, SEMC = South East Madagascar Current, NEMC = North East Madagascar Current, EACC = East Africa Coastal Current, ARC = Agulhas Return Current. Purple shading = Zambezi River Catchment, green shading = Limpopo River Catchment, gray double-headed arrows = main pathways of moisture supply to the African continent from the northwest Atlantic (through Congo) and the northwest and the south-west Indian Ocean. Map Adapted from Hall, et al..
Fig. 2
Fig. 2
Initial Age model for core CD154 10-06 P. (a) Age control points for CD154-10-06P, including radiocarbon dates (black) tuning of the foraminiferal δ18O record to LR04 (black) (b) Benthic foraminiferal (Cibicidoides spp.) δ18O record from CD154-10-06P (blue), reflecting global ice volume variability and local deep-water conditions, in comparison with global benthic stack LR04 (black). Marine isotope stages (MIS) are indicated, Underlying grey bars indicate glacial-interglacial Terminations (T) (c) Sedimentation rate in cm kyr-1 (d) Fe/K of CD 154 10-06 P (black, 5 point running mean) with 23-kyr Gaussian filter on top (red) (e) Power spectra calculated with the REDFIT-sofware for Fe/K record of core CD154 10-06 P (black) and (f) Chinese speleothems δ18O record (green), red noise boundaries were estimated as upper 99% chi-squared limits of a fitted AR1 process. Bandwidth is 0.0186. Precession band (23-kyr) is highlighted.
Fig. 3
Fig. 3
The Bayesian age model obtained by Bchron (black) for the top 100 cm of CD154 10-06 P incorporating a reservoir uncertainty of 405 years (ΔR = 0). Each date is represented by the probability distribution of the intersection between the radiocarbon ages at those depths and the Marine13 calibration curve. The grey shaded area indicates the credible interval (CI) of the 95% probability based on the calibrated dates using the Bayesian statistical package Bchron.
Fig. 4
Fig. 4
The palaeocenanographic records of core CD154 10-06 P in the main flow path of the Agulhas Current system. (a) Comparison of the planktic δ18O record (black) of core CD154 10-06 P (black) and upstream site CD154 17-17 K (orange) with the Antarctic European Project for Ice Coring in Antarctica (EPICA) ice-core δD Antarctica (EPICA) temperature variability as inferred from δD ice record δ18O record (b) Mg/Ca-based SSTs record of CD154 10-06 P (black) in comparison with upstream site CD154 17-17 K (orange) using PSU Solver output of Mg/Ca-SST-SSS calibration equation based on a compilation of cultured data with corresponding 2σ confidence intervals (c) PSU Solver δ18Osw-ivc record indicating inferred relative salinity changes (black) in comparison with upstream site CD154 17-17 K (orange) with corresponding 2σ confidence intervals. Thick black and orange lines are the mean values of the PSU Solver output. Black dashed lines indicate Marine Isotope Stage boundaries.
Fig. 5
Fig. 5
Quality control for Mg/Ca measurements (a) G. ruber Mg/Ca ratios (mmol mol−1) (black circle) (b) Fe/Mg (mol mol−1) (brown), Al/Mg (mol mol−1) (green) and Mn/Mg (mol mol−1) (blue) ratios; (c) Fe/Mg (mol mol−1) (brown) versus Mg/Ca ratios (mmol mol−1) and their coefficient of determination R2(d) Al/Mg (mol mol−1) (green) versus Mg/Ca ratios (mmol mol−1) and their coefficient of determination R2 (e) Mn/Mg (mol mol−1) (blue) versus Mg/Ca ratios (mmol mol−1) and their coefficient of determination R2; red circled samples have been removed from the data set.
Fig. 6
Fig. 6
(a) Planktic δ18O record (black) with the Antarctic European Project for Ice Coring in Antarctica (EPICA) ice-core δD Antarctica (EPICA) temperature variability as inferred from δD ice record δ18O record (b) Tex86-derived SST record CD 154 10-06 P (grey triangles) reflecting ocean temperature changes in the Agulhas Current, UK’37-derived SST record (orange crosses) from CD 154 10-06 P; G. ruber Mg/Ca ratios (mmol mol−1) and derived SST record using, (black circle), derived SST record calculated from Mg/Ca and pH derived from atmospheric pCO2 following the species‐specific equation given Gray and Evans; (blue). The error envelopes show the combined 2σ; uncertainty from calibration uncertainty and a salinity uncertainty of ±1 PSU (2σ), derived SST record using Mg/Ca-temperature-salinity equation from Tierney, et al. in black, error envelopes show the combined 2σ range.

Dataset use reported in

  • doi: 10.1038/ncomms2897
  • doi: 10.1038/srep18153

References

    1. Lutjeharms JRE. Three decades of research on the greater Agulhas Current. Ocean Sci. Discuss. 2006;3:939–995. doi: 10.5194/osd-3-939-2006. - DOI
    1. Beal LM, De Ruijter WPM, Biastoch A, Zahn R. On the role of the Agulhas system in ocean circulation and climate. Nature. 2011;472:429–436. doi: 10.1038/nature09983. - DOI - PubMed
    1. Gordon AL. Interocean Exchange of Thermocline Water. Journal of Geophysical Research. 1986;91:5037–5046. doi: 10.1029/JC091iC04p05037. - DOI
    1. Rühs S, Schwarzkopf FU, Speich S, Biastoch A. Cold vs. warm water route – sources for the upper limb of the Atlantic Meridional Overturning Circulation revisited in a high-resolution ocean model. Ocean Sci. 2019;15:489–512. doi: 10.5194/os-15-489-2019. - DOI
    1. Rühs S, Durgadoo JV, Behrens E, Biastoch A. Advective timescales and pathways of Agulhas leakage. Geophysical Research Letters. 2013;40:3997–4000. doi: 10.1002/grl.50782. - DOI

Publication types