Observational Study
. 2020 Nov 11;10(1):19527.
doi: 10.1038/s41598-020-75513-8.

Integration of metabolomics and transcriptomics reveals novel biomarkers in the blood for tuberculosis diagnosis in children

Affiliations
Observational Study

Integration of metabolomics and transcriptomics reveals novel biomarkers in the blood for tuberculosis diagnosis in children

Noton K Dutta et al. Sci Rep. .

Abstract

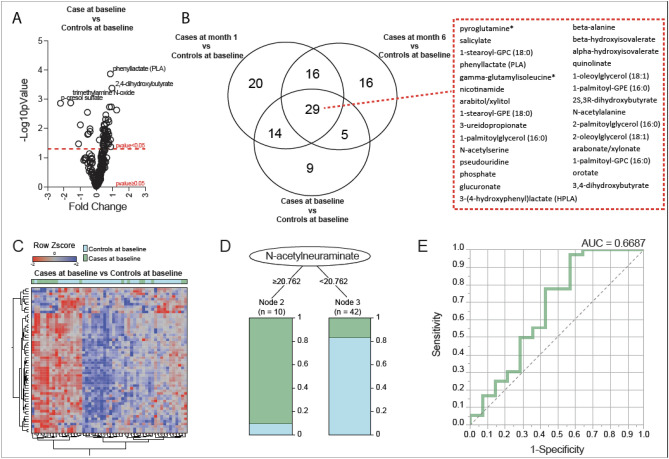
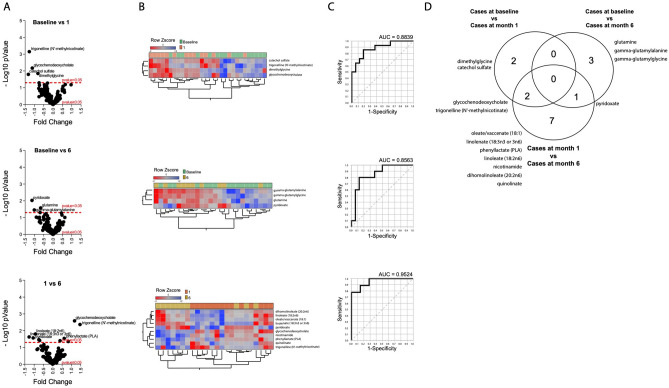
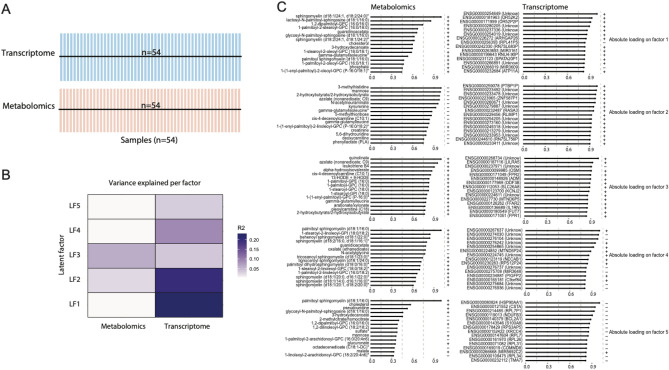
Pediatric tuberculosis (TB) remains a major global health problem. Improved pediatric diagnostics using readily available biosources are urgently needed. We used liquid chromatography-mass spectrometry to analyze plasma metabolite profiles of Indian children with active TB (n = 16) and age- and sex-matched, Mycobacterium tuberculosis-exposed but uninfected household contacts (n = 32). Metabolomic data were integrated with whole blood transcriptomic data for each participant at diagnosis and throughout treatment for drug-susceptible TB. A decision tree algorithm identified 3 metabolites that correctly identified TB status at distinct times during treatment. N-acetylneuraminate achieved an area under the receiver operating characteristic curve (AUC) of 0.66 at diagnosis. Quinolinate achieved an AUC of 0.77 after 1 month of treatment, and pyridoxate achieved an AUC of 0.87 after successful treatment completion. A set of 4 metabolites (gamma-glutamylalanine, gamma-glutamylglycine, glutamine, and pyridoxate) identified treatment response with an AUC of 0.86. Pathway enrichment analyses of these metabolites and corresponding transcriptional data correlated N-acetylneuraminate with immunoregulatory interactions between lymphoid and non-lymphoid cells, and correlated pyridoxate with p53-regulated metabolic genes and mitochondrial translation. Our findings shed new light on metabolic dysregulation in children with TB and pave the way for new diagnostic and treatment response markers in pediatric TB.


Conflict of interest statement

The authors declare no competing interests.

Figures

Figure 1
Figure 1
Differences in plasma metabolites between children with tuberculosis and healthy controls. (A) A volcano plot depicts the log2-fold change in metabolite abundance (x-axis) and the –log10 p-value (y-axis) for each metabolite between children with tuberculosis (“Cases”) and healthy controls at baseline. Positive and negative fold-change differences are depicted on the right and left sides of the graph, respectively. (B) A Venn diagram depicts the number of significantly differentially abundant metabolites for each comparison, including differences between controls and children with tuberculosis (cases) pre-treatment (baseline), mid-treatment (Month 1), and post-treatment (Month 6). (C) A hierarchical cluster analysis was employed to assess overall metabolite abundance between cases and controls. Data were log2-transformed and normalized by row Z-score. (D) A conditional decision tree was used to discriminate cases at the time of TB diagnosis from controls at study enrollment. The single best metabolite to differentiate cases and controls was N-acetylneuraminate. (E) Receiver operator characteristic (ROC) curve analysis demonstrating the sensitivity, specificity, and area under the curve (AUC) of N-acetylneuraminate to discriminate participants by TB status.
Figure 2
Figure 2
Plasma metabolic dysregulation during the treatment of TB in children. Differentially expressed metabolites between pre-treatment (month 0), mid-treatment (month 1), and post-treatment (month 6) samples collected from children with tuberculosis. (A) The volcano plots demonstrate the fold difference in metabolite abundance between study groups on the x-axis and the -log10 p-value of each difference on the y-axis. Extreme values on the x-axis indicate greater differences in abundance and the highest − log10 p-value represents the most significantly altered metabolite. The figures represent the differential abundance of metabolites between treatment months 0 and 1 (top), 0 and 6 (middle), and 1 and 6 (bottom). (B) Heatmaps of Z-score normalized metabolite plasma concentrations for the metabolites that were significantly differentially abundant between study groups. (C) Receiver Operator Characteristics (ROC) curve analysis for the combination of significantly differentially abundant metabolites differentiating children with TB at each time point during treatment. (D) The Venn diagram demonstrates the number of significantly differentially abundant metabolites across comparisons based on months of treatment.
Figure 3
Figure 3
Molecular degree of perturbation among children with tuberculosis during treatment and uninfected controls, by participant age and sex. (A) Histograms show the single sample molecular degree of perturbation (MDP) score values for controls at baseline (blue), cases before treatment (green), cases after 1 month of treatment (orange), and TB cases after 6 months of treatment (dark yellow). (B) Out of these groups, MDP was significantly higher among cases before treatment (green) and cases after 1 month of treatment (orange) than among controls. MDP was not significantly different between cases after treatment (yellow) and controls (blue). (C) MDP was not significantly different by sex in any study group. (D) MDP was positively correlated with increasing age of participant among cases before treatment, but not among other study groups.
Figure 4
Figure 4
Integration of metabolomics and transcriptomics data reveals a complex and multifaceted immune response to TB. (A) Correlation network based on gene expression values in TB cases. Highlighted genes were found to correlate with N-acetylneuraminate, quinolinate and pyridoxate with p-value < 0.05 and absolute value of R > 0.7. (B) List of pathways associated with genes found to be positively and negatively correlated with the above-mentioned 3 metabolites.
Figure 5
Figure 5
Downstream Multi‐Omics Factor Analysis (MOFA) disentangles the variability between metabolomics and transcriptomics data. The fitted MOFA model assessed the proportion of variance explained by each factor in each data modality. (A) Study overview and data types. Data modalities are shown in different rows (d = number of features) and samples (n) in columns. (B) The proportion of total variance (R2) explained by individual factors for each assay. (C) Absolute loadings of the top features of Factors 1 to 5 in the metabolomics (left panel) and transcriptomics (right panel) data.

References

    1. WHO . Global Tuberculosis Report 2019. Geneva: World Health Organization; 2019. p. 297.
    1. Dodd PJ, Gardiner E, Coghlan R, Seddon JA. Burden of childhood tuberculosis in 22 high-burden countries: A mathematical modelling study. Lancet Glob. Health. 2014;2:e453–e459. doi: 10.1016/S2214-109X(14)70245-1. - DOI - PubMed
    1. Graham SM, Cuevas LE, Jean-Philippe P, et al. Clinical case definitions for classification of intrathoracic tuberculosis in children: An update. Clin. Infect. Dis. 2015;61(Suppl 3):S179–S187. doi: 10.1093/cid/civ581. - DOI - PMC - PubMed
    1. Zar HJ, Hanslo D, Apolles P, Swingler G, Hussey G. Induced sputum versus gastric lavage for microbiological confirmation of pulmonary tuberculosis in infants and young children: A prospective study. Lancet (London, England) 2005;365:130–134. doi: 10.1016/S0140-6736(05)17702-2. - DOI - PubMed
    1. Zar HJ, Connell TG, Nicol M. Diagnosis of pulmonary tuberculosis in children: New advances. Expert Rev. Anti. Infect. Ther. 2010;8:277–288. doi: 10.1586/eri.10.9. - DOI - PubMed

Publication types