. 2020 Nov 11;10(1):19547.
doi: 10.1038/s41598-020-76505-4.

The impact of glucose exposure on bioenergetics and function in a cultured endothelial cell model and the implications for cardiovascular health in diabetes

Affiliations

The impact of glucose exposure on bioenergetics and function in a cultured endothelial cell model and the implications for cardiovascular health in diabetes

Maria Luisa Fiorello et al. Sci Rep. .

Abstract

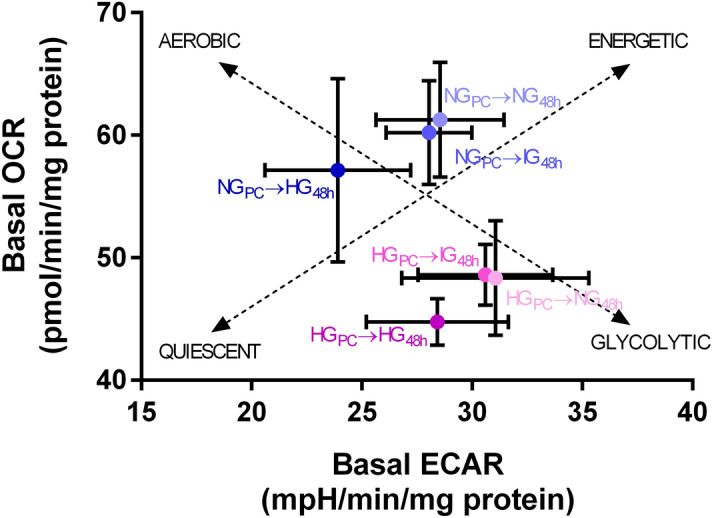
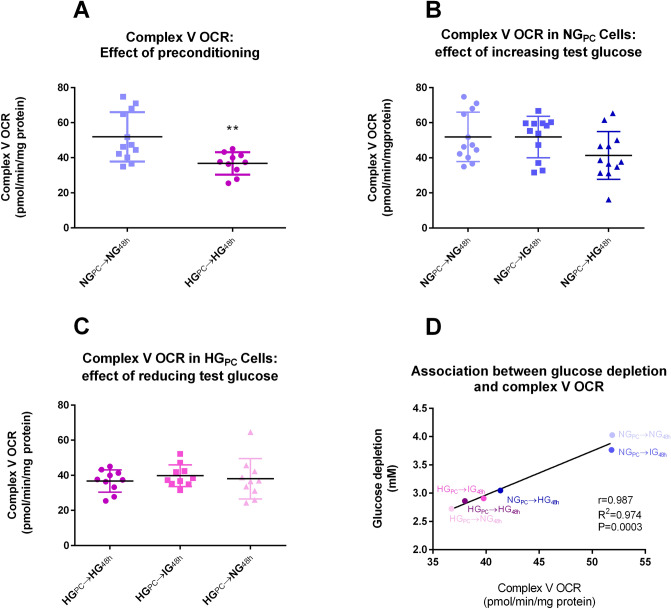
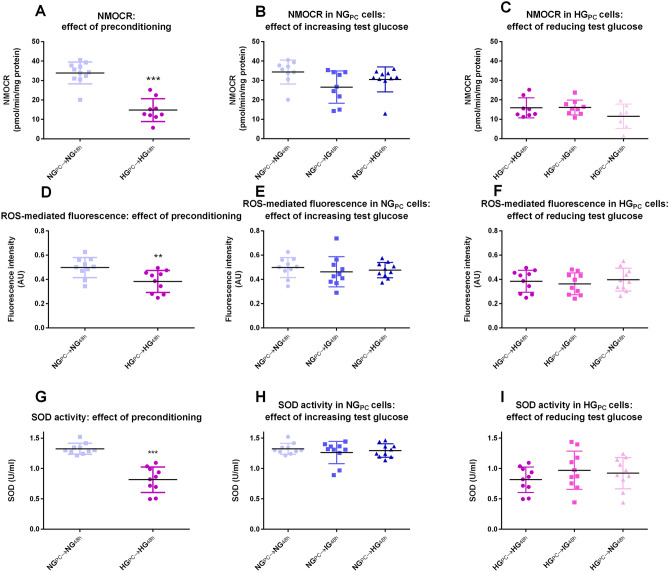
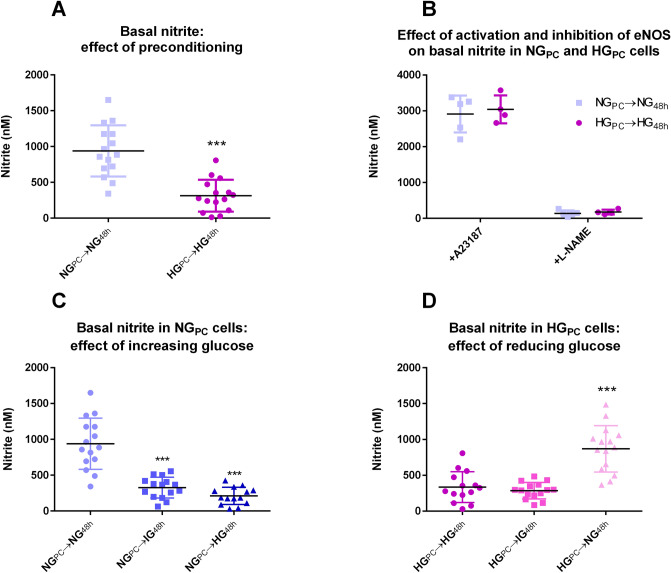
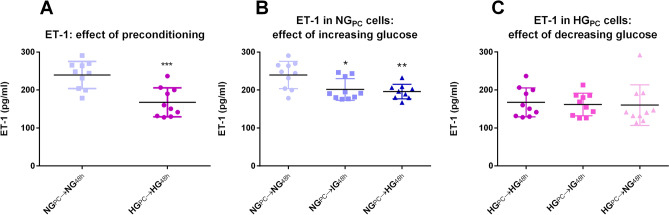
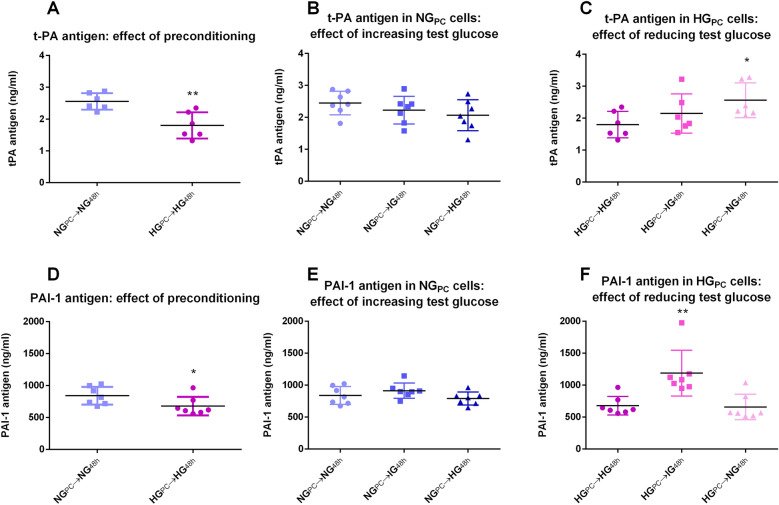
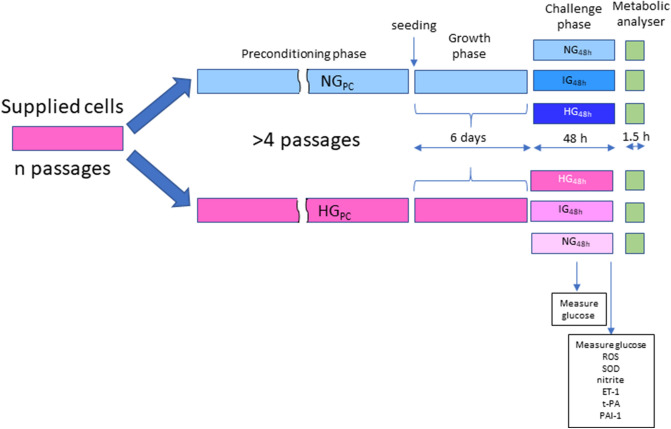
Cardiovascular disease is the primary driver of morbidity and mortality associated with diabetes. Hyperglycaemia is implicated in driving endothelial dysfunction that might underpin the link between diabetes and cardiovascular disease. This study was designed to determine the impact of chronic preconditioning of cells to hyperglycaemia and transient switching of cultured endothelial cells between hyper- and normo-glycaemic conditions on bioenergetic and functional parameters. Immortalised EA.hy926 endothelial cells were cultured through multiple passages under normoglycaemic (5.5 mM) or hyperglycaemic (25 mM) conditions. Cells were subsequently subjected (48 h) to continued normo- or hyperglycaemic exposure, or were switched to the alternative glycaemic condition, or to an intermediate glucose concentration (12.5 mM) and metabolic activity, together with key markers of function were measured. Cells habituated to hyperglycaemia were energetically quiescent. Functional activity, characterised by the measurement of nitric oxide, endothelin-1, tissue plasminogen activator and plasminogen activator inhibitor-1, was depressed by exposure to high glucose, with the reduction in nitric oxide production being the most notable. Function was more responsive to acute changes in extracellular glucose than were bioenergetic changes. We conclude that glucose is a key determinant of endothelial function. The study highlights the importance of chronic glucose exposure on cell phenotype and emphasises the need to pay close attention to glucose preconditioning in interpreting results under culture conditions.


Conflict of interest statement

The authors declare no competing interests.

Figures

Figure 1
Figure 1
Energy map for cells cultured under various glucose conditions. HGPC cells exhibit a more quiescent phenotype than NGPC cells. 48 h exposure of HGPC cells to lower glucose concentrations (IG or NG) drove a partial reversal of the effect, just as 48 h exposure of NGPC cells with IG or HG medium partially induced the quiescent phenotype. Dotted lines represent the aerobic-glycolytic axis and the quiescent-energetic axis. Data are expressed as mean ± SEM (n = 10–12 for each mean depicted). Raw data were analysed using Seahorse Wave Software (version 2.3.0.19) prior to graphical presentation using Graphpad Prism version 6.00.
Figure 2
Figure 2
(A) Effect of glucose preconditioning on complex V-associated OCR (**P < 0.01; Mann Whitney U test). (B) Effect of 48 h exposure of increasing glucose concentrations to NGPC cells (P > 0.05; Kruskal–Wallis). (C) Effect of 48 h exposure of decreasing glucose concentrations in HGPC cells (P > 0.05; Kruskal–Wallis). (D) Correlation of mean complex V-associated OCR with mean glucose depletion from medium under each HG and NG condition. Raw data for glucose depletion are found in Supplementary Fig. S3. Raw data were analysed using Seahorse Wave Software (version 2.3.0.19) prior to graphical presentation using Graphpad Prism version 6.00.
Figure 3
Figure 3
(A) Effect of glucose preconditioning on NMOCR (***P < 0.001; Student’s t-test). (B) Effect of 48 h exposure of increasing glucose concentrations to NGPC cells (P > 0.05; One-way ANOVA). (C) Effect of 48 h exposure of decreasing glucose concentrations in HGPC cells (P > 0.05; One-factor ANOVA). (D) Effect of glucose preconditioning on DFDCA fluorescence (**P < 0.01; Student’s t-test). (E) Effect of 48 h exposure of increasing glucose concentrations in NGPC cells (P > 0.05; one-factor ANOVA). (F) Effect of 48 h exposure of decreasing glucose concentrations in HGPC cells (P > 0.05; one-factor ANOVA). (G) Effect of glucose preconditioning on SOD activity (***P < 0.001; Mann Whitney U test). (H) Effect of 48 h exposure of increasing glucose concentrations on SOD activity in NGPC cells (P > 0.05; one-factor ANOVA). (I) Effect of 48 h exposure of decreasing glucose concentrations on SOD activity in HGPC cells (P > 0.05; one-factor ANOVA). Raw data were analysed using Seahorse Wave Software (version 2.3.0.19) prior to graphical presentation using Graphpad Prism version 6.00.
Figure 4
Figure 4
(A) Effect of glucose preconditioning on nitrite accumulation (***P < 0.001; Mann Whitney U test). (B) Effect of activation (A23187 1 μM, 1 min calcium ionophore) and inhibition (l-NAME 100 μM, 24 h) on nitrite accumulation in medium) in NGPC and HGPC cells (P > 0.05; Student’s t-tests between glucose conditions). (C) Effect of 48 h exposure of increasing glucose concentrations to NGPC cells on nitrite (***P < 0.001; Kruskal–Wallis test with Dunn’s post-test). (D) Effect of 48 h exposure of decreasing glucose concentrations in HGPC cells on nitrite (***P < 0.001; Kruskal–Wallis test with Dunn’s post-test). Data were analysed using Liquid Software (version 2) and presented using Graphpad Prism version 6.00 Software.
Figure 5
Figure 5
(A) Effect of glucose preconditioning on ET-1 (***P < 0.001; Student’s t-test). (B) Effect of 48 h exposure of increasing glucose concentrations to NGPC cells on ET-1 (*P < 0.05, **P < 0.01; One-factor ANOVA with Bonferroni post-test). (C) Effect of 48 h exposure of decreasing glucose concentrations in HGPC cells on ET-1 (P > 0.05; One-factor ANOVA). Data were collected using SkanIt Software 2.4.5 and further analysed and presented using Graphpad Prism version 6.00 Software.
Figure 6
Figure 6
(A) Effect of glucose preconditioning on t-PA antigen (**P < 0.001; Student’s t-test). (B) Effect of 48 h exposure of increasing glucose concentrations to NGPC cells on t-PA antigen (P > 0.05; One-factor ANOVA). (C) Effect of 48 h exposure of decreasing glucose concentrations in HGPC cells on t-PA antigen (*P < 0.05; One-factor ANOVA with Bonferroni post-test). (D) Effect of glucose preconditioning on PAI-1 antigen (**P < 0.001; Student’s t-test). (E) Effect of 48 h exposure of increasing glucose concentrations to NGPC cells on PAI-1 antigen (P > 0.05; One-factor ANOVA). (F) Effect of 48 h exposure of decreasing glucose concentrations in HGPC cells on PAI-1 antigen (*P < 0.05, **P < 0.01; One-factor ANOVA with Bonferroni post-test). Data were collected using SkanIt Software 2.4.5 and further analysed and presented using Graphpad Prism version 6.00 Software.
Figure 7
Figure 7
Schematic diagram depicting glucose exposure regimen and outcome measures.

References

    1. Ceriello A, Ihnat MA, Thorpe JE. The ‘Metabolic memory’: Is more than just tight glucose control necessary to prevent diabetic complications? J. Clin. Endocrinol. Metab. 2009;94:410–415. - PubMed
    1. Reddy MA, Natarajan R. Role of epigenetic mechanisms in the vascular complications of diabetes. Subcell. Biochem. 2013;61:435–454. - PMC - PubMed
    1. Misra A, Bloomgarden Z. Metabolic memory: Evolving concepts. J. Diabetes. 2018;10:186–187. - PubMed
    1. Drzewoski J, Kasznicki J, Trojanowski Z. The role of ‘metabolic memory’ in the natural history of diabetes mellitus. Pol. Arch. Med. Wewn. 2009;119:493–500. - PubMed
    1. Nathan DM. Sustained effect of intensive treatment of type 1 diabetes mellitus on development and progression of diabetic nephropathy: The epidemiology of diabetes interventions and complications (EDIC) study. J. Am. Med. Assoc. 2003;290:2159–2167. - PMC - PubMed

Publication types

MeSH terms