Randomized Controlled Trial
. 2020 Nov 11;10(1):19594.
doi: 10.1038/s41598-020-76607-z.

The role of soluble mediators in the clinical course of EBV infection and B cell homeostasis after kidney transplantation

Affiliations
Randomized Controlled Trial

The role of soluble mediators in the clinical course of EBV infection and B cell homeostasis after kidney transplantation

Sharon Bajda et al. Sci Rep. .

Abstract

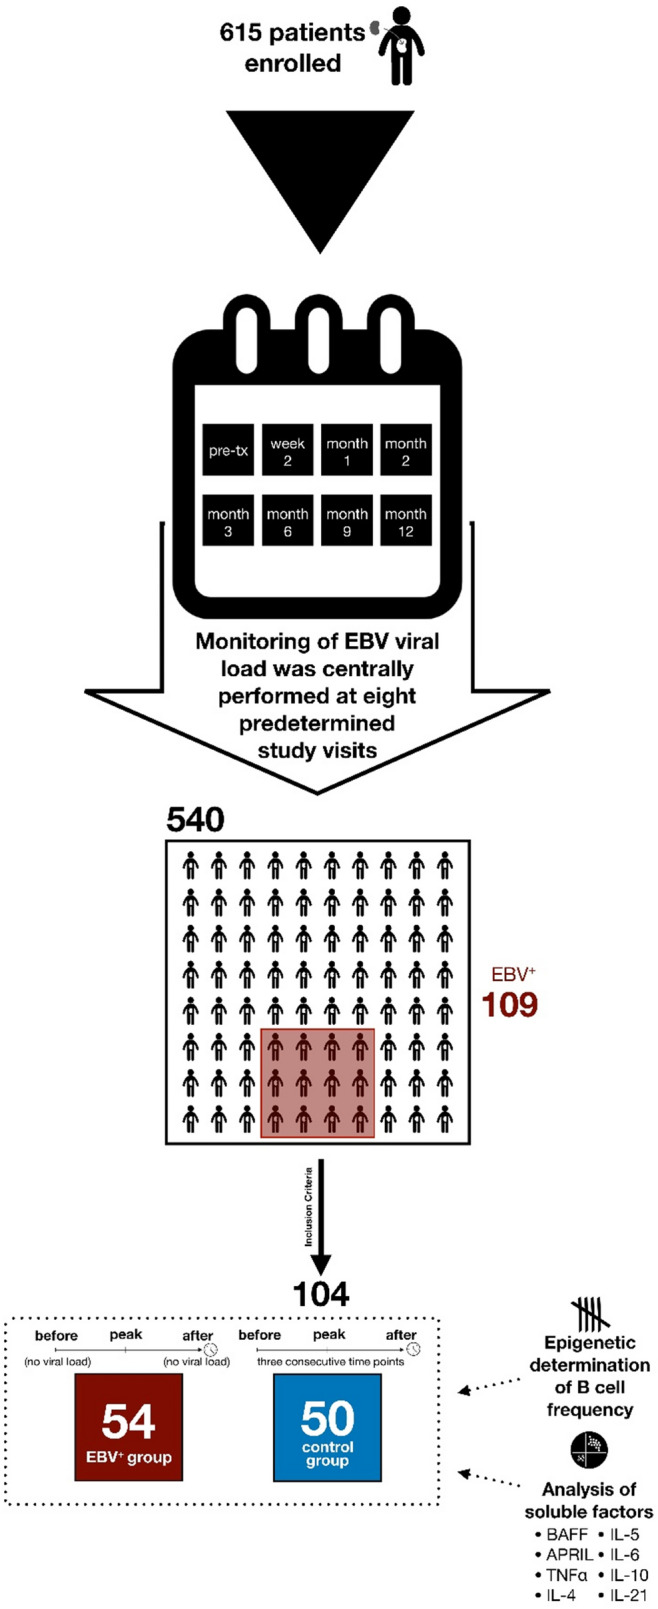
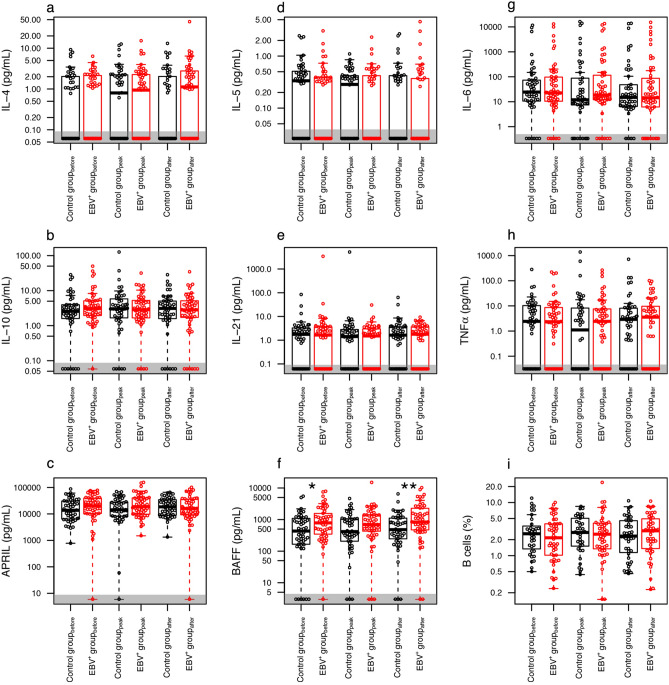
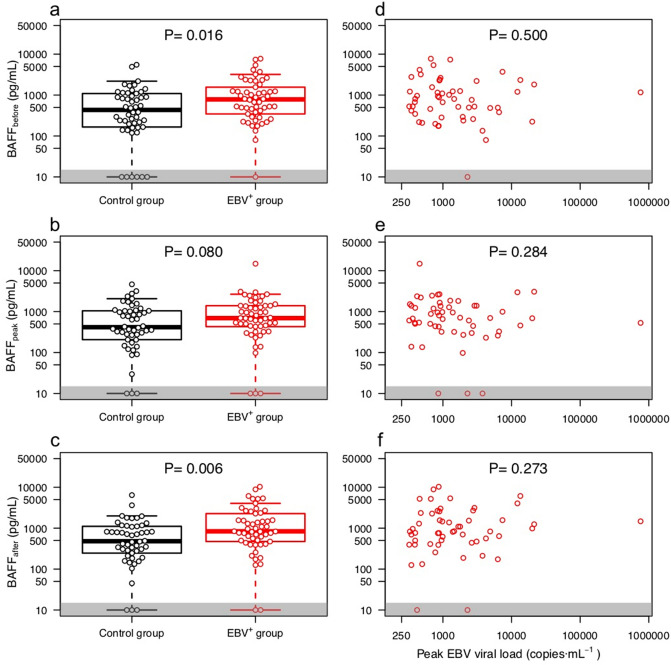
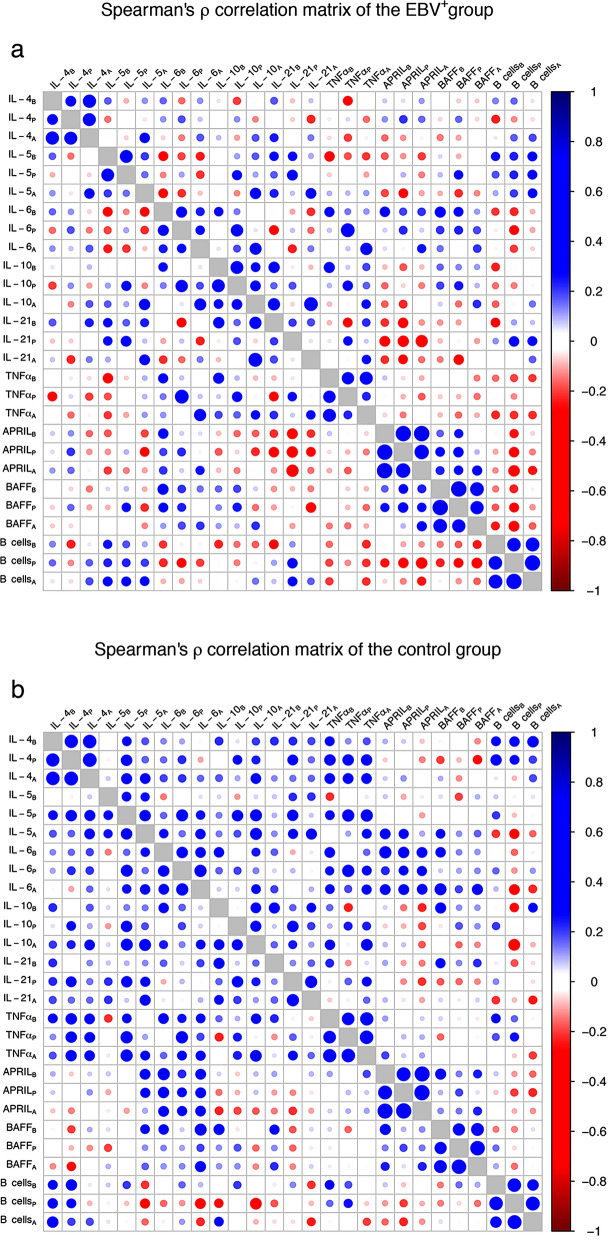
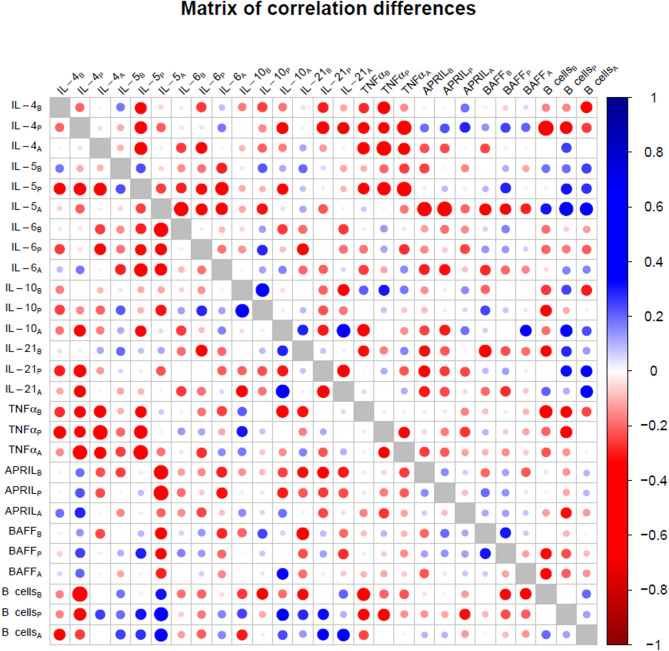
Epstein-Barr virus (EBV) reactivation can lead to serious complications in kidney transplant patients, including post-transplant lymphoproliferative disorder (PTLD). Here, we have assessed the impact of EBV on B cell homeostasis at cellular and humoral level. In a multicenter study monitoring 540 kidney transplant patients during the first post-transplant year, EBV reactivation was detected in 109 patients. Thirteen soluble factors and B cell counts were analyzed in an EBV+ sub-cohort (N = 54) before, at peak and after EBV clearance and compared to a control group (N = 50). The B cell activating factor (BAFF) was significantly elevated among EBV+ patients. No additional soluble factors were associated with EBV. Importantly, in vitro experiments confirmed the proliferative effect of BAFF on EBV-infected B cells, simultaneously promoting EBV production. In contrast, elevated levels of BAFF in EBV+ patients did not lead to B cell expansion in vivo. Moreover, diminished positive inter-correlations of soluble factors and alterations of the bi-directional interplay between B cell and soluble factors were observed in EBV+ patients at peak and after clearance. Our data suggest that such alterations may counteract the proliferative effect of BAFF, preventing B cell expansion. The role of these alterations in lymphoma development should be analyzed in future studies.


Conflict of interest statement

The authors declare no competing interests.

Figures

Figure 1
Figure 1
Trial profile. The diagram summarizes the viral monitoring performed in the Harmony cohort, the composition of the current cohort and the performed measurements.
Figure 2
Figure 2
Concentration of the soluble mediators and B cell frequencies at the three time points. Patients in the control group are depicted in black, EBV+ patients in red. Significant differences (P < 0.050) between the sub-cohorts are indicated with one asterisk, highly significant differences (P < 0.010), with two asterisks. Note that the y-axis is in logarithmic scale. For the sake of convenience, measurements below detection limit are depicted with an arbitrarily defined low value within the area shaded in gray; for the calculation of significance these measurements were considered to have a value of 0.
Figure 3
Figure 3
BAFF concentration in serum as a function of EBV reactivation. The left column shows the measured BAFF concentration for both sub-cohorts at the time points before (a), peak (b) and after (c); the right column depicts the measured BAFF concentrations in the EBV+ group at time points before (d), peak (e) and after (f) as a function of EBV viral load at peak. The results on (a–c) are also contained in Fig. 1f and are shown here enlarged for a better data view. Samples with a BAFF concentration below detection limit are depicted in the gray area; for the calculation of significance these concentrations were considered to have a value of 0. Note that both axes are in logarithmic scale.
Figure 4
Figure 4
BAFF treatment of EBV-infected LCL leads to increased EBV replication and cell expansion. LCL B cells from four different renal transplant patients were cultured with increasing BAFF concentrations (x-axis), with MPA + Tac (black symbols), or without MPA + Tac (red symbols). EBV load under BAFF treatment was assessed by normalization of EBV-PCR data obtained after BAFF treatment to untreated samples (a). The normalized LCL B cell count (b) represents the ratio of the B cell count by the untreated (BAFF = 0 and No IS) LCL B cells.
Figure 5
Figure 5
B cell frequency in blood as a function of EBV reactivation. The left column shows the measured B cell frequencies for both sub-cohorts at the time points before (a), peak (b) and after (c); the right column depicts the measured B cell frequencies in the EBV+ group at time points before (d), peak (e) and after (f) as a function of EBV viral load at peak. The results on a-c are also contained in Fig. 1i and are shown here enlarged to allow for a better view of the data. Note that both axes are in logarithmic scale.
Figure 6
Figure 6
Correlation matrices of soluble factors and B cell for the patient sub-cohorts. (a) Represents the correlation matrix of the EBV+ group, whereas (b) depicts the correlation matrix of the control group. Correlation strength is represented by both circle size and color intensity, where (as shown in the legend) blue tones denote positive correlations and red tones, negative correlations. Subscripts in variable labels denote the time point of measurement (B: before, P: peak, A: after).
Figure 7
Figure 7
Difference between the correlation matrices of the EBV+ group and the control group. The absolute value difference between the correlations is represented by circle size. Blue tones denote that the EBV+ group had an increased correlation compared to the control group and vice versa for the red tones. Subscripts in variable labels denote the time point of measurement (B: before, P: peak, A: after).

References

    1. Dierickx D, Habermann TM. Post-transplantation lymphoproliferative disorders in adults. N. Engl. J. Med. 2018;378:549–562. - PubMed
    1. Petrara MR, et al. Post-transplant lymphoproliferative disorders: From epidemiology to pathogenesis-driven treatment. Cancer Lett. 2015;369:37–44. - PubMed
    1. Andrei, G., Trompet, E. & Snoeck, R. Novel therapeutics for Epstein–Barr virus. 10.3390/molecules24050997 (2019). - PubMed
    1. Rivera-Soto R, Damania B. Modulation of angiogenic processes by the human gammaherpesviruses, Epstein–Barr virus and Kaposi’s. Front. Immunol. 2019;10:1544. - PMC - PubMed
    1. Ng S-B, Khoury JD. Epstein-Barr virus in lymphoproliferative processes: An update for the diagnostic pathologist. Adv. Anat. Pathol. 2009;16:40–55. - PubMed

Publication types

Substances