Comparative Study
. 2020 Nov;587(7833):246-251.
doi: 10.1038/s41586-020-2871-y. Epub 2020 Nov 11.

Progressive Cactus is a multiple-genome aligner for the thousand-genome era

Affiliations
Comparative Study

Progressive Cactus is a multiple-genome aligner for the thousand-genome era

Joel Armstrong et al. Nature. 2020 Nov.

Abstract

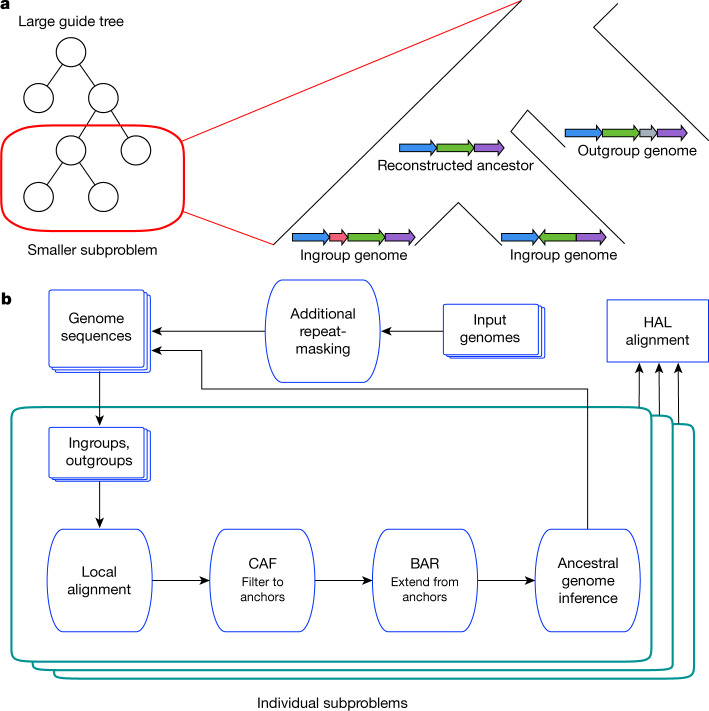
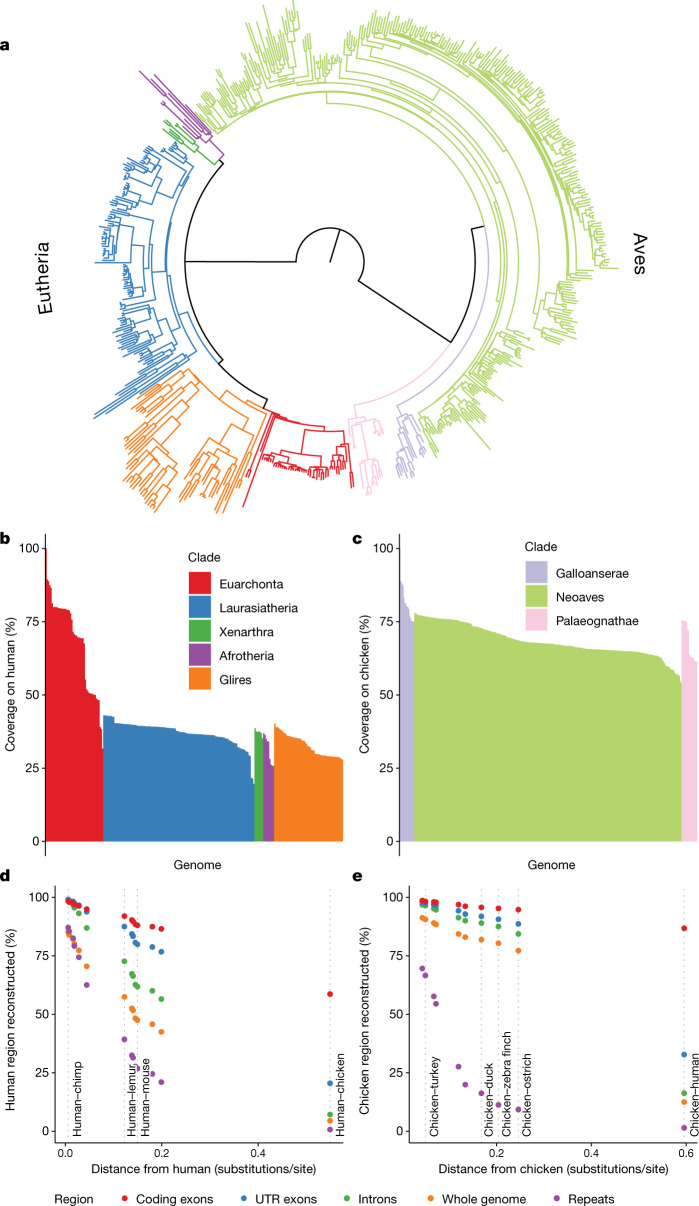
New genome assemblies have been arriving at a rapidly increasing pace, thanks to decreases in sequencing costs and improvements in third-generation sequencing technologies1-3. For example, the number of vertebrate genome assemblies currently in the NCBI (National Center for Biotechnology Information) database4 increased by more than 50% to 1,485 assemblies in the year from July 2018 to July 2019. In addition to this influx of assemblies from different species, new human de novo assemblies5 are being produced, which enable the analysis of not only small polymorphisms, but also complex, large-scale structural differences between human individuals and haplotypes. This coming era and its unprecedented amount of data offer the opportunity to uncover many insights into genome evolution but also present challenges in how to adapt current analysis methods to meet the increased scale. Cactus6, a reference-free multiple genome alignment program, has been shown to be highly accurate, but the existing implementation scales poorly with increasing numbers of genomes, and struggles in regions of highly duplicated sequences. Here we describe progressive extensions to Cactus to create Progressive Cactus, which enables the reference-free alignment of tens to thousands of large vertebrate genomes while maintaining high alignment quality. We describe results from an alignment of more than 600 amniote genomes, which is to our knowledge the largest multiple vertebrate genome alignment created so far.


Conflict of interest statement

The authors declare no competing interests.

Figures

Fig. 1
Fig. 1. The alignment process within Progressive Cactus.
a, A large alignment problem is split into many smaller subproblems using an input guide tree. Each subproblem compares a set of ingroup genomes (the children of the internal node to be reconstructed) against each other as well as a sample of outgroup genomes (non-descendants of the internal node in question). b, Flowchart represents the phases in which the overall alignment, as well as each subproblem alignment, proceeds through. The end result is a new genome assembly that represents the Progressive Cactus reconstruction of the ancestral genome, and an alignment between this ancestral genome and its children. After all subproblems have been completed, the parent–child alignments are combined to create the full reference-free alignment in the HAL format.
Fig. 2
Fig. 2. Comparing alignments of varying numbers of simulated genomes using Progressive Cactus.
a, The progressive mode of Progressive Cactus is shown, versus the mode without progressive decomposition that is similar to that previously described (‘star’). The average total runtime of the two alignment methods across three runs is shown. Data are mean and s.d. The runtime is identical when aligning two genomes as the alignment problem is not further decomposed, but the linear scaling of the progressive mode means it is much faster with large numbers of genomes than the quadratic scaling required without progressive alignment. b, The precision, recall and F1 score (harmonic mean of precision and recall) of aligned pairs for each alignment compared with pairs from the true alignment produced by the simulation. Source data
Fig. 3
Fig. 3. Analysing the 600-way amniote alignment.
a, The species tree relating the 600 genomes. Branches are coloured by clades as in b and c. b, Percentage coverage on human within the eutherian mammals, grouped by clade from highest to lowest coverage. c, As in b, but for coverage on chicken within the avian alignment. d, Percentage of various regions within the human genome mappable to each ancestral genome reconstructed along the path leading from human to the root. The positions of selected ancestors are labelled by dotted lines to indicate useful taxonomic reference points as context. UTR, untranslated region. e, As in d, but for the path of reconstructed ancestors between chicken and the root. Source data
Fig. 4
Fig. 4. Comparing Cactus and MULTIZ alignment coverage.
A comparison of coverage in the Progressive Cactus avian alignment compared to a chicken-referenced MULTIZ alignment of the same genomes. Coverage of both alignments on chicken and zebra finch is shown to illustrate the effects of reference bias on the completeness of the MULTIZ alignment. The diagonal dotted line indicates a slope of 1 (that is, if the coverage of MULTIZ and Progressive Cactus were equal). Source data
Extended Data Fig. 1
Extended Data Fig. 1. Results from improved paralogue filtering.
a, b, A sample snake track within a recently duplicated region before (a) and after (b) the filtering change. Nucleotide substitutions are shown as red bars, and insertions are shown as thin orange bars. c, Coverage results from two alignments of identical assemblies using the outgroup and best-hit filtering methods. Multiple-mappings: sites that map to two or more sites on the target genome. d, Results from comparing phylogenetic trees implicit in the HAL alignment to ML re-estimated trees of the same regions. ‘Early’ coalescences indicate that too many duplication events have been created in the reconciled trees, and ‘late’ indicates that too many loss events have been created. e, Percentage of human genes that map more than once to the chimp/gorilla genomes in two CAT annotations using alignments created with the outgroup and best-hit filtering methods. KZNF, KRAB zinc-finger genes.
Extended Data Fig. 2
Extended Data Fig. 2. Methods of adding a genome to a Progressive Cactus alignment.
The top row shows the different ways of adding a new genome given its phylogenetic position, and the bottom row shows what subproblems would need to be computed for the new genome to be properly merged into the existing alignment. Green circles represent a new genome, and red circles represent newly reconstructed genomes.
Extended Data Fig. 3
Extended Data Fig. 3. Analysing insertions, deletions and L1PA6 repeats in the 600-way alignment.
a, Rates of micro-insertions and -deletions (micro-indels) along each branch within the 600-way alignment, compared to conventional substitutions/site branch length. The data from avian and eutherian branches are separated. Lines show a best-fit linear model for each category. b, Violin plot showing the increasing similarity to consensus of L1PA6 elements within reconstructed ancestral genomes along the path to the emergence of modern L1PA6 elements (in the human-rhesus ancestor). Horizontal lines indicate the median values.

Comment in

References

    1. Eid J, et al. Real-time DNA sequencing from single polymerase molecules. Science. 2009;323:133–138. - PubMed
    1. Weisenfeld NI, Kumar V, Shah P, Church DM, Jaffe DB. Direct determination of diploid genome sequences. Genome Res. 2017;27:757–767. - PMC - PubMed
    1. Jain M, Olsen HE, Paten B, Akeson M. The Oxford Nanopore MinION: delivery of nanopore sequencing to the genomics community. Genome Biol. 2016;17:239. - PMC - PubMed
    1. Kitts PA, et al. Assembly: a resource for assembled genomes at NCBI. Nucleic Acids Res. 2016;44:D73–D80. - PMC - PubMed
    1. Jain M, et al. Nanopore sequencing and assembly of a human genome with ultra-long reads. Nat. Biotechnol. 2018;36:338–345. - PMC - PubMed

Publication types