. 2020 Dec;588(7839):642-647.
doi: 10.1038/s41586-020-2899-z. Epub 2020 Nov 11.

Transcriptome and translatome co-evolution in mammals

Affiliations

Transcriptome and translatome co-evolution in mammals

Zhong-Yi Wang et al. Nature. 2020 Dec.

Abstract

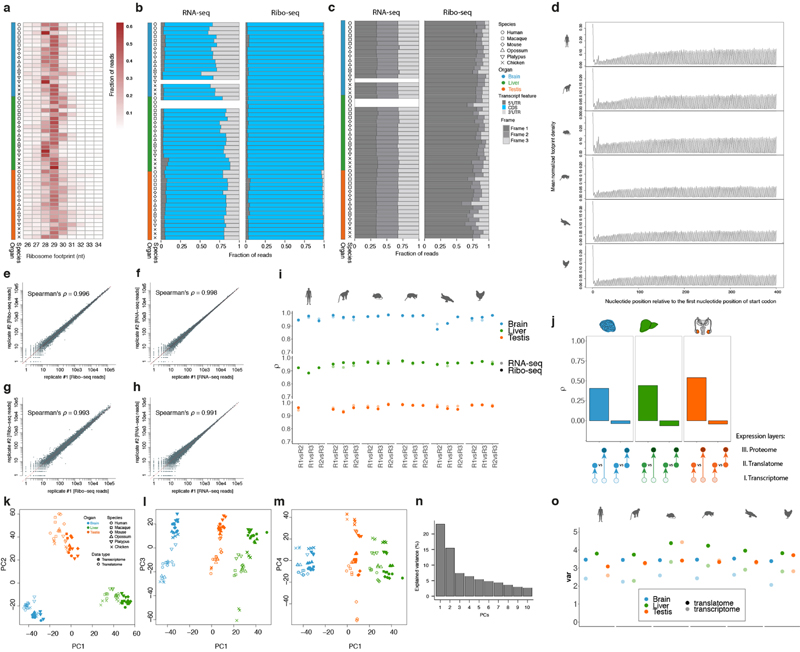
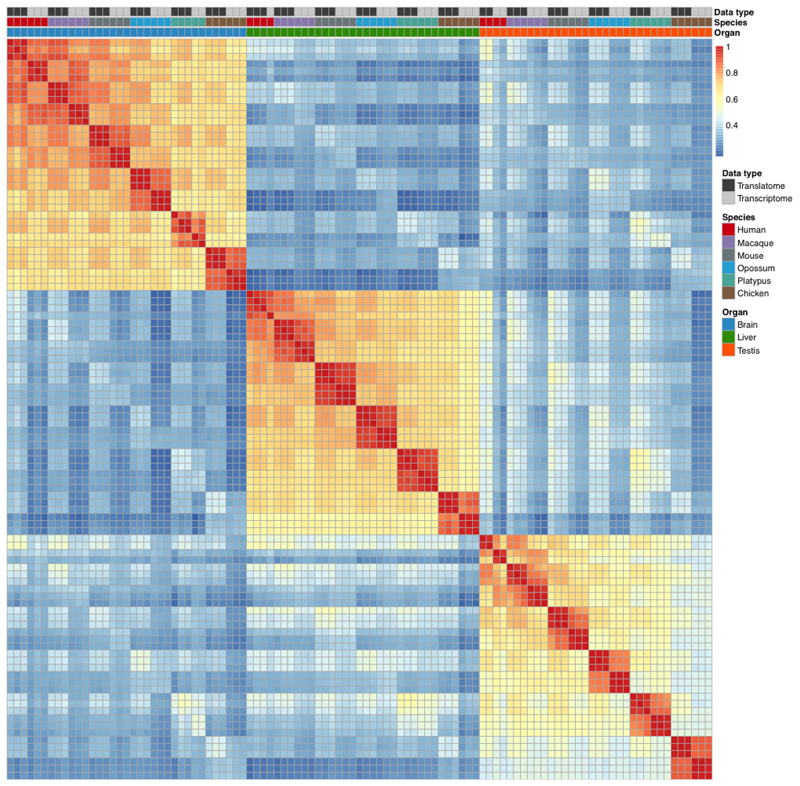
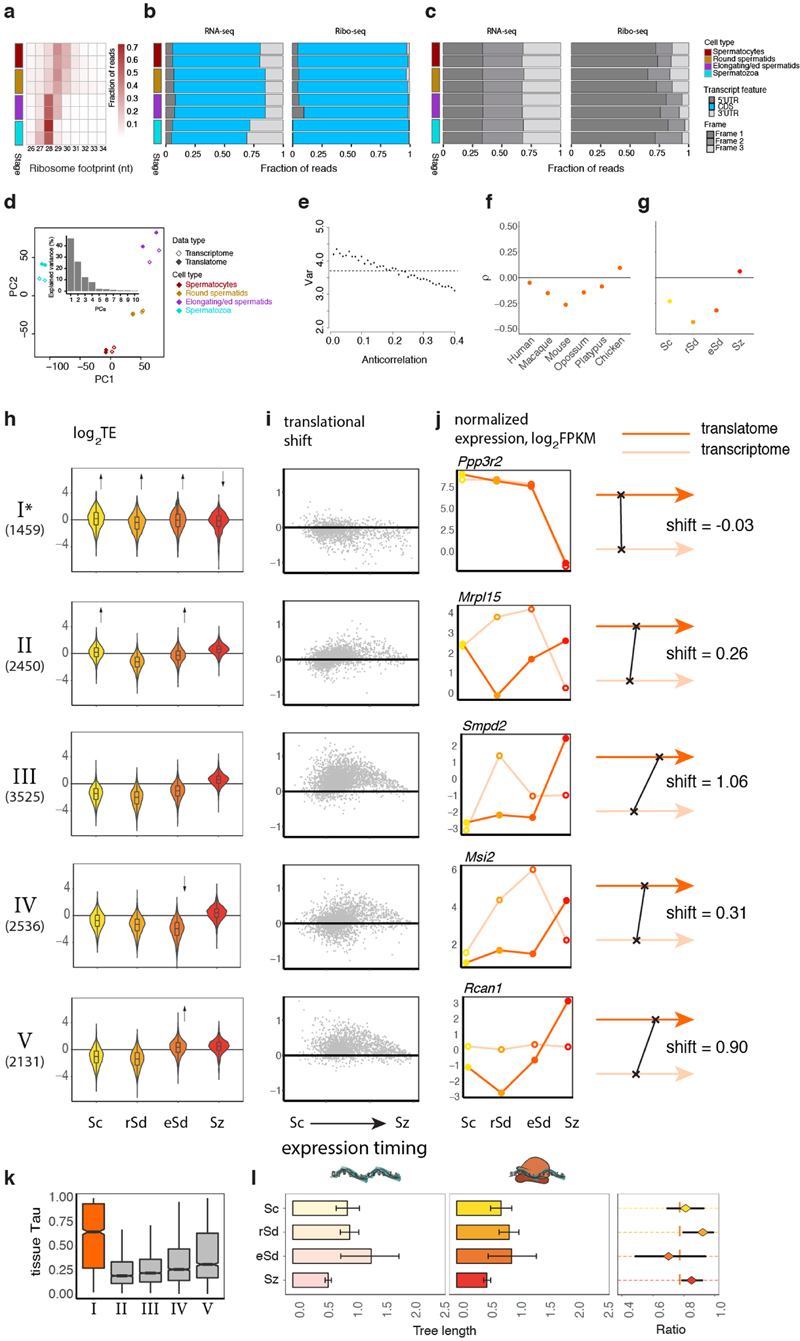
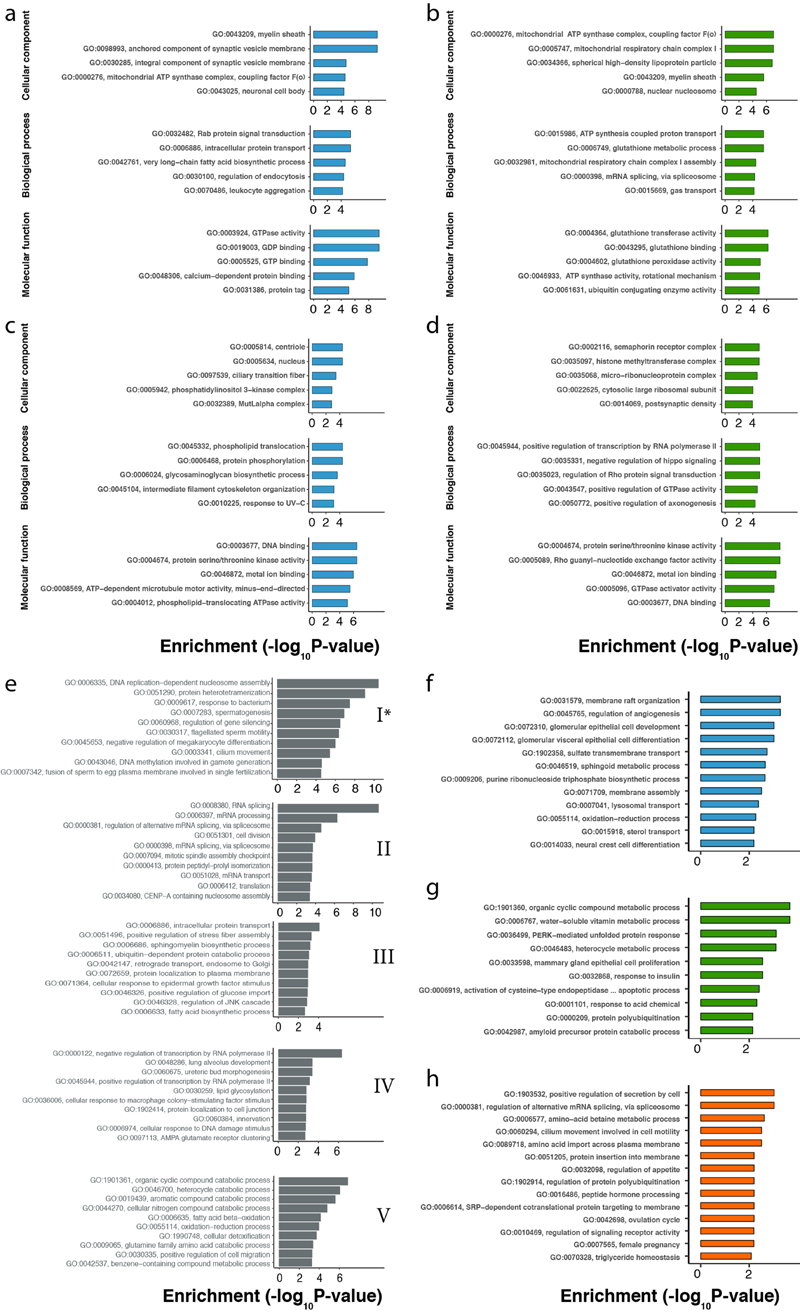
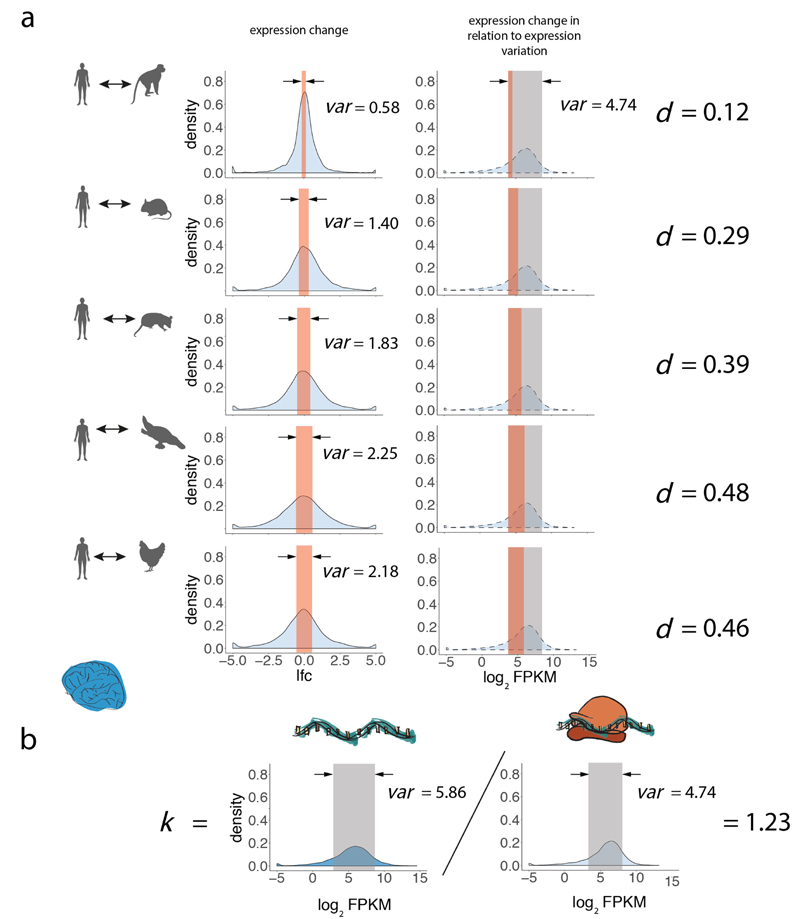
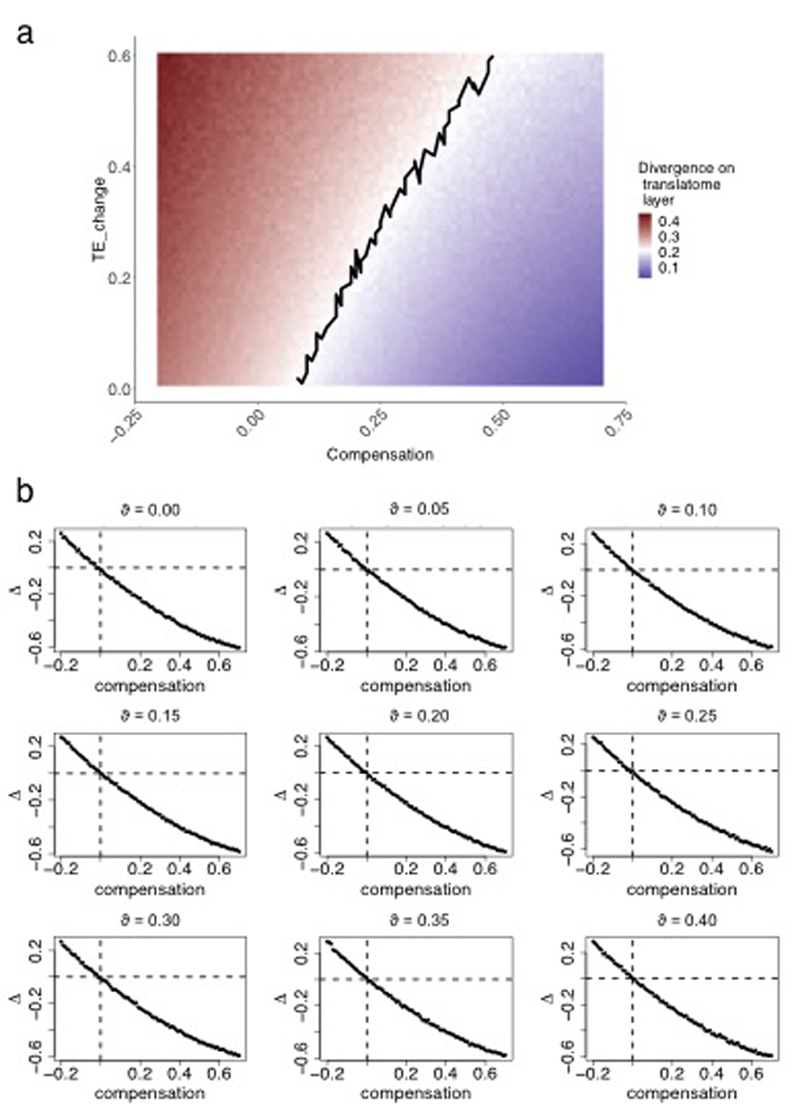
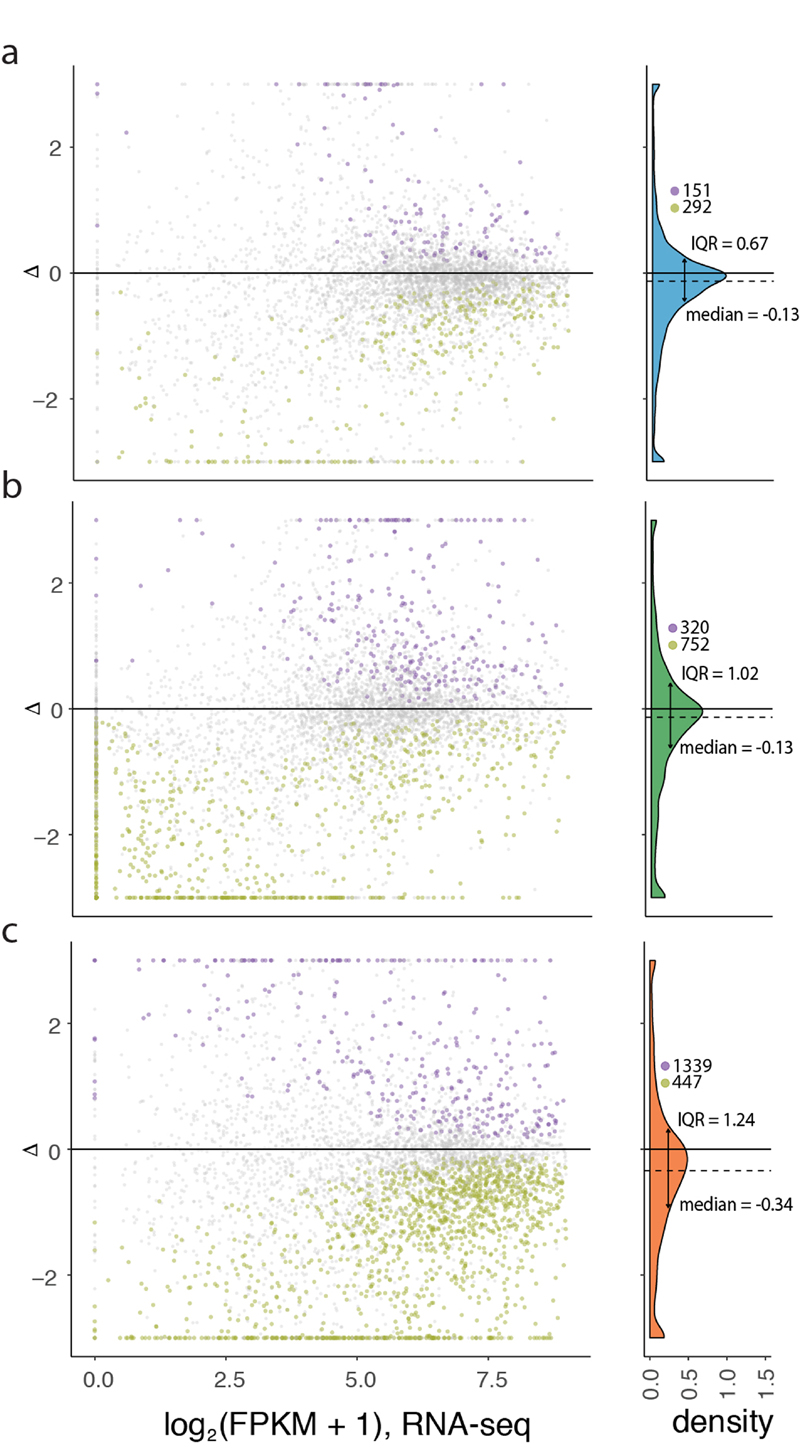
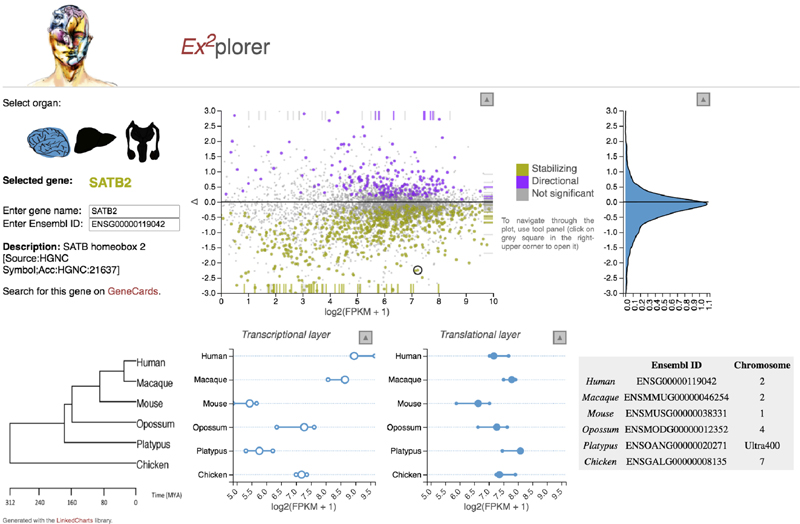
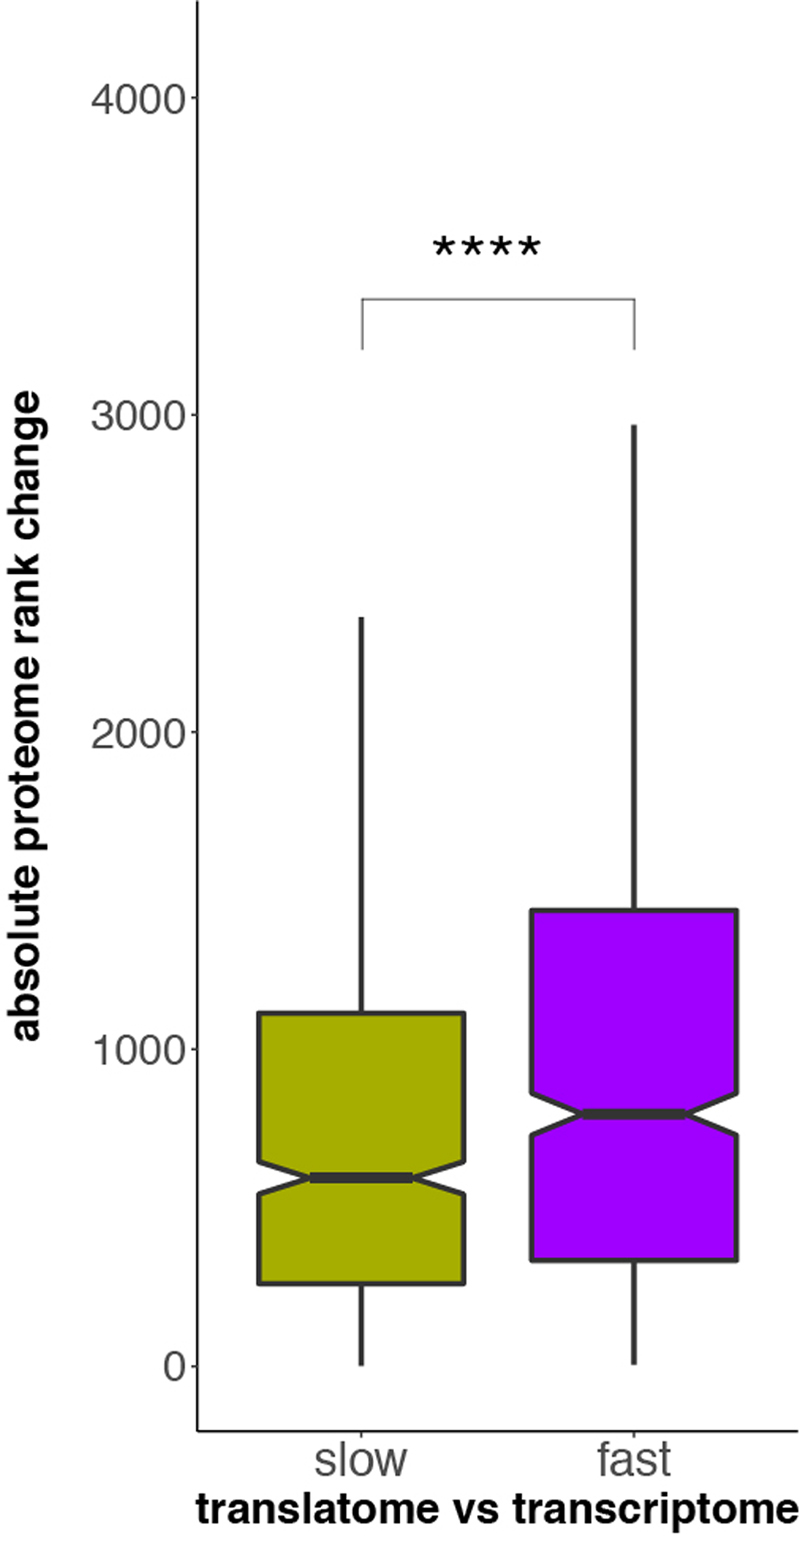
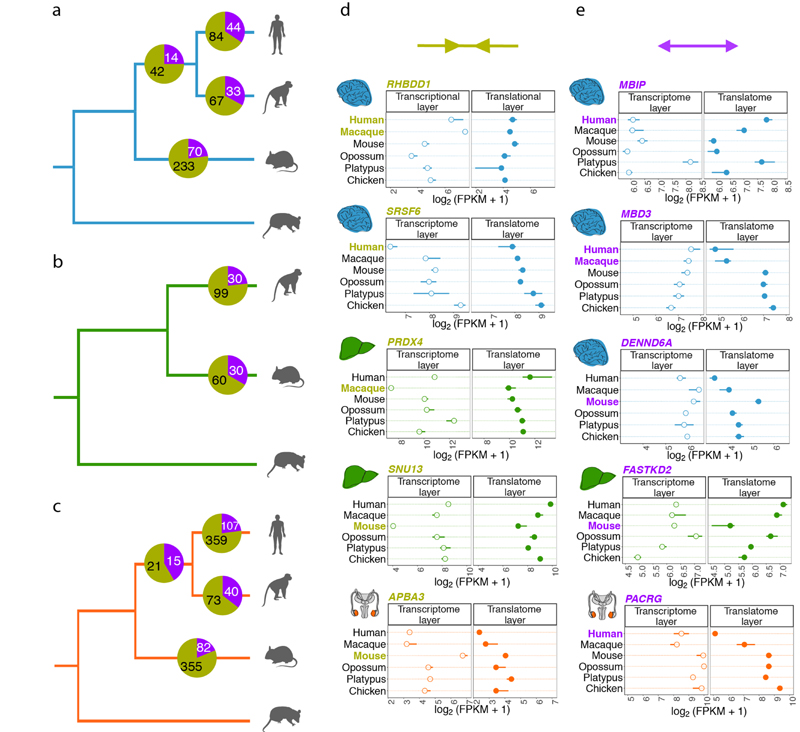
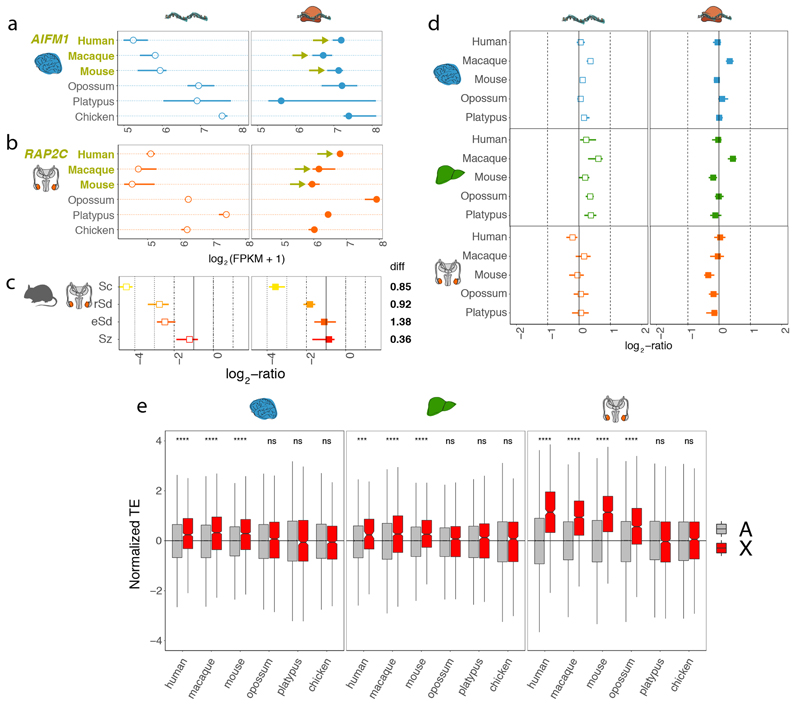
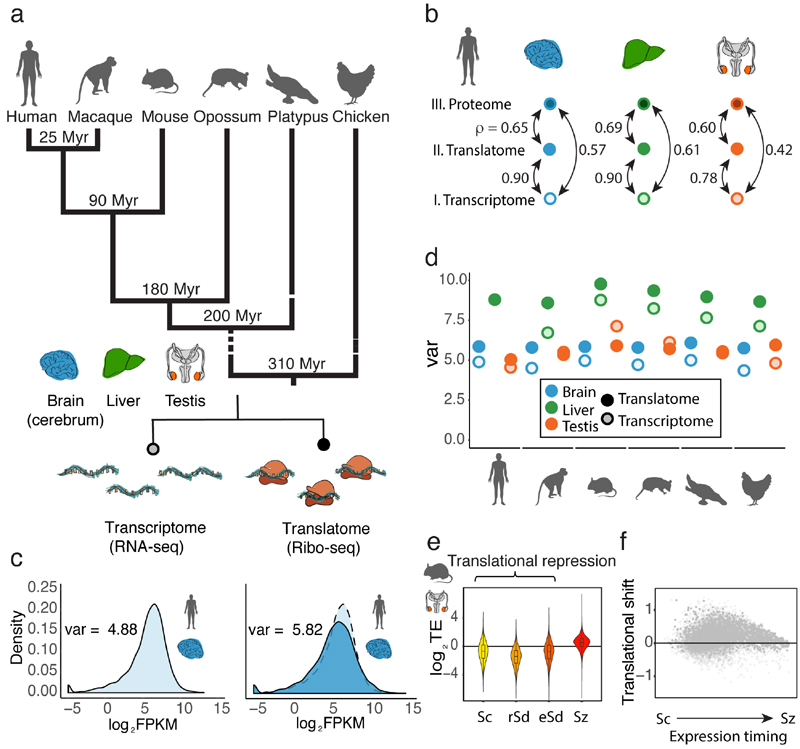
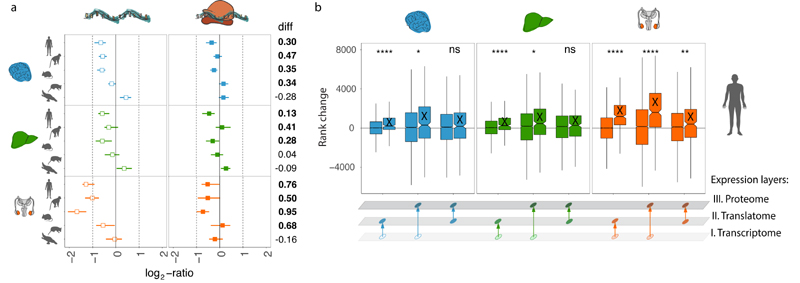
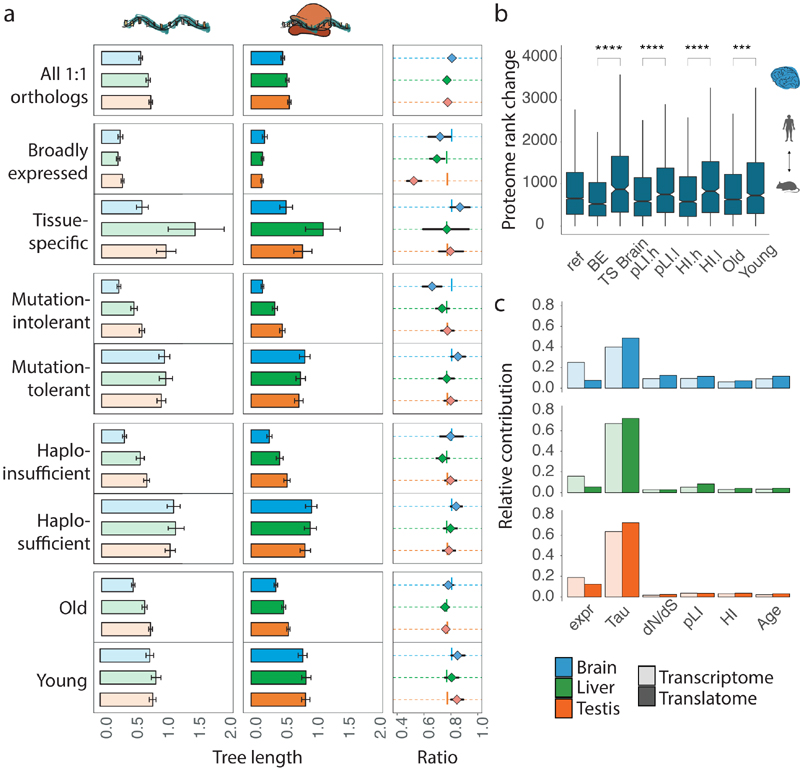
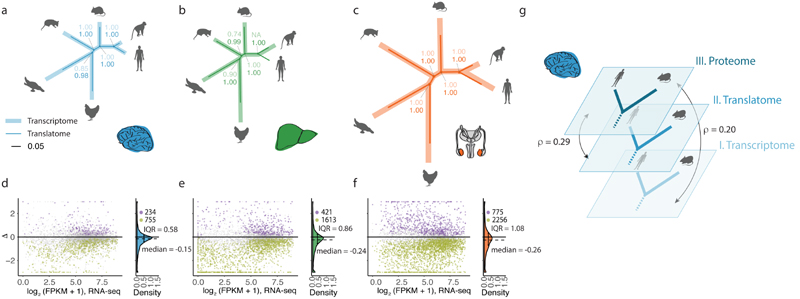
Gene-expression programs define shared and species-specific phenotypes, but their evolution remains largely uncharacterized beyond the transcriptome layer1. Here we report an analysis of the co-evolution of translatomes and transcriptomes using ribosome-profiling and matched RNA-sequencing data for three organs (brain, liver and testis) in five mammals (human, macaque, mouse, opossum and platypus) and a bird (chicken). Our within-species analyses reveal that translational regulation is widespread in the different organs, in particular across the spermatogenic cell types of the testis. The between-species divergence in gene expression is around 20% lower at the translatome layer than at the transcriptome layer owing to extensive buffering between the expression layers, which especially preserved old, essential and housekeeping genes. Translational upregulation specifically counterbalanced global dosage reductions during the evolution of sex chromosomes and the effects of meiotic sex-chromosome inactivation during spermatogenesis. Despite the overall prevalence of buffering, some genes evolved faster at the translatome layer-potentially indicating adaptive changes in expression; testis tissue shows the highest fraction of such genes. Further analyses incorporating mass spectrometry proteomics data establish that the co-evolution of transcriptomes and translatomes is reflected at the proteome layer. Together, our work uncovers co-evolutionary patterns and associated selective forces across the expression layers, and provides a resource for understanding their interplay in mammalian organs.


Conflict of interest statement

Competing interests

The authors declare no competing interests.

Figures

Extended Data Fig. 1
Extended Data Fig. 1. Information on generated RNA-seq and Ribo-seq data.
a, Ribosome footprint length distributions across Ribo-seq libraries (nt, nucleotides). b, Fractions of Ribo-seq and RNA-seq reads mapped to 5’ untranslated regions (5’UTRs), coding sequences (CDS), and 3’ untranslated regions (3’UTRs), respectively. c, Distribution of Ribo-seq and RNA-seq reads across the three reading frames in the coding sequence (CDS) of dominant splicing isoforms (Frame 1: canonical reading frame). d, Mean normalized density of footprints along the coding region of the dominant isoforms of protein-coding genes for the brain Ribo-seq data. The Ribo-seq read (A-site) density for each position is plotted relative to the first nucleotide position of the start codon. e-h, Spearman’s correlation coefficient (ρ) of read counts for protein-coding genes with a mean read count > 1 between the two technical replicates for mouse liver Ribo-seq (e) and RNA-seq (f) data, and for chicken liver Ribo-seq (g) and RNA-seq (h) data. i, Correlations between biological replicates for Ribo-seq and RNA-seq data. Each dot corresponds to Spearman’s correlation coefficient (ρ) in pairs of biological replicates for every species-organ combination. Only 1 replicate (therefore no pairs) is available for the human liver transcriptome, only 2 replicates (1 pair) are available for the human testis transcriptome and translatome, and only 2 replicates (1 pair) are available for the platypus brain transcriptome. The correlation coefficients between the replicates are similar for the two data types and statistically indistinguishable (P = 0.159) in a Mann-Whitney U test (two-sided). j, Comparisons of gene expression (rank) changes between the three expression layers. Changes in gene expression ranks were calculated between expression layers (i.e., from transcriptome to translatome, from transcriptome to proteome, and from translatome to proteome), and Spearman’s ρ was calculated to estimate the similarity of rank changes between the different pairs of expression layers. k-n, PCA based on 5,060 robustly expressed (median FPKM > 1 across organ libraries) 1:1 amniote orthologues. Factorial maps represent the relations of PC2 versus PC1 (k), PC3 versus PC1 (l), and PC4 versus PC1 (m). The scree plot (n) indicates the percentage of variance explained by each of the first 10 PCs. (o), Variance at the two expression layers across mammalian organs for downsampled data. For this analysis data were downsampled to 2.5 million reads in each library. See Fig. 1d for the analysis of the full dataset. Organ and species icons were previously used in ref. .
Extended Data Fig. 2
Extended Data Fig. 2. Correlations of gene expression levels between sequenced libraries.
The heatmap of the pairwise Spearman’s correlation coefficient (ρ) is based on the set of 5,060 robustly expressed (median FPKM > 1 across organ libraries) 1:1 amniote orthologues for perfectly aligned regions (see Methods). It represents the degree of similarity of gene expression profiles between data types (translatome, transcriptome), species (human, macaque, mouse, opossum, platypus, chicken) and tissues (brain, liver, testis).
Extended Data Fig. 3
Extended Data Fig. 3. Quality assessment and analysis of mouse spermatogenesis data.
a, Ribosome footprint length distributions across Ribo-seq libraries (nt, nucleotides). b, Fractions of Ribo-seq and RNA-seq reads mapped to 5’ untranslated regions (5’UTRs), coding sequences (CDS), and 3’ untranslated regions (3’UTRs), respectively. c, Distribution of Ribo-seq and RNA-seq reads across the three reading frames in the coding sequence (CDS) of dominant splicing isoforms (Frame 1: canonical reading frame). d, PCA based on 11,057 genes robustly expressed (median FPKM > 1) across murine spermatogenesis libraries. The scree plot (inset) indicates the percentage of variance explained by each of the first 10 PCs. e, Variance at the translatome layer calculated for simulated scenarios with different amounts of translational contribution (see Methods for details). Dashed line corresponds to IQR calculated at the transcriptome layer; f,g, Spearman’s ρ between transcription abundance and TE was calculated for 5,060 robustly expressed (median FPKM > 1 across organ libraries) 1:1 amniote orthologues in bulk testis across the amniotes (f) and across spermatogenesis stages in mouse (g). h,i, TE (h) and translational shift (i) for clusters of genes (gene numbers in parentheses) with distinct TE patterns (Mfuzz clustering). Arrows indicate TE increases/decrease compared to the respective global pattern (Fig. 1e). *indicates a cluster of genes, which escape expression repression and delay at the translatome layer. j, Expression of individual genes, representing each of the five TE clusters, at the transcriptome and translatome layers (left column); shift in expression timing between expression layers for the corresponding genes (right column) with crosses representing the centers of mass of gene expression across spermatogenesis. k, Tissue-specificity (tissue Tau) across TE clusters. Cluster I, highlighted in color, is dominated by testis-specific genes. Box plots represent the median ± 25th and 75th percentiles, whiskers are at 1.5 times the interquartile range. l, Gene expression divergence at the two expression layers for genes with stage-specific expression across spermatogenesis among 8,109 1:1 orthologues robustly expressed (FPKM > 1) in macaque, mouse, and opossum. Sc, spermatocytes, rSd, round spermatids, eSd, elongating/elongated spermatids, Sz, spermatozoa.
Extended Data Fig. 4
Extended Data Fig. 4. GO enrichment analyses.
a-d, Top 5 significantly enriched GO terms among genes with high (a, b) and low (c, d) TE for brain (a, c; blue) and liver (b, d; green) in mouse. e, Top 10 significantly enriched GO terms for each of the mouse spermatogenesis TE trajectory cluster (Extended Data Fig. 3h-k). f-h, Significantly enriched GO terms (biological processes) among genes that changed significantly more at the translatome compared to the transcriptome layer in brain (f), liver (g), and testis (h). Significance was estimated in Fisher’s exact test (P < 0.05), with P values adjusted for multiple testing using Benjamini-Hochberg method.
Extended Data Fig. 5
Extended Data Fig. 5. Normalization procedures in the evolutionary expression analyses.
a, Illustration of the normalization approach used in our study to globally assess gene expression evolution. In this approach, evolutionary changes in gene expression are based on the assessment of expression differences across 1:1 orthologues between species. Specifically, we quantify the differences across orthologues as the variance (var) of their log2-fold expression changes between species (left column), which is then divided (normalized) by the expression variation, calculated as the variance (var) of expression levels across genes, averaged across all studied species (right column). This procedure provides the expression divergence estimate (d). We note that the variance is similar across species for a given organ and expression layer (Fig. 1d). The example shown illustrates changes between human and each of the other five species in brain at the transcriptome layer. b, Illustration of the normalization procedure used to assess the expression evolution of individual genes. The normalization coefficient k is calculated as the ratio of the variances (var) across genes between the translatome and the transcriptome layer. The brain is shown as an example. Organ and species icons were previously used in ref. .
Extended Data Fig. 6
Extended Data Fig. 6. Simulation of gene expression divergence across expression layers.
a, Simulation of gene expression divergence across different evolutionary scenarios. Expression divergence at the translatome layer between macaque and mouse brain was modeled over parameters of compensation and TE change (see “Modeling gene expression divergence” in Methods for details). Red (blue) correspond to simulated scenarios with expression divergence higher (lower) than in actual data. Black line corresponds to simulated scerarios demonstrating expression divergence values observed in actual data. b, Contrast in evolutionary rates between the two expression layers for simulated data. Δ was calculated for simulated datasets with different amounts of compensation and different amounts of, corresponding to expression variation between individuals and measurement errors (see Methods for details).
Extended Data Fig. 7
Extended Data Fig. 7. Contrast in evolution between transcriptome and translatome layers for individual genes in downsampled data.
Δ was calculated based on datasets downsampled to 0.5 million in each library for brain (a), liver (b), and testis (c). See Fig. 2e-f in the main text for the analysis of the full dataset.
Extended Data Fig. 8
Extended Data Fig. 8. Screenshot of SATB2 gene in Ex2plorer app.
SATB2 is an example of a gene that changes significantly less on translational layer compared to transcriptional layer in mammalian brain. Organ icons were previously used in ref. .
Extended Data Fig. 9
Extended Data Fig. 9. Evolution at the proteome layer between human and mouse brain for genes with slower/faster evolution at the translatome compared to the transcriptome layer.
Absolute rank changes of proteome expression levels were calculated for genes with slower (olive) and faster (purple) evolution at the translatome compared to the transcriptome layer. The difference of the distributions between the two gene sets is statistically significant (****P < 0.0001, Mann-Whitney U test, two-sided). Box plots represent the median ± 25th and 75th percentiles, whiskers are at 1.5 times the interquartile range.
Extended Data Fig. 10
Extended Data Fig. 10. Mammalian lineage-specific changes between expression layers.
a-c, Number of genes with lineage-specific patterns of slower (olive) or faster (purple) evolution at the translational layer, potentially driven by stabilizing and directional selection, respectively, for brain (a), liver (b), and testis (c). Due to the lack of a biological replicate, the branch leading to human was omitted in the liver phylogeny for the transcriptional layer. d, e, Examples of individual genes with potential patterns of stabilizing (d) or directional (e) evolution. Species names with significant changes are marked by corresponding colors. Organ and species icons were previously used in ref. .
Extended Data Fig. 11
Extended Data Fig. 11. Compensatory evolution of X-linked genes.
a, b, examples of upregulation for the dosage reduction at the transcriptome layer. Species affected by upregulation are shown in olive, with arrows representing compensatory changes at the translatome layer. c, Median ratio of X-linked gene expression values in murine spermatogenic cell types to expression values of their 1:1 orthologues in chicken testis. In all cases log2-ratio at the translatome layer is significantly (P < 0.05, Mann-Whitney U test, two-sided) higher than at the transcriptome layer (marked in bold). Solid vertical lines correspond to expression levels expected under no dosage reduction (i.e., log2-ratio = -1). d, Median current to ancestral gene expression ratios at two expression layers for 1:1 orthologous autosomal genes located on chromosome 4 in chicken for brain, liver, and testis. Chicken orthologues were used as a proxy for ancestral expression. See Fig. 4a and main text for details. e, Normalized TEs for 1:1 orthologues of eutherian X-linked and autosomal genes across amniote organs. Mann-Whitney U tests (two-sided) were performed for statistical comparisons (non-significant, ns: P > 0.05, ***P = 0.00003, ****P < 0.0001). P values were adjusted for multiple testing using Bonferroni method. Box plots represent the median ± 25th and 75th percentiles, whiskers are at 1.5 times the interquartile range. Organ and species icons were previously used in ref. .
Fig. 1
Fig. 1. Regulatory dynamics across expression layers.
a, Overview of data produced. b, Pairwise correlations (Spearman’s ρ) between transcriptomes, translatomes, and proteomes (data from ref. ) were calculated for 9,642 genes, detected at all three expression layers in human brain, liver, and testis. c, Distribution of expression levels at the translatome layer (dark blue, measured based on Ribo-seq), compared to the transcriptome layer (light blue, measured based on RNA-seq). d, The expression variation, quantified as the variance (var) across genes of log2(FPKM+1)-transformed expression values, is calculated for expression levels at the translatome (dark colors) and transcriptome (light colors) layers. e, TE (normalized log2-transformed values) along mouse spermatogenesis was calculated for 14,979 genes detected (FPKM > 0) across all 4 stages (Sc, spermatocytes, rSd, round spermatids, eSd, elongating/elongated spermatids, Sz, spermatozoa). The zero line corresponds to the median TE of genes inferred to be expressed predominantly in somatic cells. f, Translational shift (delay) for each gene, calculated as the difference between the centers of mass for the transcriptome and translatome layers along spermatogenesis. Organ and species icons were previously used in ref. .
Fig. 2
Fig. 2. Evolution of gene expression across expression layers.
a-c, Gene expression phylogenies of 5,060 robustly expressed (FPKM > 1 across all libraries) 1:1 orthologues at the transcriptome (light and thick branches) and translatome (dark and thin) layers for brain (a), liver (b), and testis (c). Branch lengths represent the fractions of expression variation, which correspond to evolutionary changes in expression levels (Extended Data Fig. 5a). Due to the lack of a biological replicate, the branch leading to human was omitted in the liver phylogeny for the transcriptome layer. Proportions of bootstrapped trees supporting branching patterns are indicated next to the respective nodes. d-f, Differences in the evolution between transcriptome and translatome layers for individual genes in brain (d), liver (e), and testis (f). Density distribution, median Δ, interquartile range (IQR) of Δ, and number of cases with Δ significantly higher (potentially driven by directional selection) or lower (stabilizing selection) than zero are shown to the right of each panel. All genes in graphs d-f can be interactively explored in our Ex2plorer database (https://ex2plorer.kaessmannlab.org/). g, Similarity of gene expression (rank) changes between human and mouse brains at the proteome layer compared to the changes at the underlying translatome and transcriptome expression layers, respectively, as assessed by Spearman’s correlation coefficients (ρ). Proteomics data were retrieved from previous studies,. Organ and species icons were previously used in ref. .
Fig. 3
Fig. 3. Co-evolution of expression layers across gene classes.
a, Gene-expression divergence at the two expression layers was calculated for all 8,109 1:1 orthologues robustly expressed (FPKM > 1) in macaque, mouse and opossum (Ref), and for specific gene sets: genes with particular spatial expression patterns (broadly expressed (BE) or tissue-specific (TS)); genes with a high (mutation-intolerant, pLI.h) or low (mutation-tolerant, pLI.l) probability of being loss-of-function-intolerant; genes with high (haploinsufficient, HI.h) or low (haplosufficient, HI.l) sensitivity to copy number reductions; and genes that duplicated in the common bony vertebrate ancestor (old) or that have duplication origins in tetrapods (young). Analysis was restricted to three species to increase the number of available 1:1 orthologues. Ratios between rates of gene-expression divergence (translational to transcriptional) are shown to the right of each set of bar plots (vertical lines indicate ratios obtained for the complete set of orthologues). Error bars correspond to 95% confidence intervals, calculated based on 1,000 bootstrap replicates. b, Absolute rank changes of proteome gene expression levels were calculated across the same categories for 6,972 1:1 orthologues, detected in human and mouse brains at all three expression layers; Mann-Whitney U tests (two-sided) were performed for statistical comparisons (***P = 0.00034, ****P < 0.0001). Box plots represent the median ± 25th and 75th percentiles, whiskers are at 1.5 times the interquartile range. c, Contribution of different factors to gene expression divergence rates at the transcriptional and translational layers. Expr, gene expression level (as log2(FPKM+1)); Tau, tissue-specificity, measured as τ; dN/dS, ratio of substitutions in non-synonymous to synonymous sites; pLI – loss of function intolerance; HI – haploinsufficiency; Age – age of the last duplication. Organ and species icons were previously used in ref. .
Fig. 4
Fig. 4. Compensatory evolution of X-linked genes.
a, Median current to ancestral gene expression ratios at the two expression layers for 1:1 orthologous X-linked genes in eutherians for brain, liver, and testis. Expression levels of chicken orthologues were used as proxy for ancestral expression levels. Platypus genes that are 1:1 orthologous to human X-linked genes and that are present and expressed in chicken were used as a control (i.e., they lack evolutionary dosage reduction and MSCI). Differences in log2-ratios between expression layers are shown to the right of each plot. Cases where the log2-ratio at the translatome layer is significantly (P < 0.05, Mann-Whitney U test, two-sided) higher than at the transcriptome layer are marked in bold. Solid vertical lines correspond to expression levels expected under no dosage reduction. b, Changes in gene expression ranks between transcriptome, translatome, and proteome expression layers for X-linked (X) and autosomal (A) genes for human brain, liver, and testis, respectively. Mann-Whitney U tests (two-sided) were performed for statistical comparisons (non-significant, ns: brain P = 0.416, liver P = 0.399; * P < 0.05, ** P = 0.0067, **** P < 0.0001). Box plots represent the median ± 25th and 75th percentiles, whiskers are at 1.5 times the interquartile range. Organ and species icons were previously used in ref. .

References

    1. Necsulea A, Kaessmann H. Evolutionary dynamics of coding and non-coding transcriptomes. Nat Rev Genet. 2014;15:734–748. - PubMed
    1. Vogel C, Marcotte EM. Insights into the regulation of protein abundance from proteomic and transcriptomic analyses. Nat Rev Genet. 2012;13:227–232. - PMC - PubMed
    1. Khan Z, et al. Primate Transcript and Protein Expression Levels Evolve under Compensatory Selection Pressures. Science. 2013 - PMC - PubMed
    1. Brar GA, Weissman JS. Ribosome profiling reveals the what, when, where and how of protein synthesis. Nat Rev Mol Cell Biol. 2015;16:651–664. - PMC - PubMed
    1. Ingolia NT, Ghaemmaghami S, Newman JR, Weissman JS. Genome-wide analysis in vivo of translation with nucleotide resolution using ribosome profiling. Science. 2009;324:218–223. - PMC - PubMed

Publication types

MeSH terms