. 2020 Dec;588(7837):296-302.
doi: 10.1038/s41586-020-2926-0. Epub 2020 Nov 11.

Chemico-genetic discovery of astrocytic control of inhibition in vivo

Affiliations

Chemico-genetic discovery of astrocytic control of inhibition in vivo

Tetsuya Takano et al. Nature. 2020 Dec.

Abstract

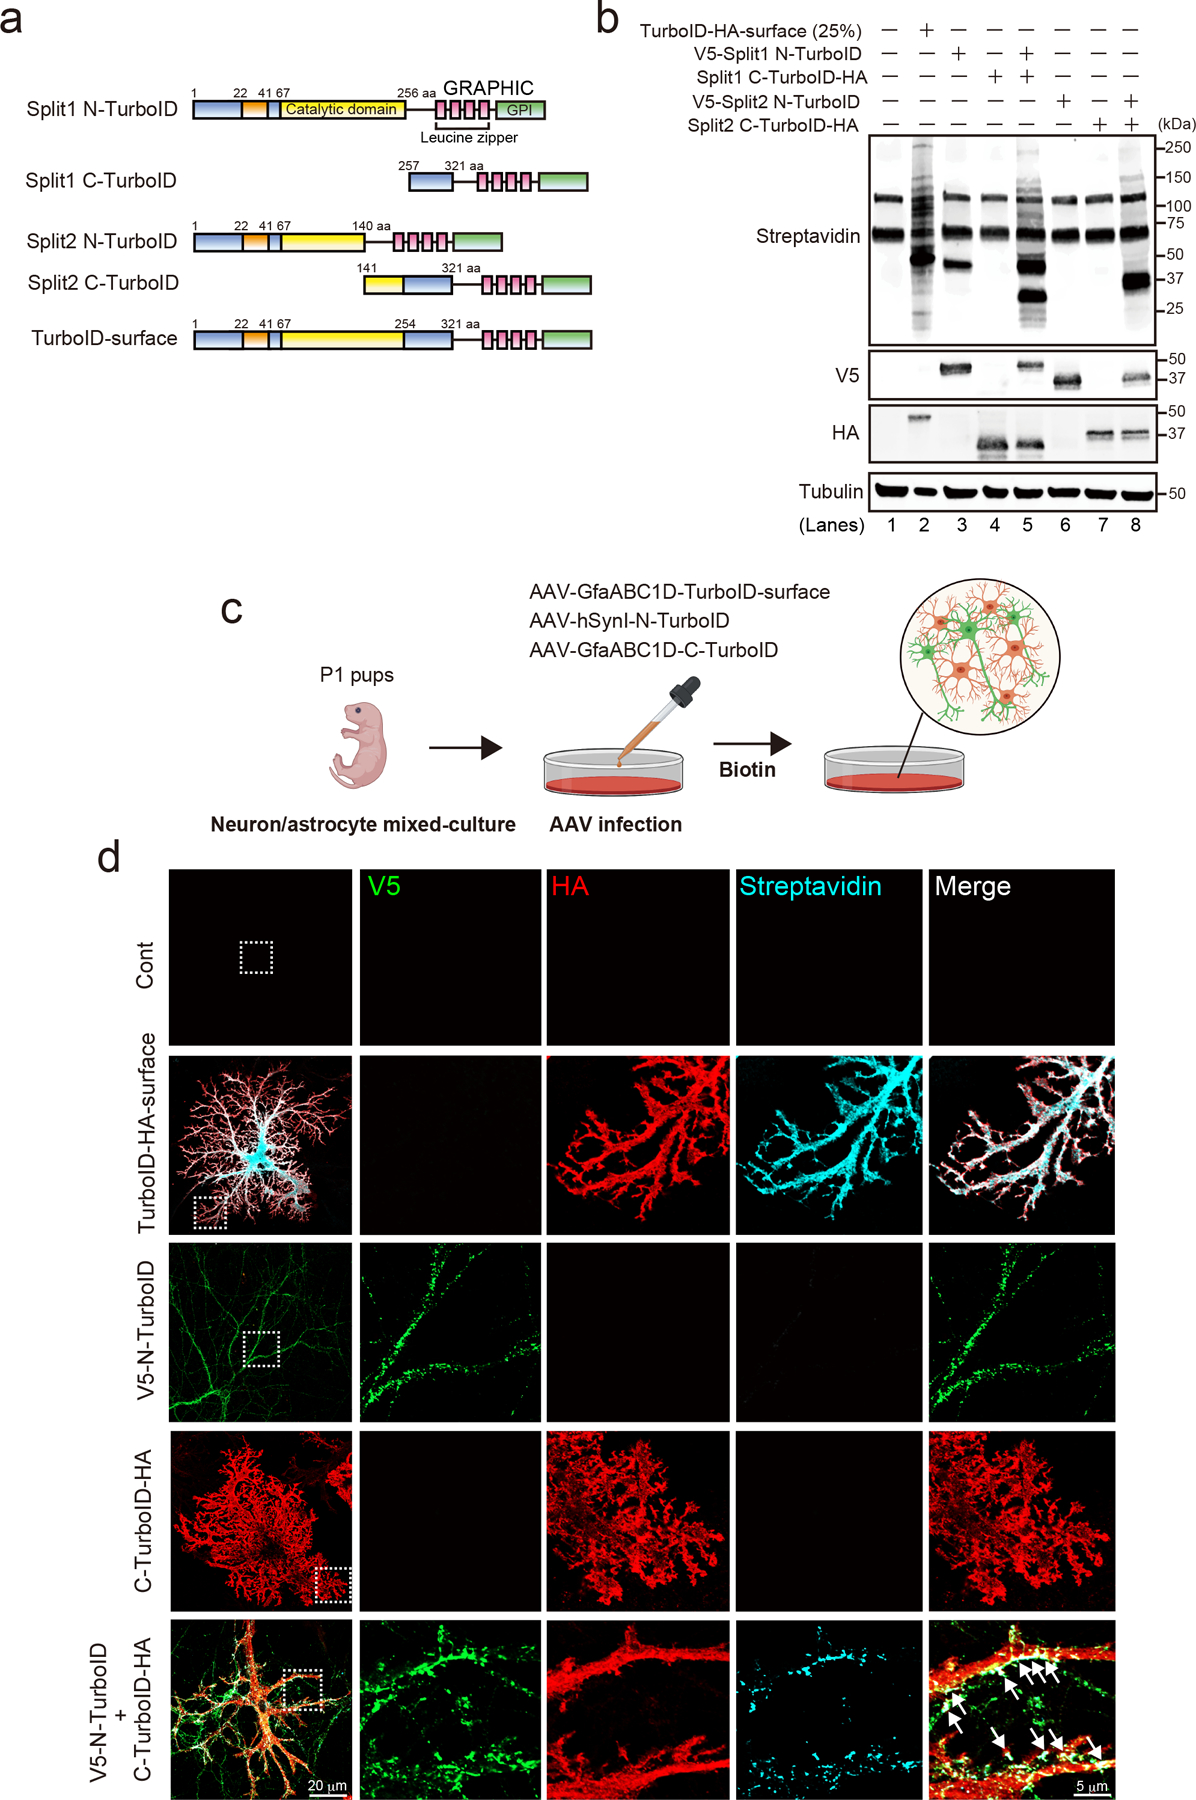
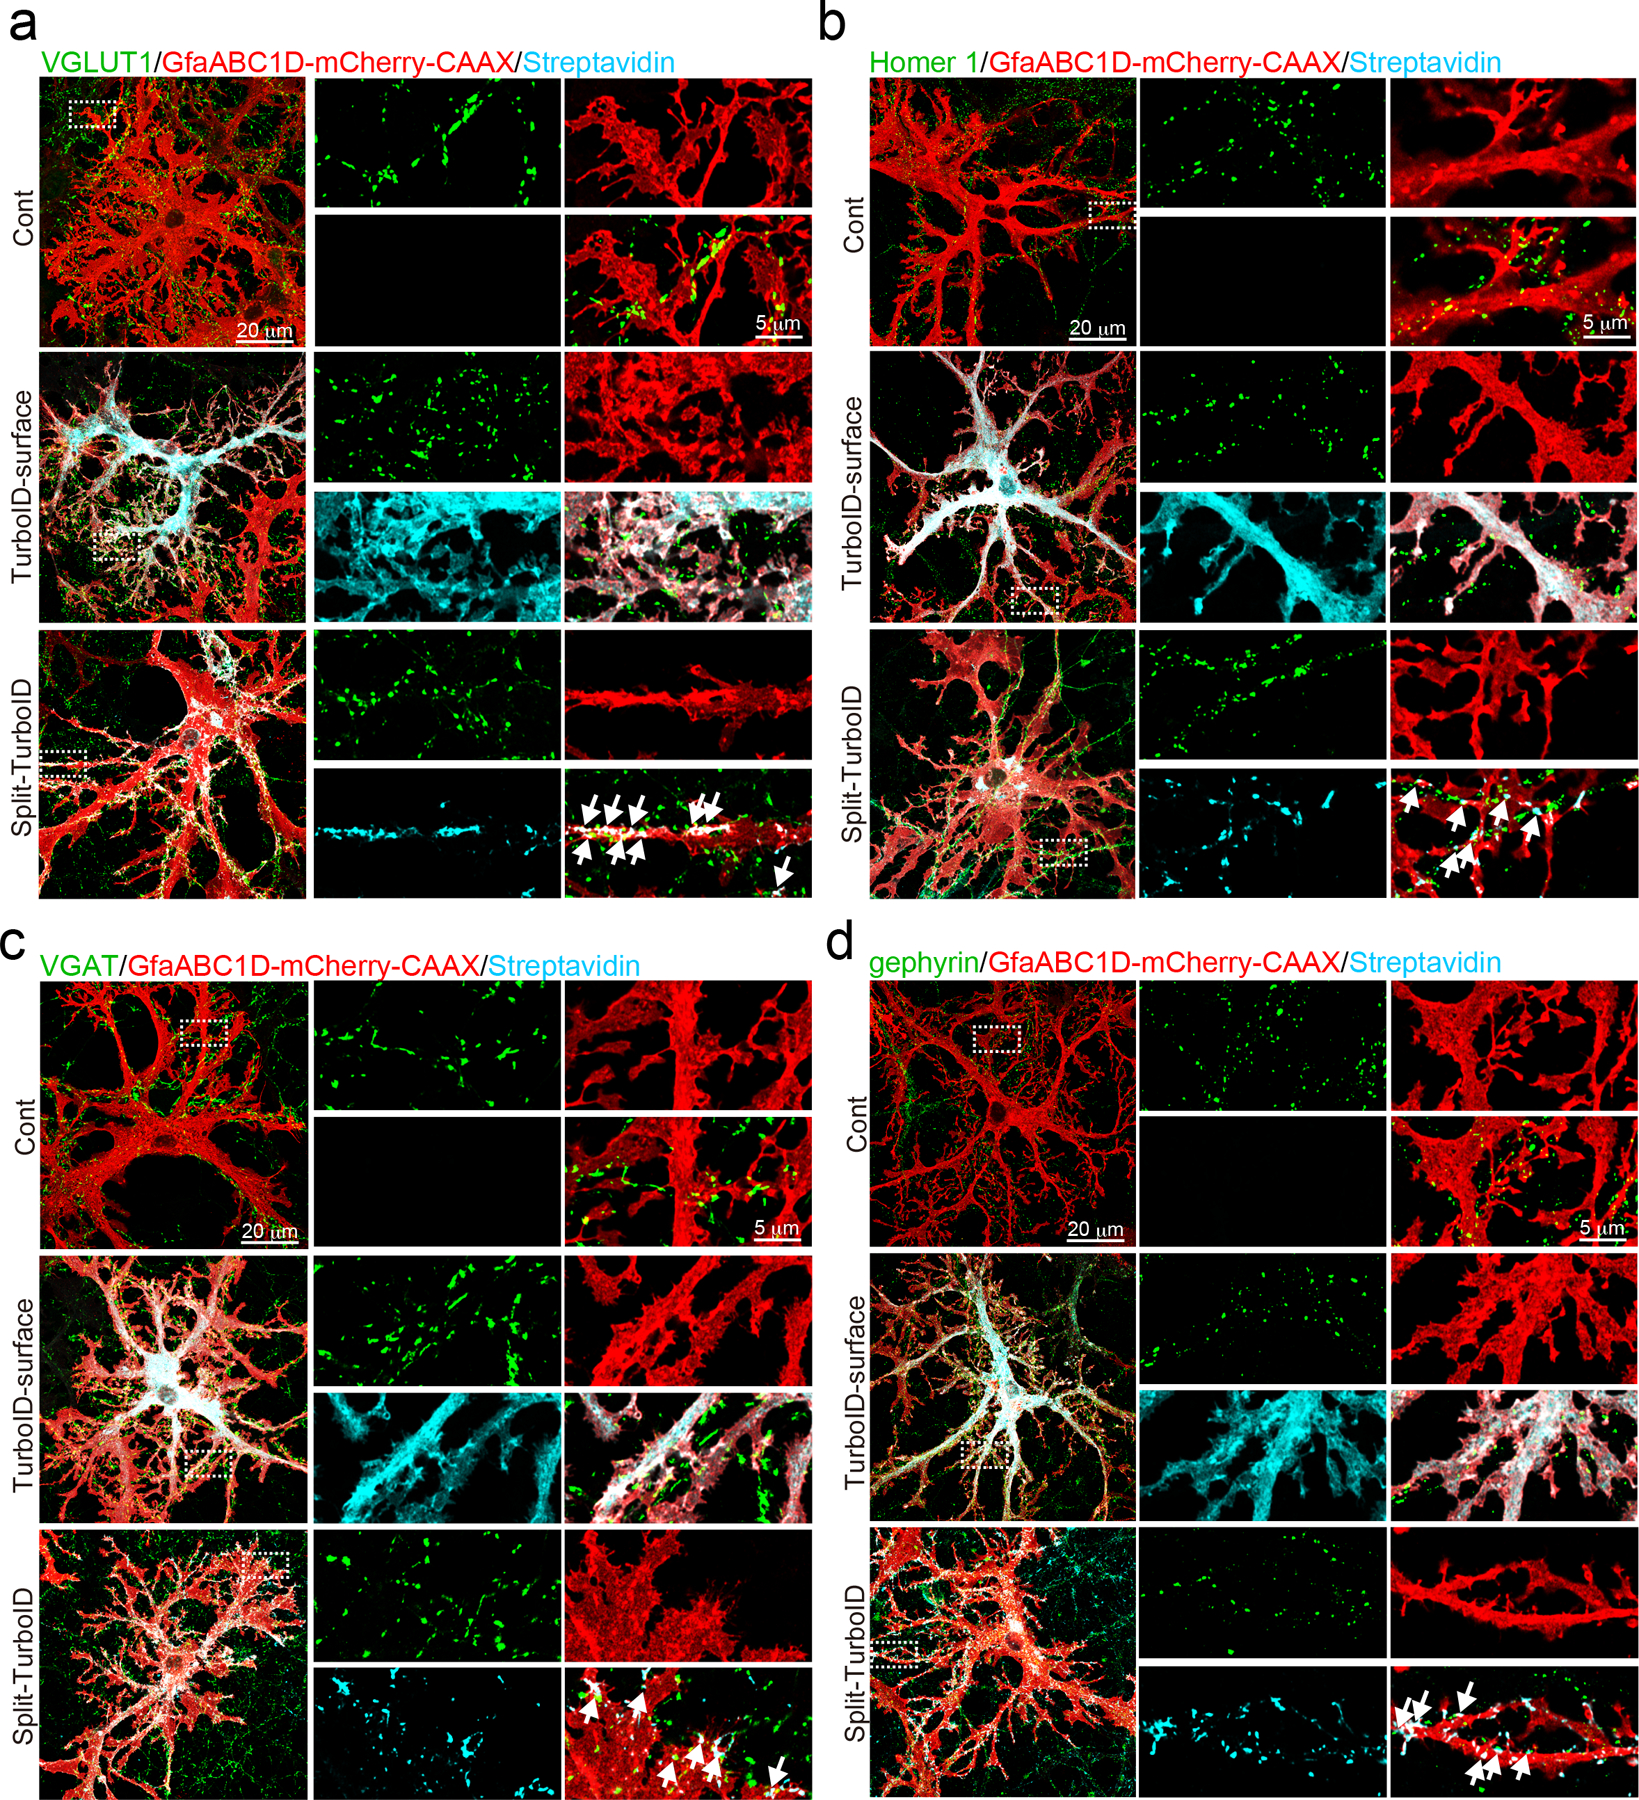
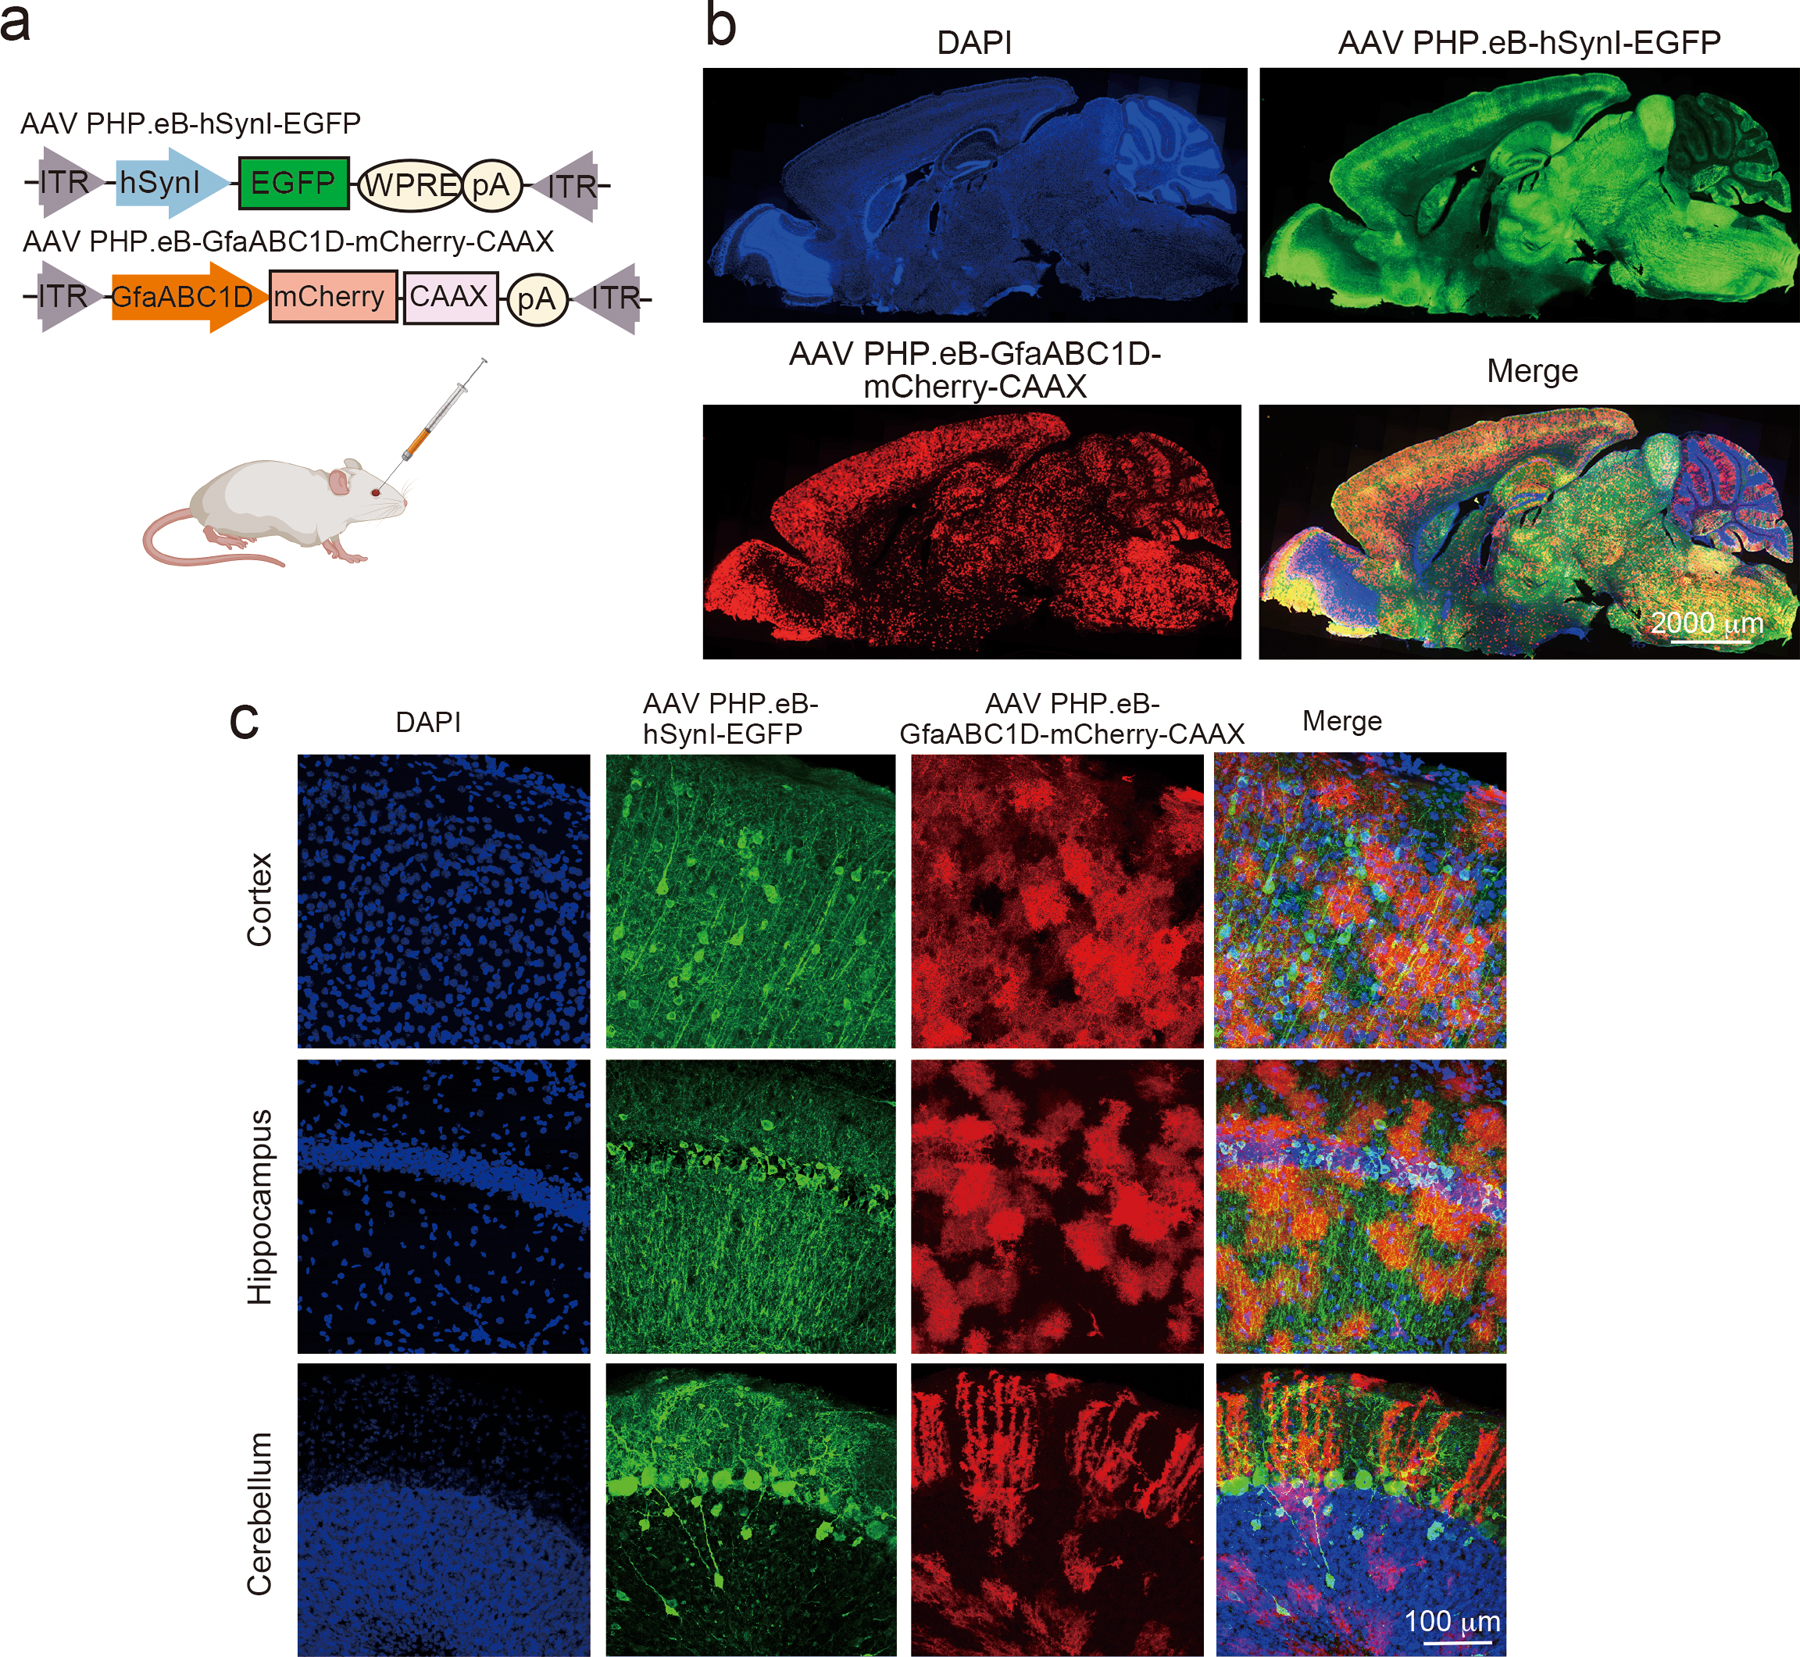
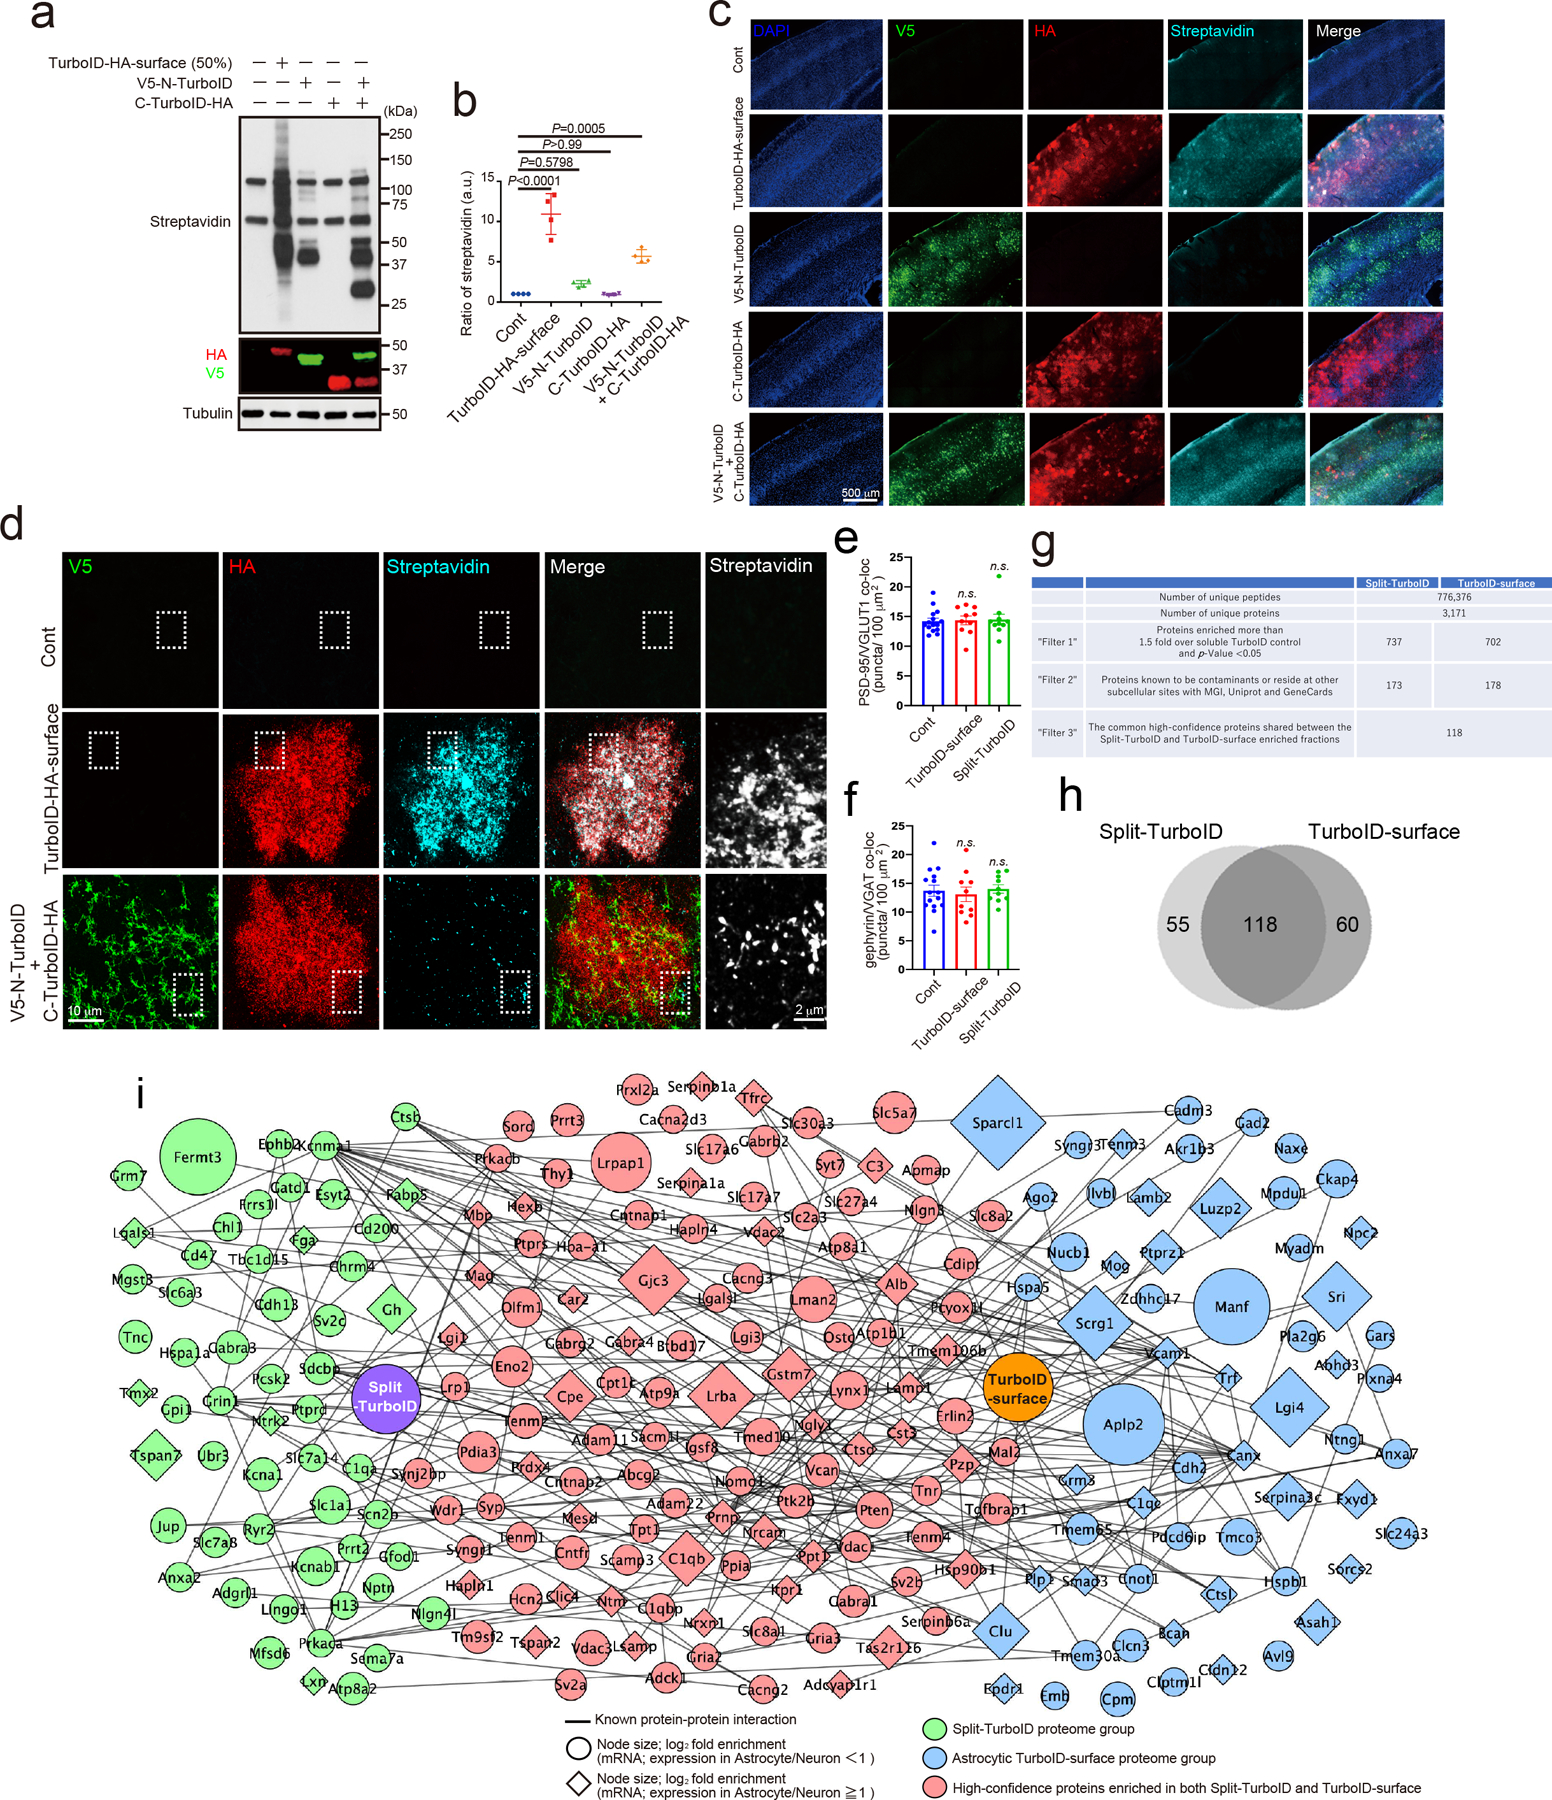
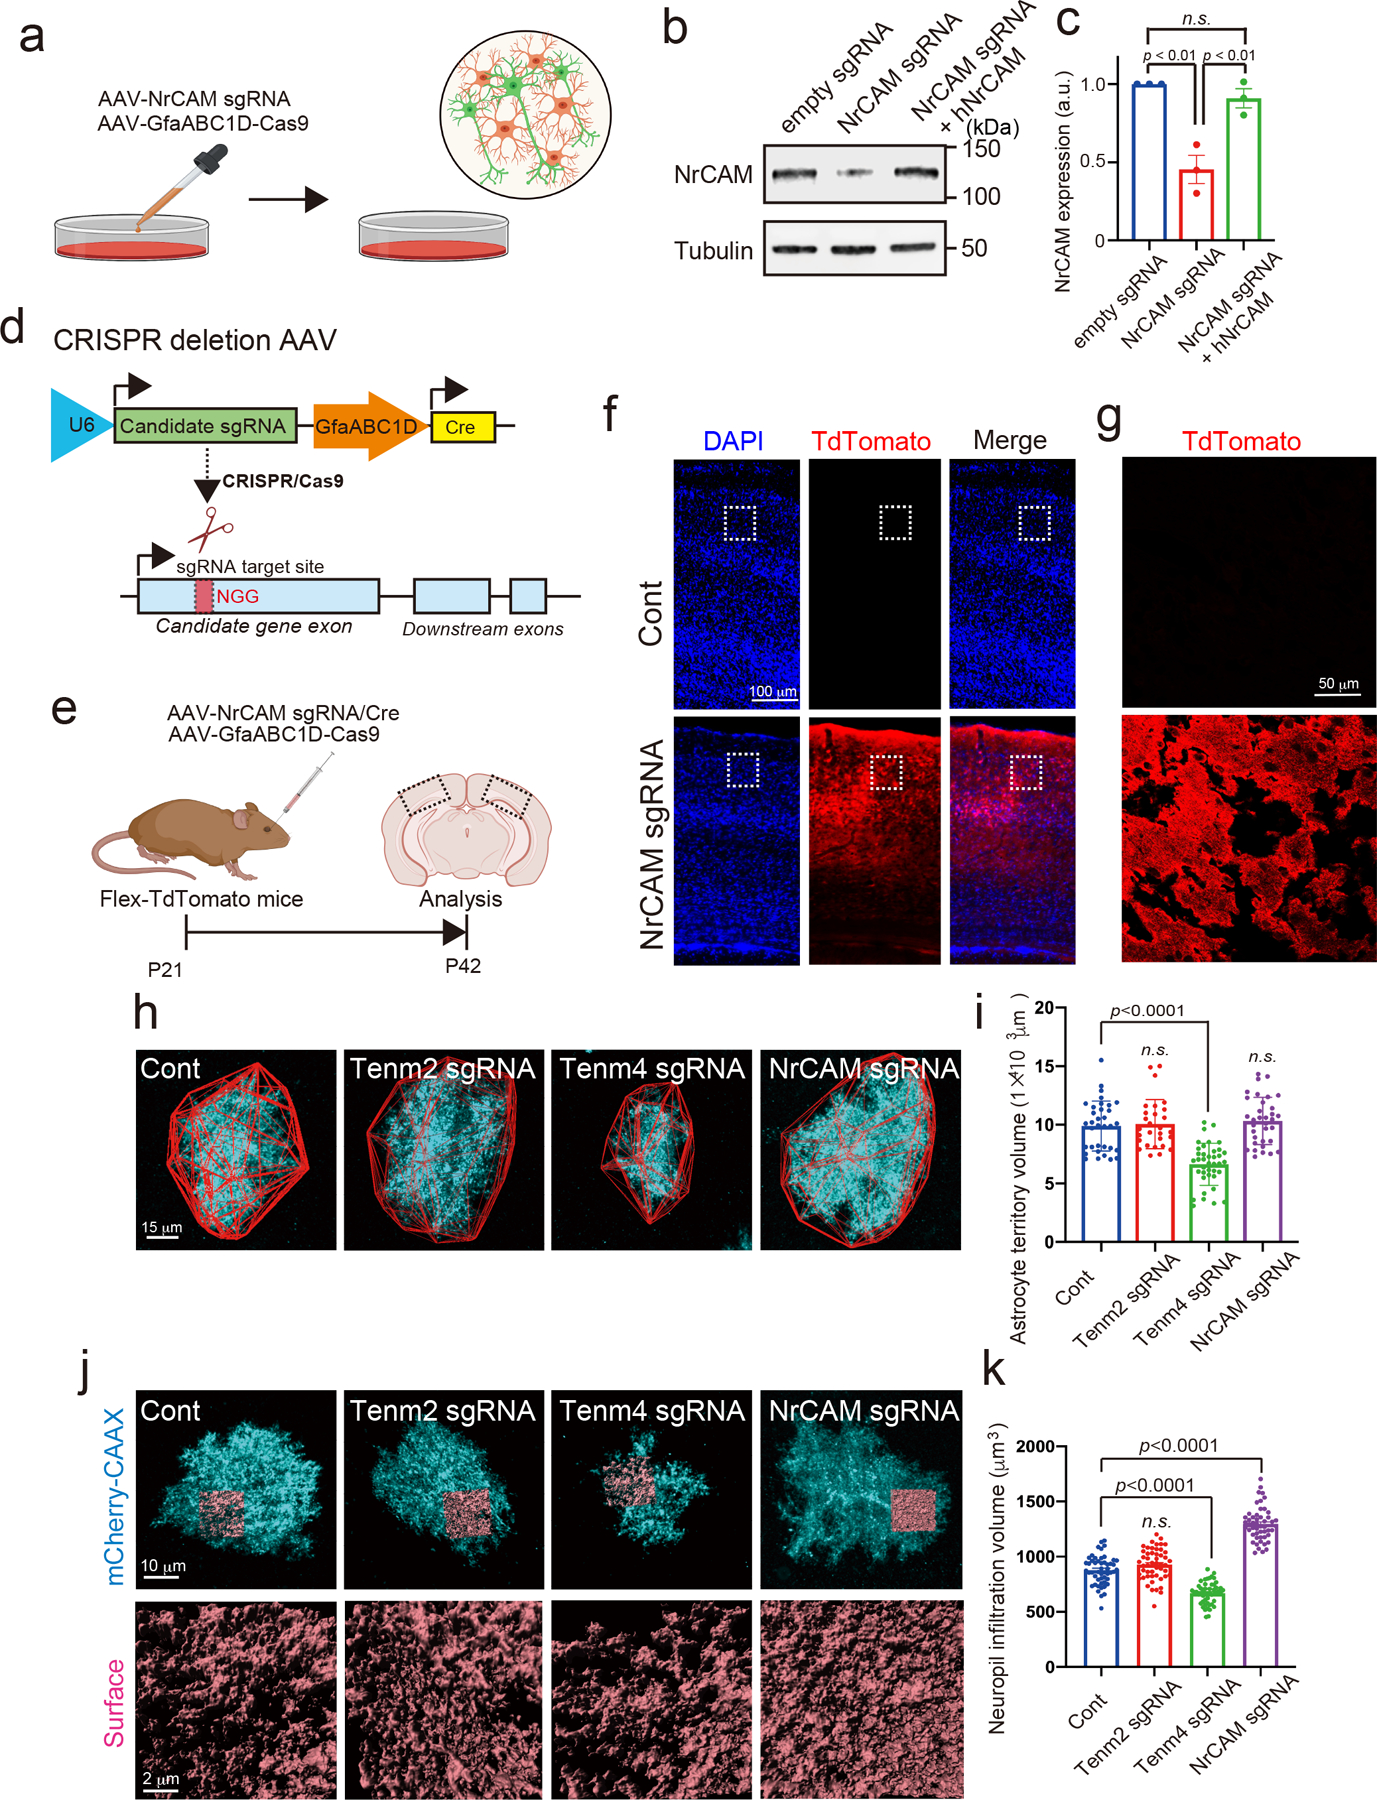
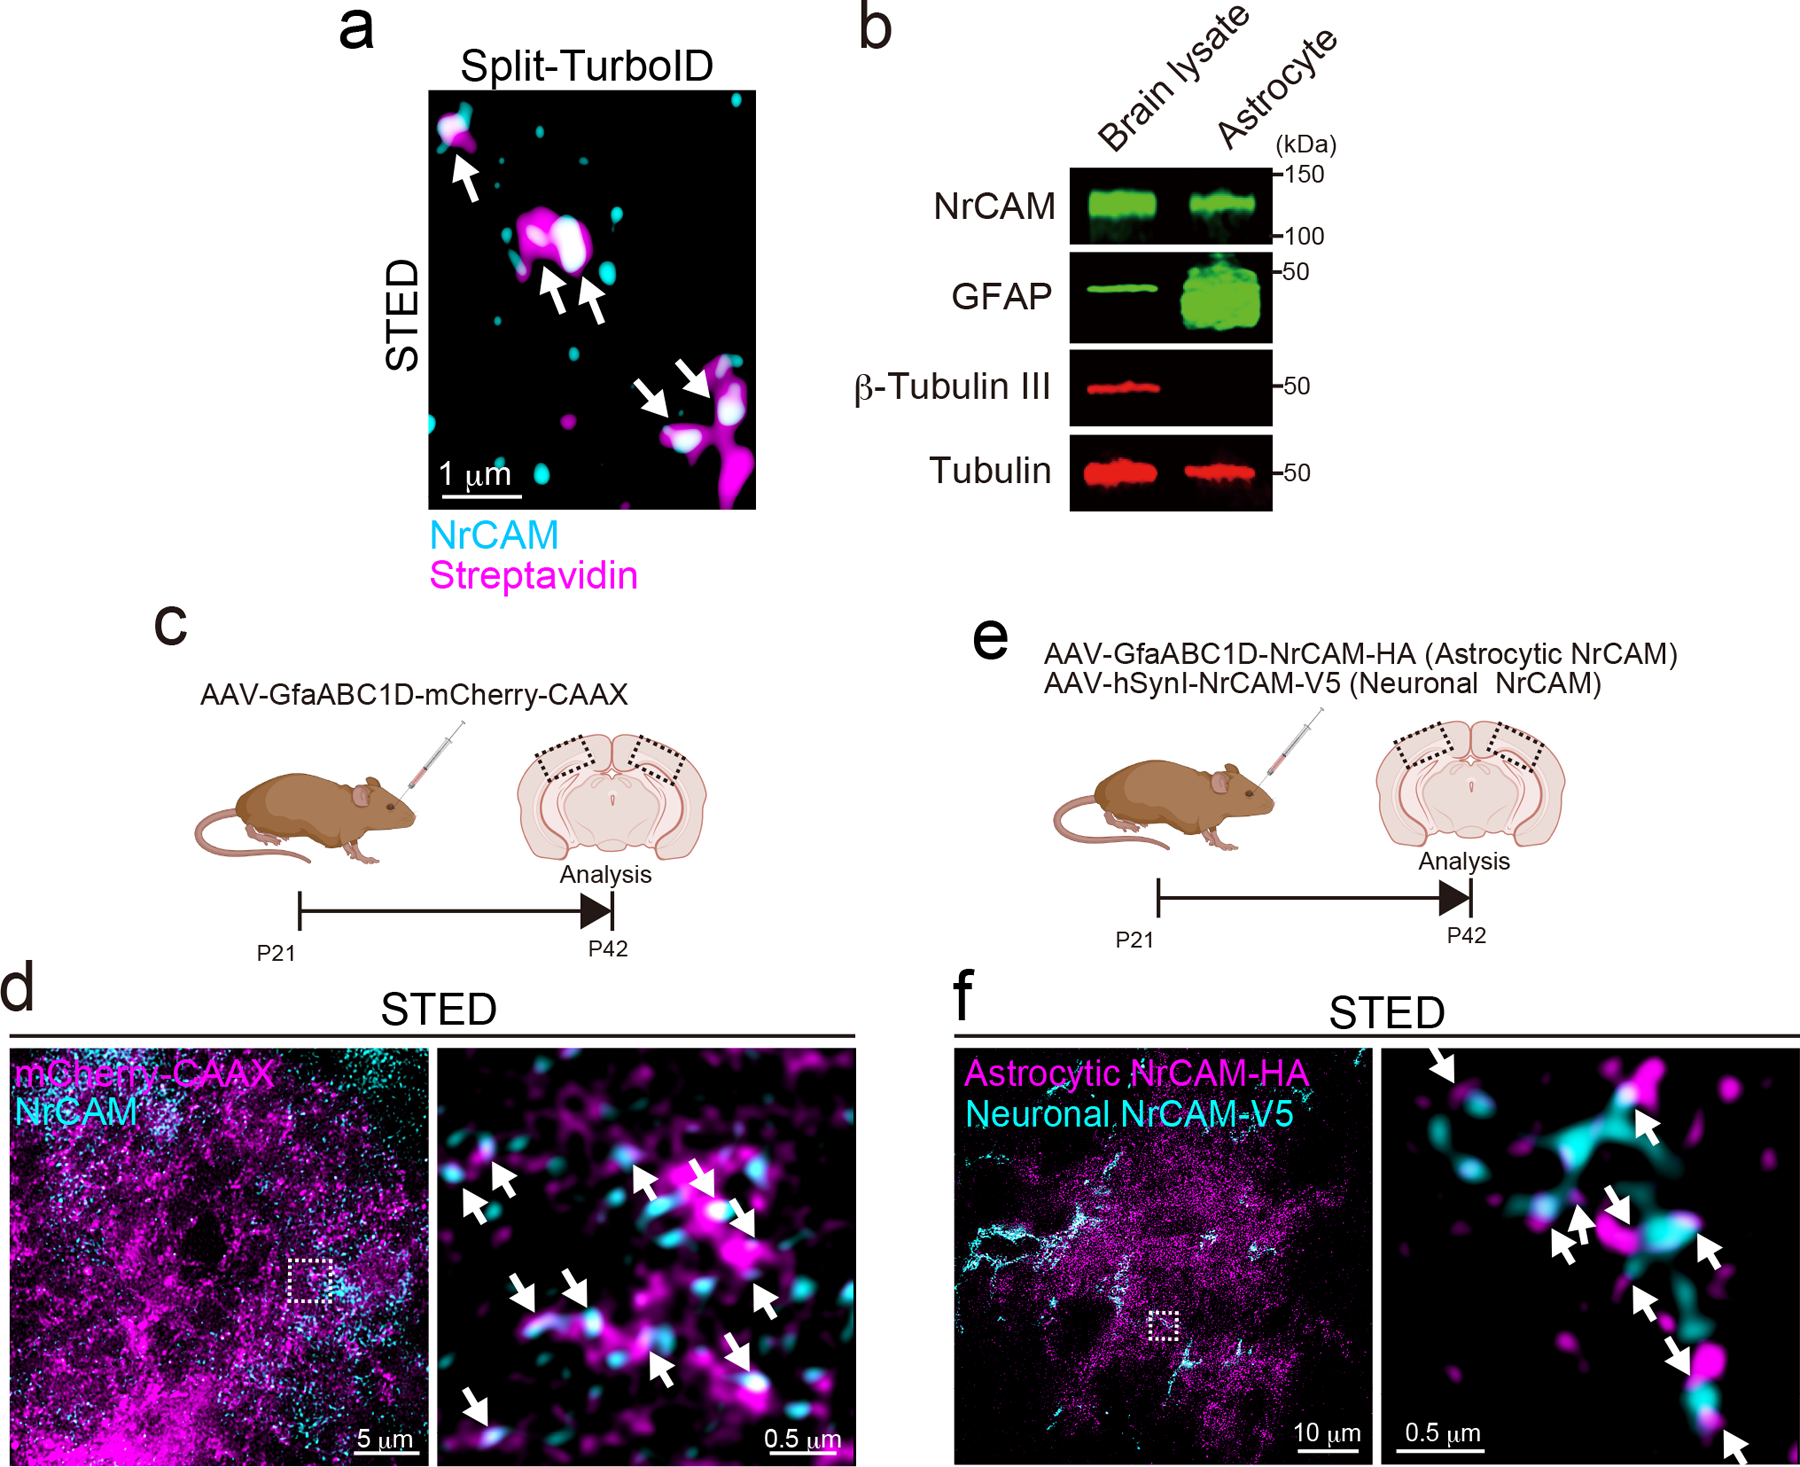
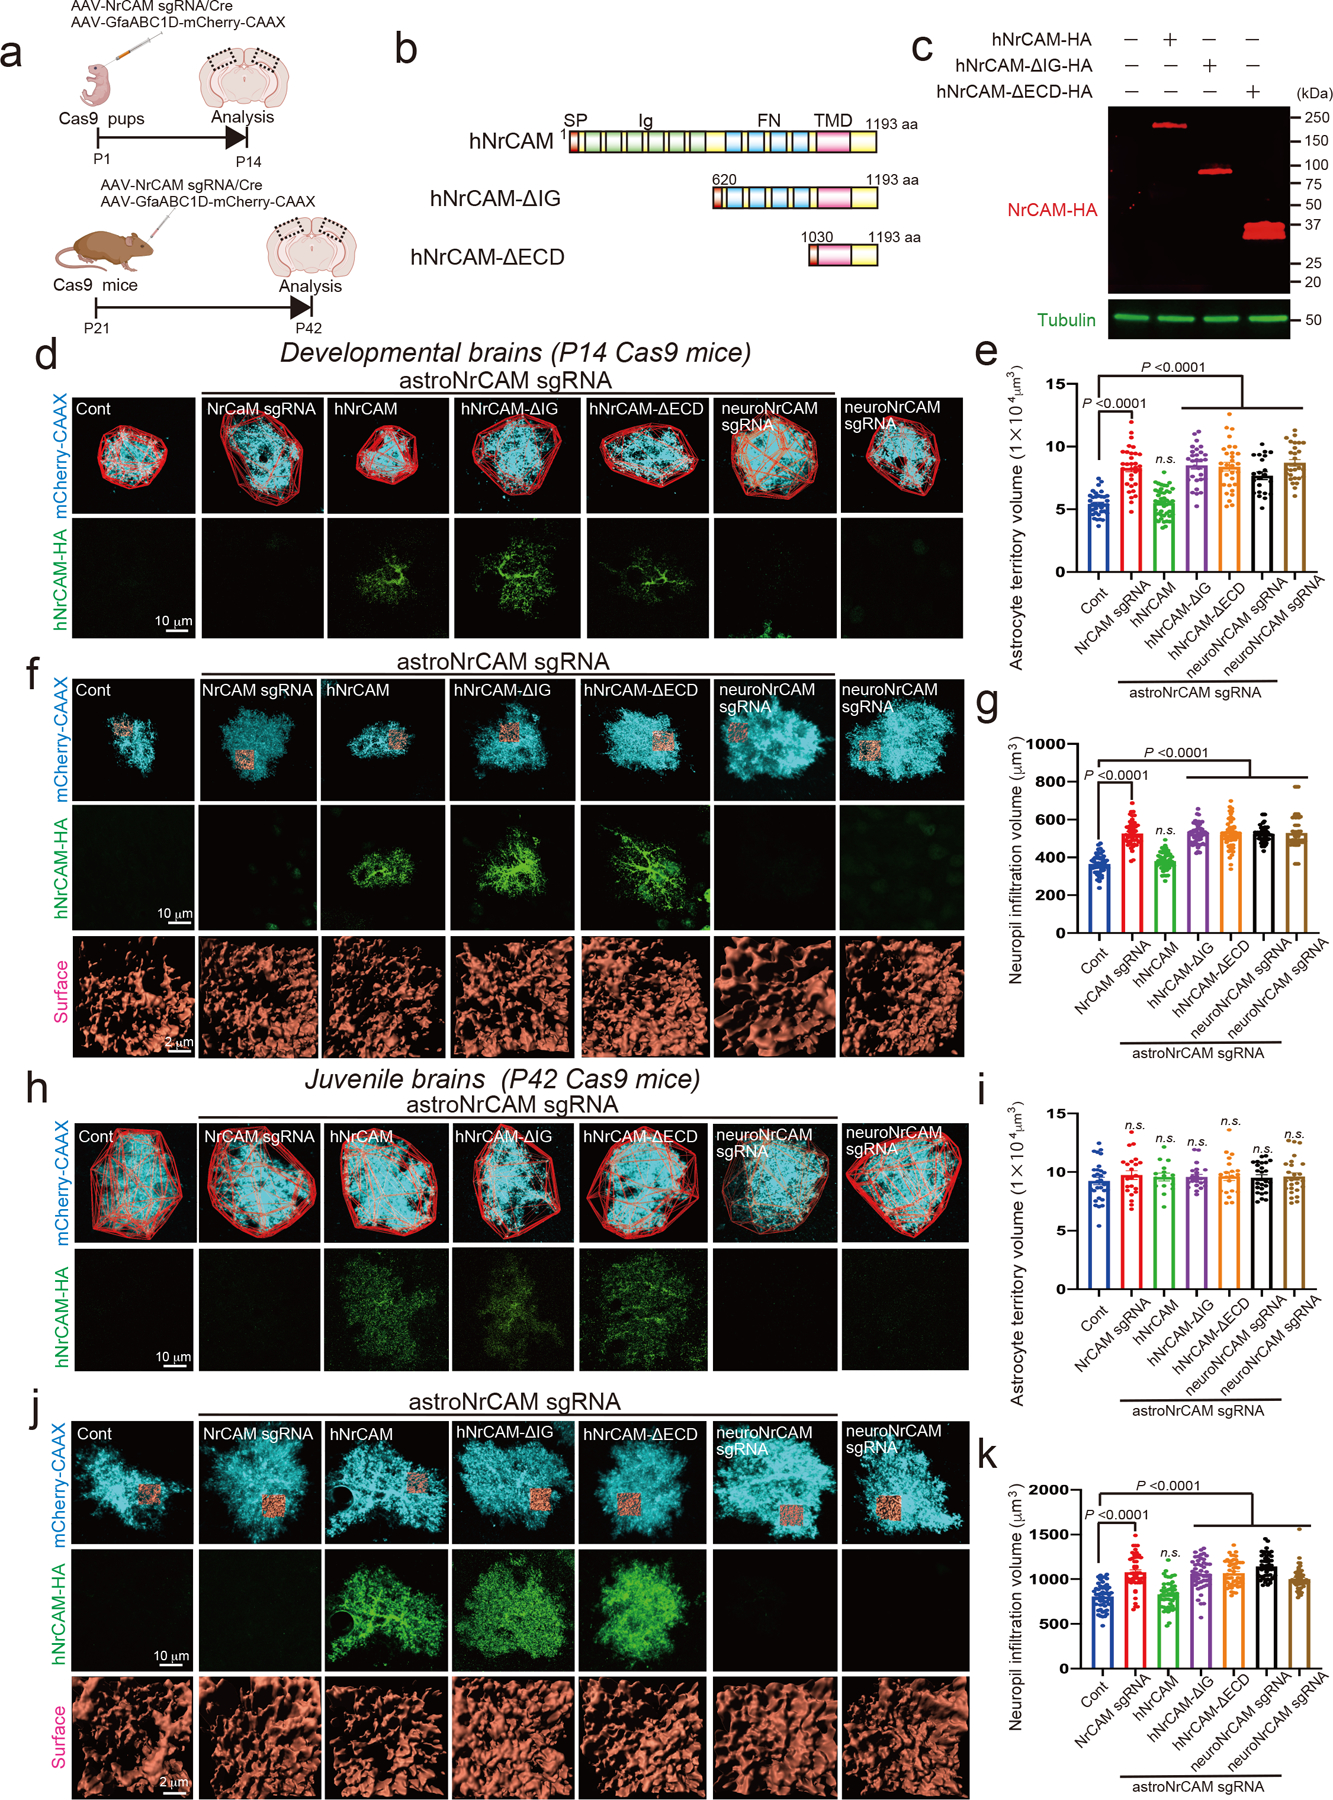
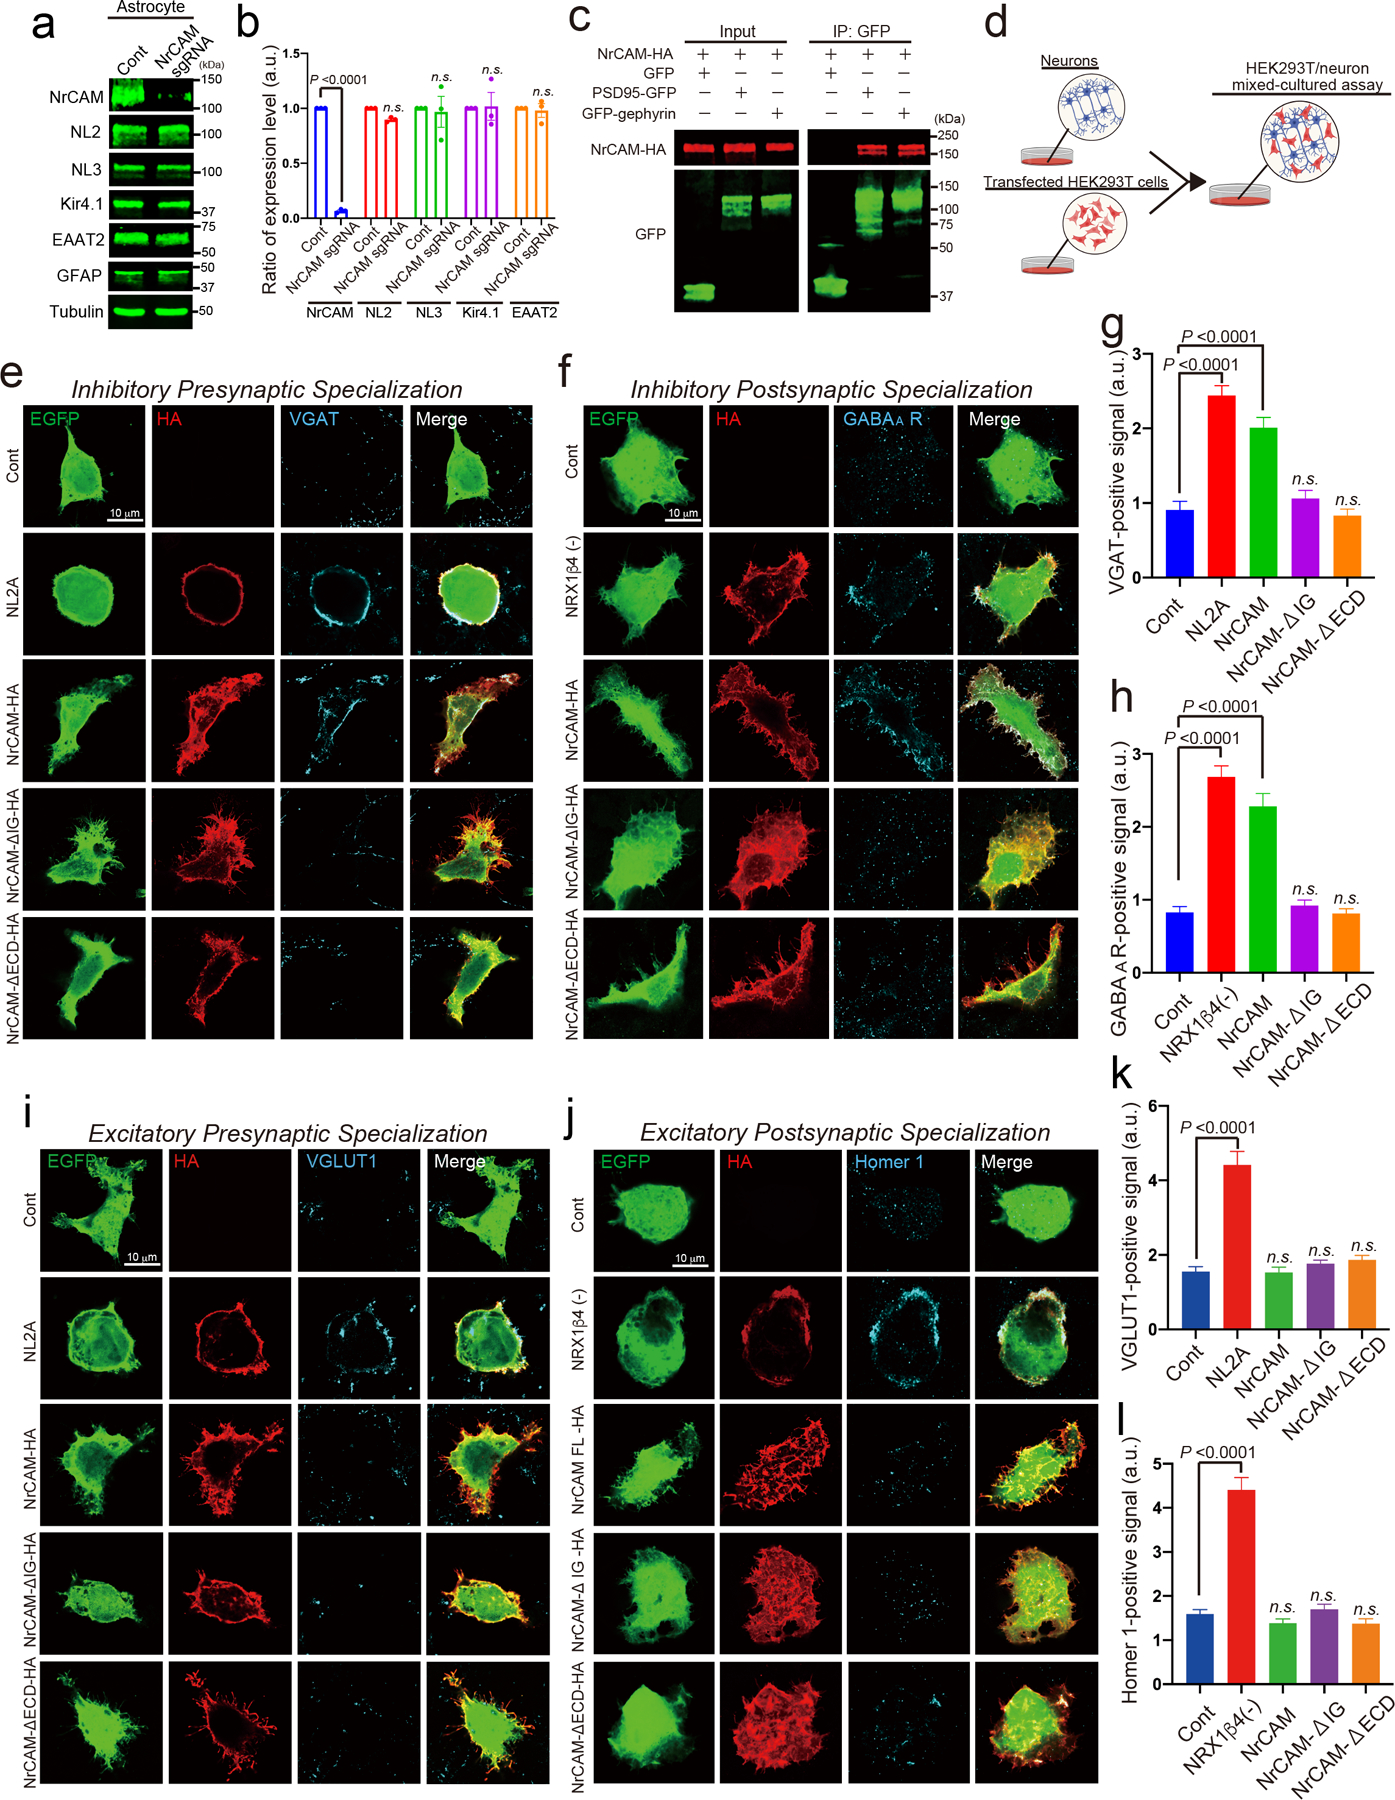
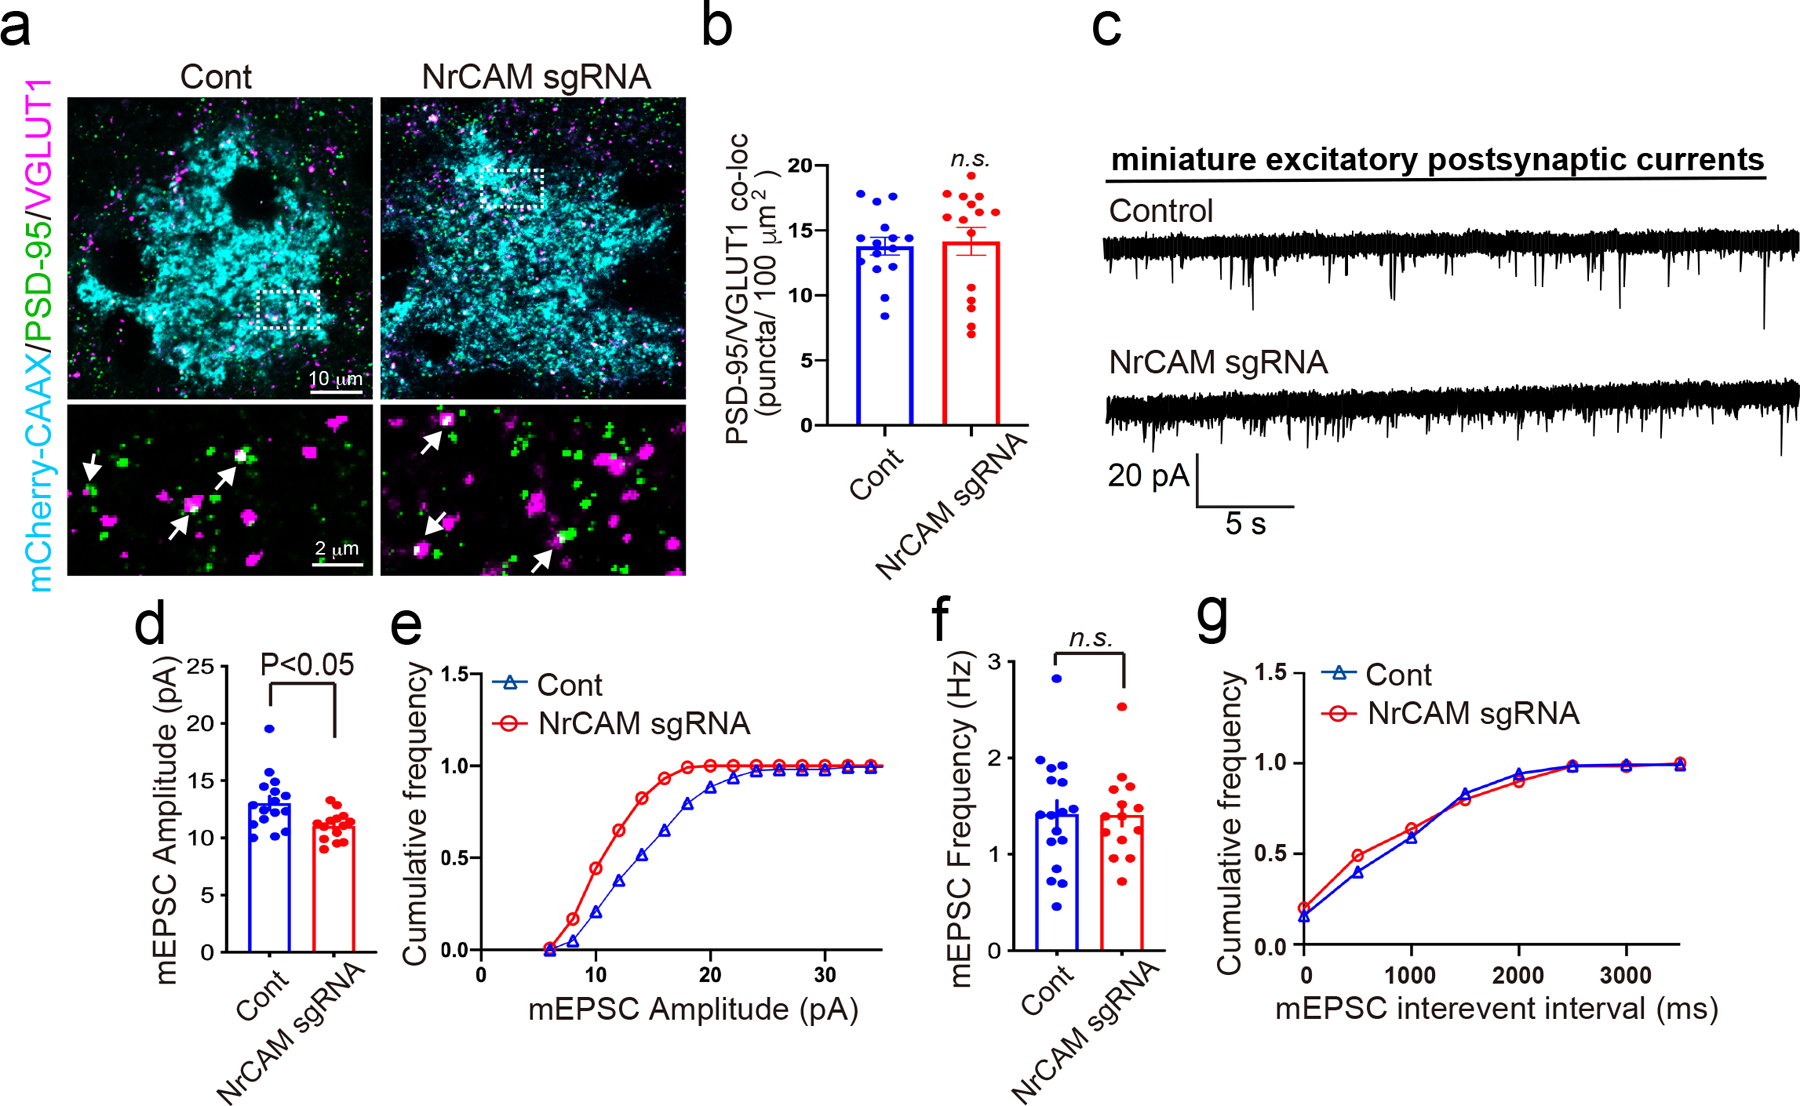
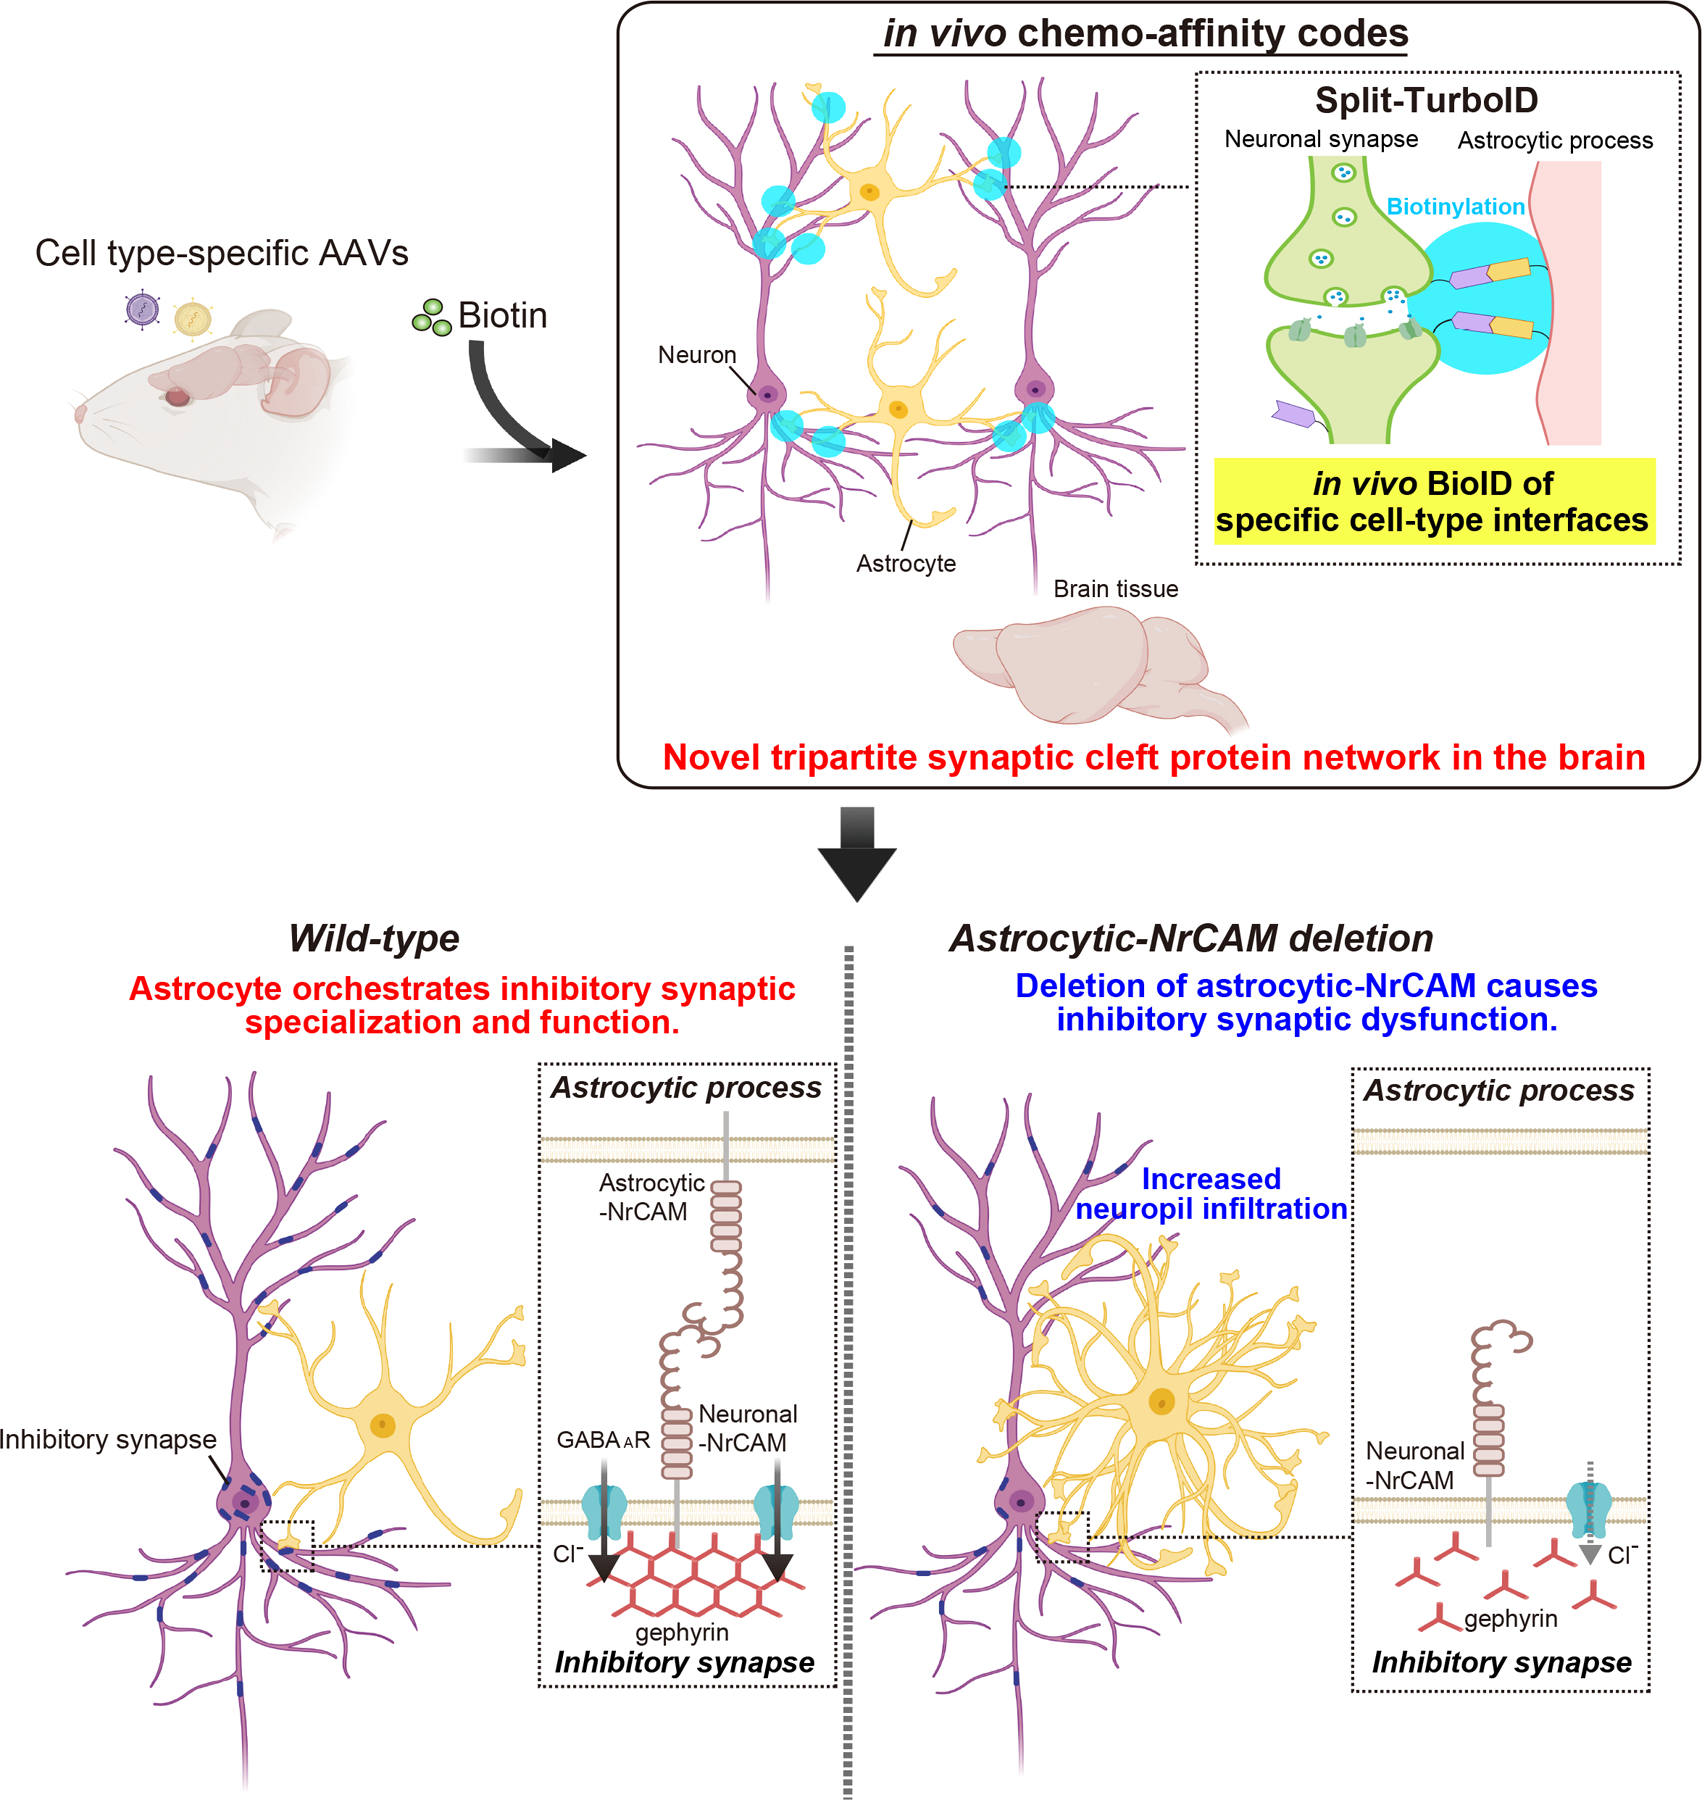
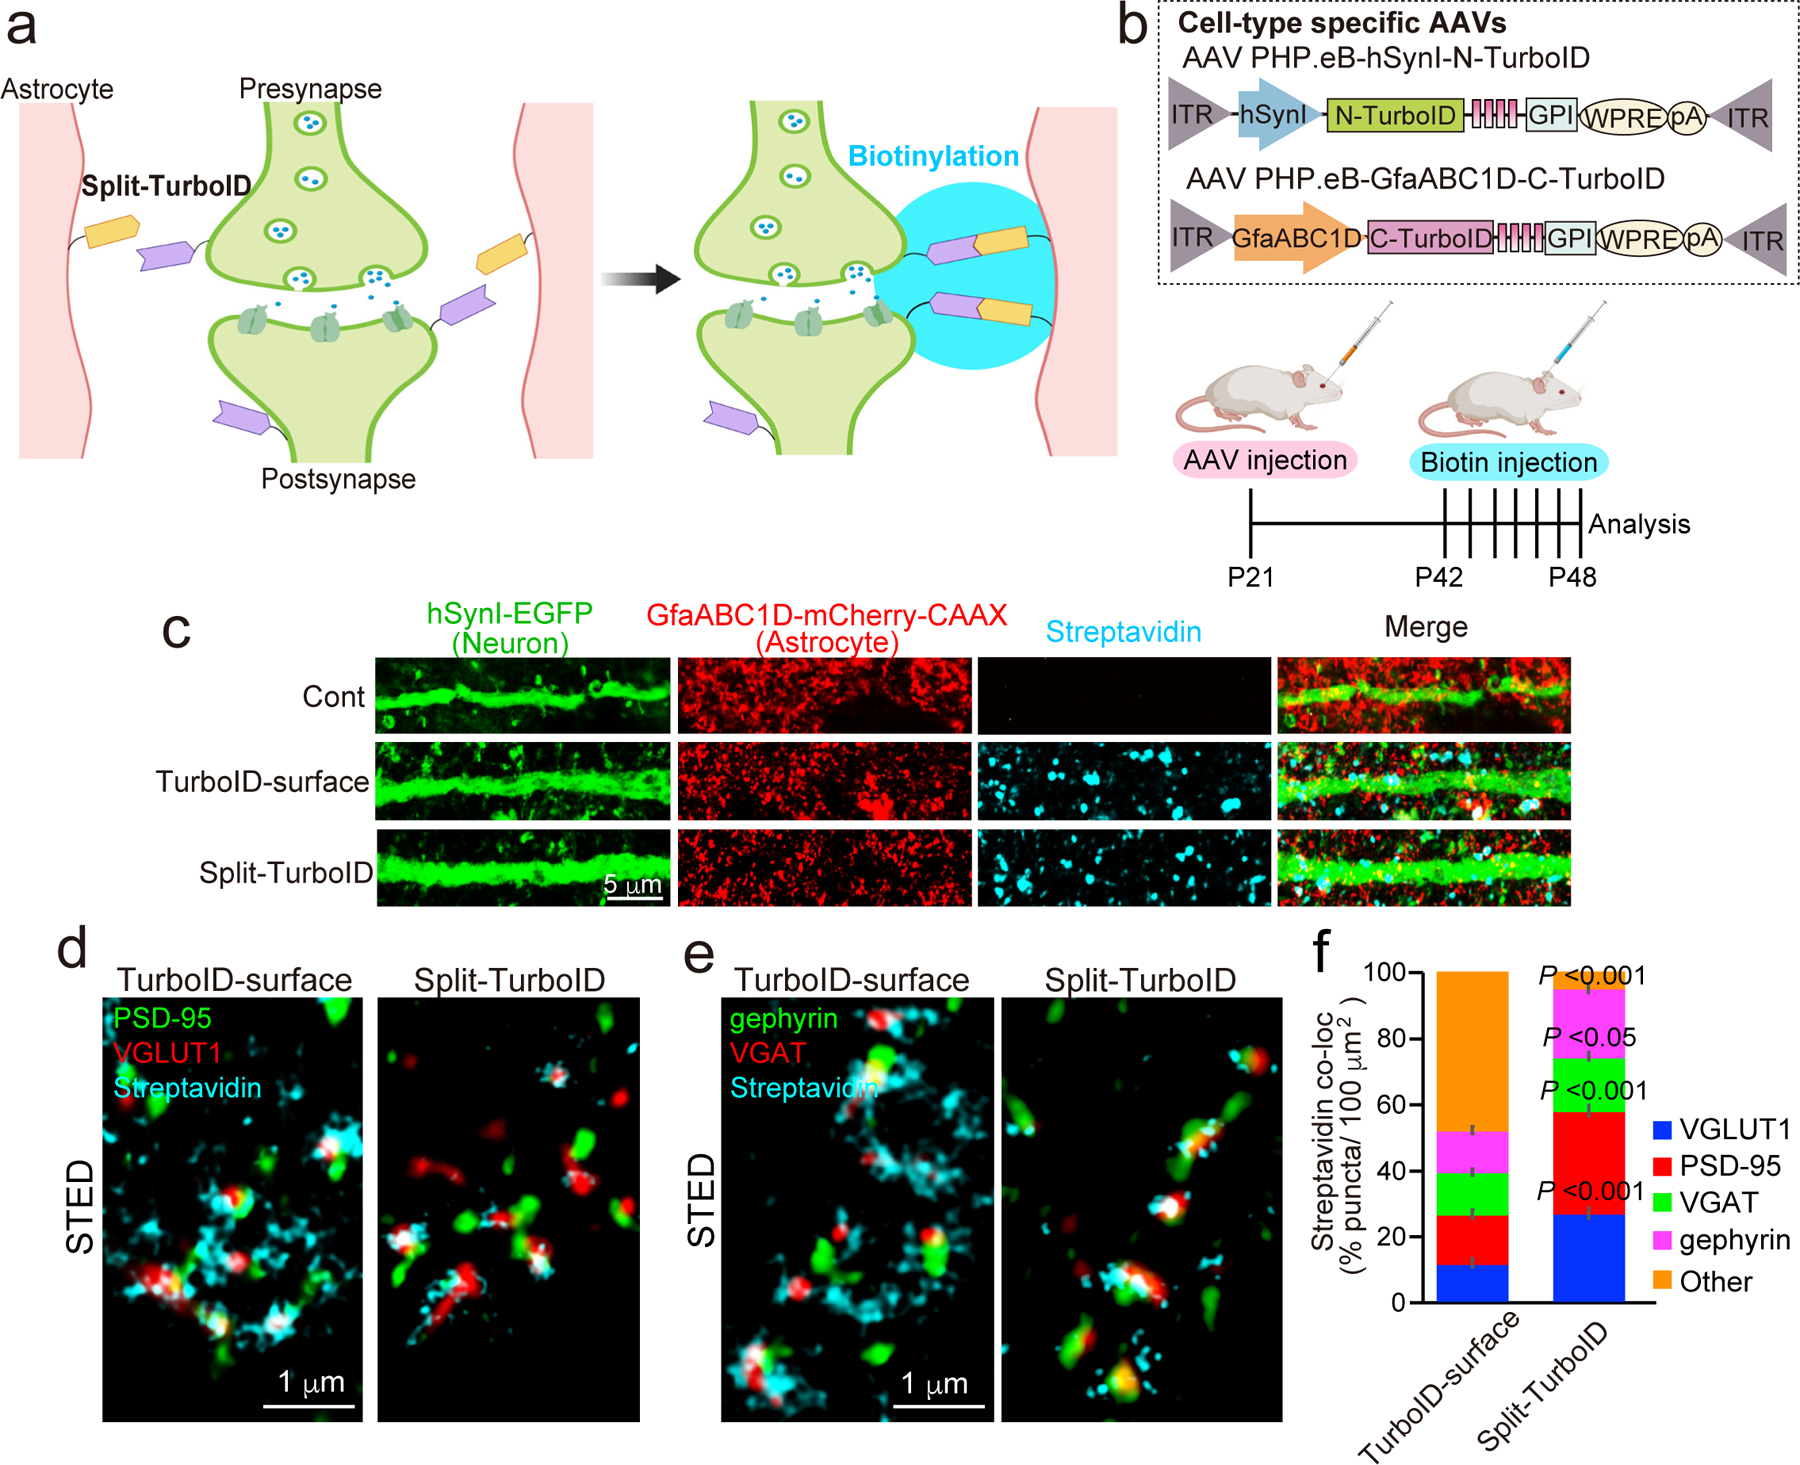
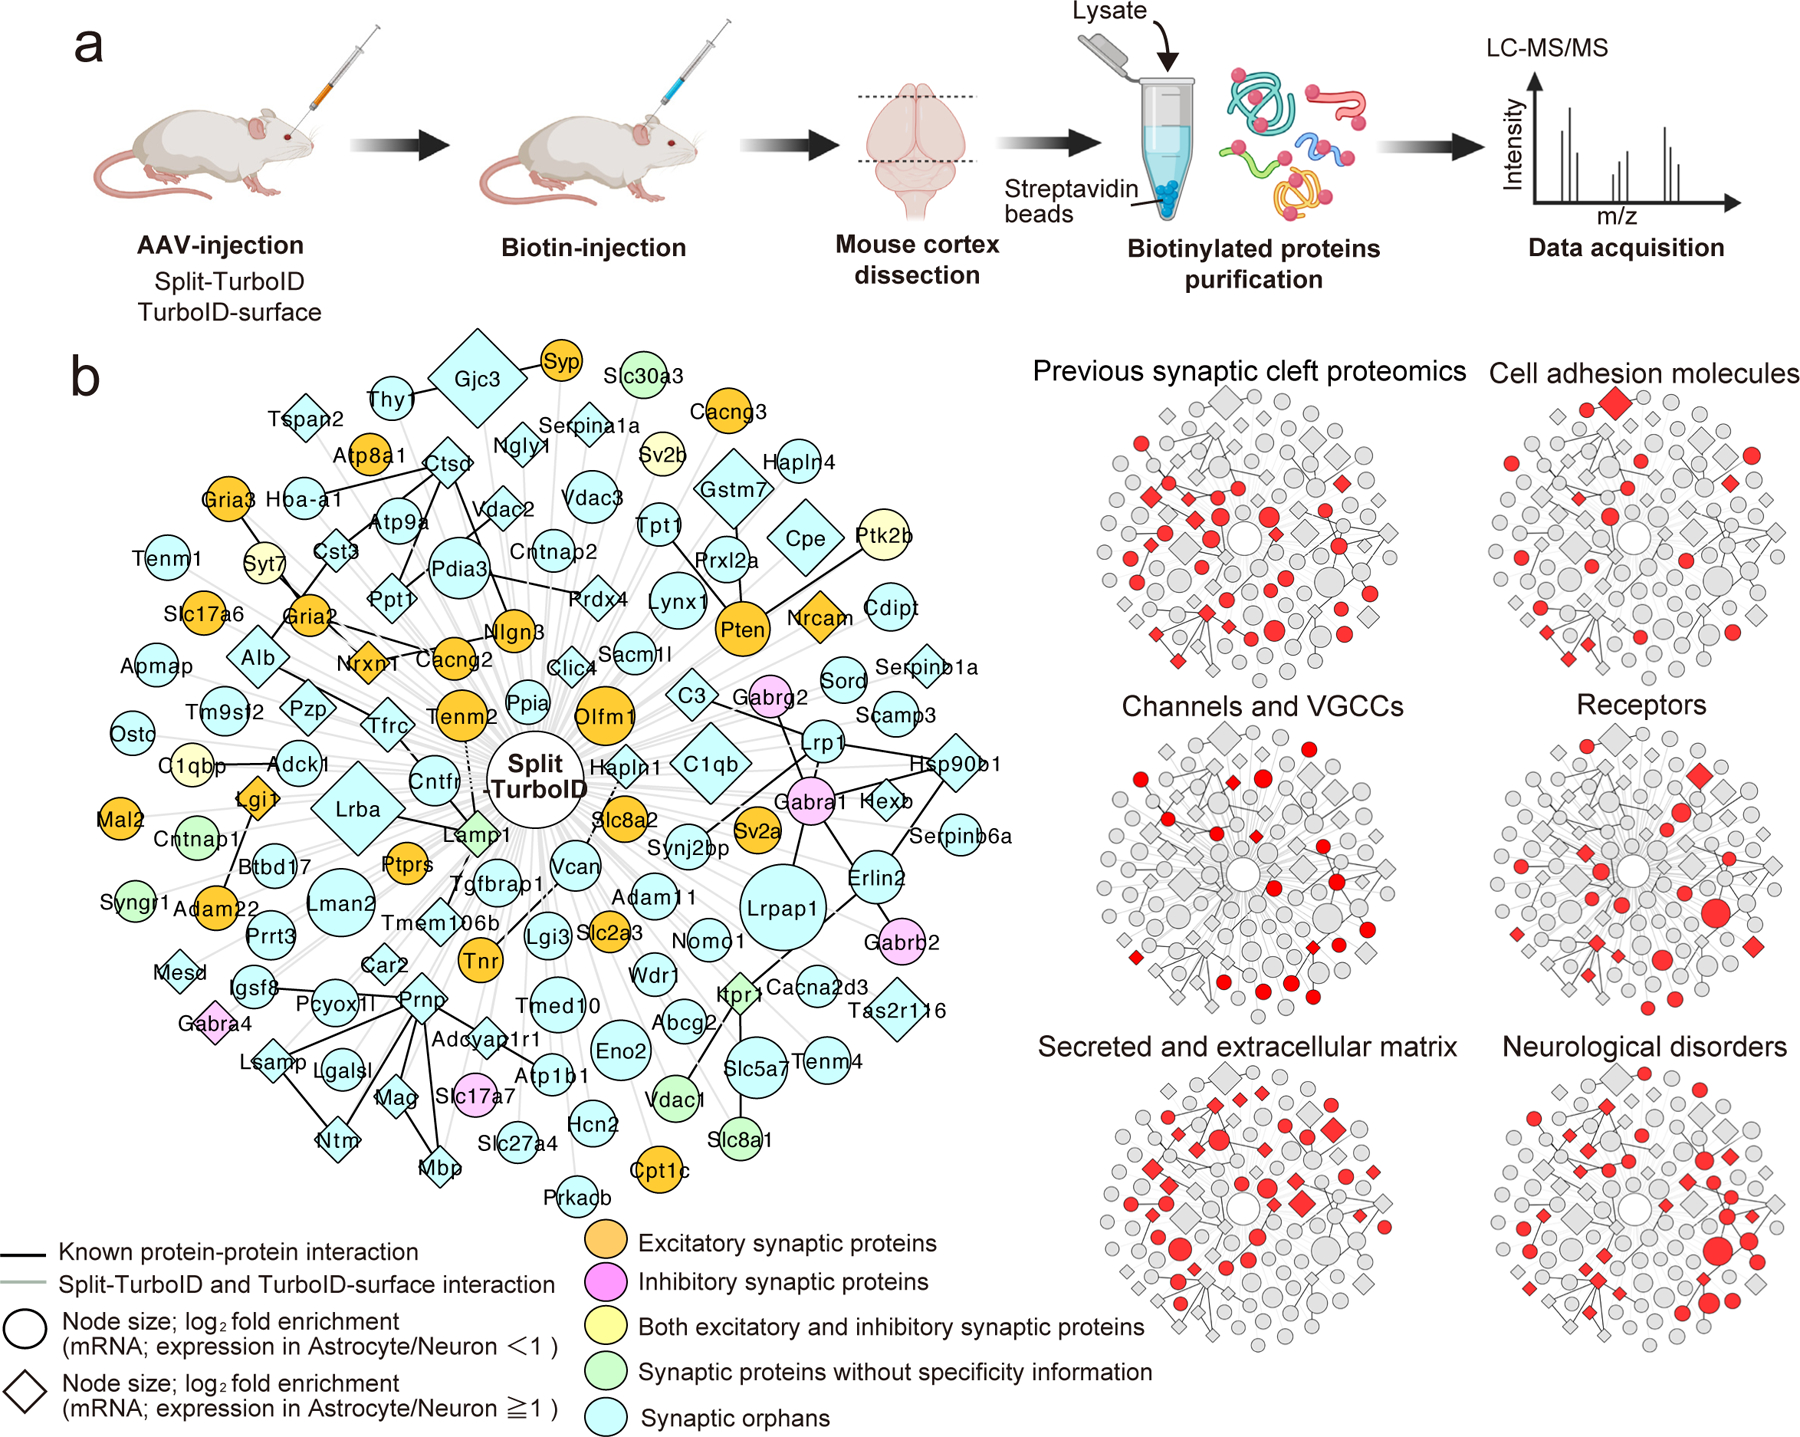
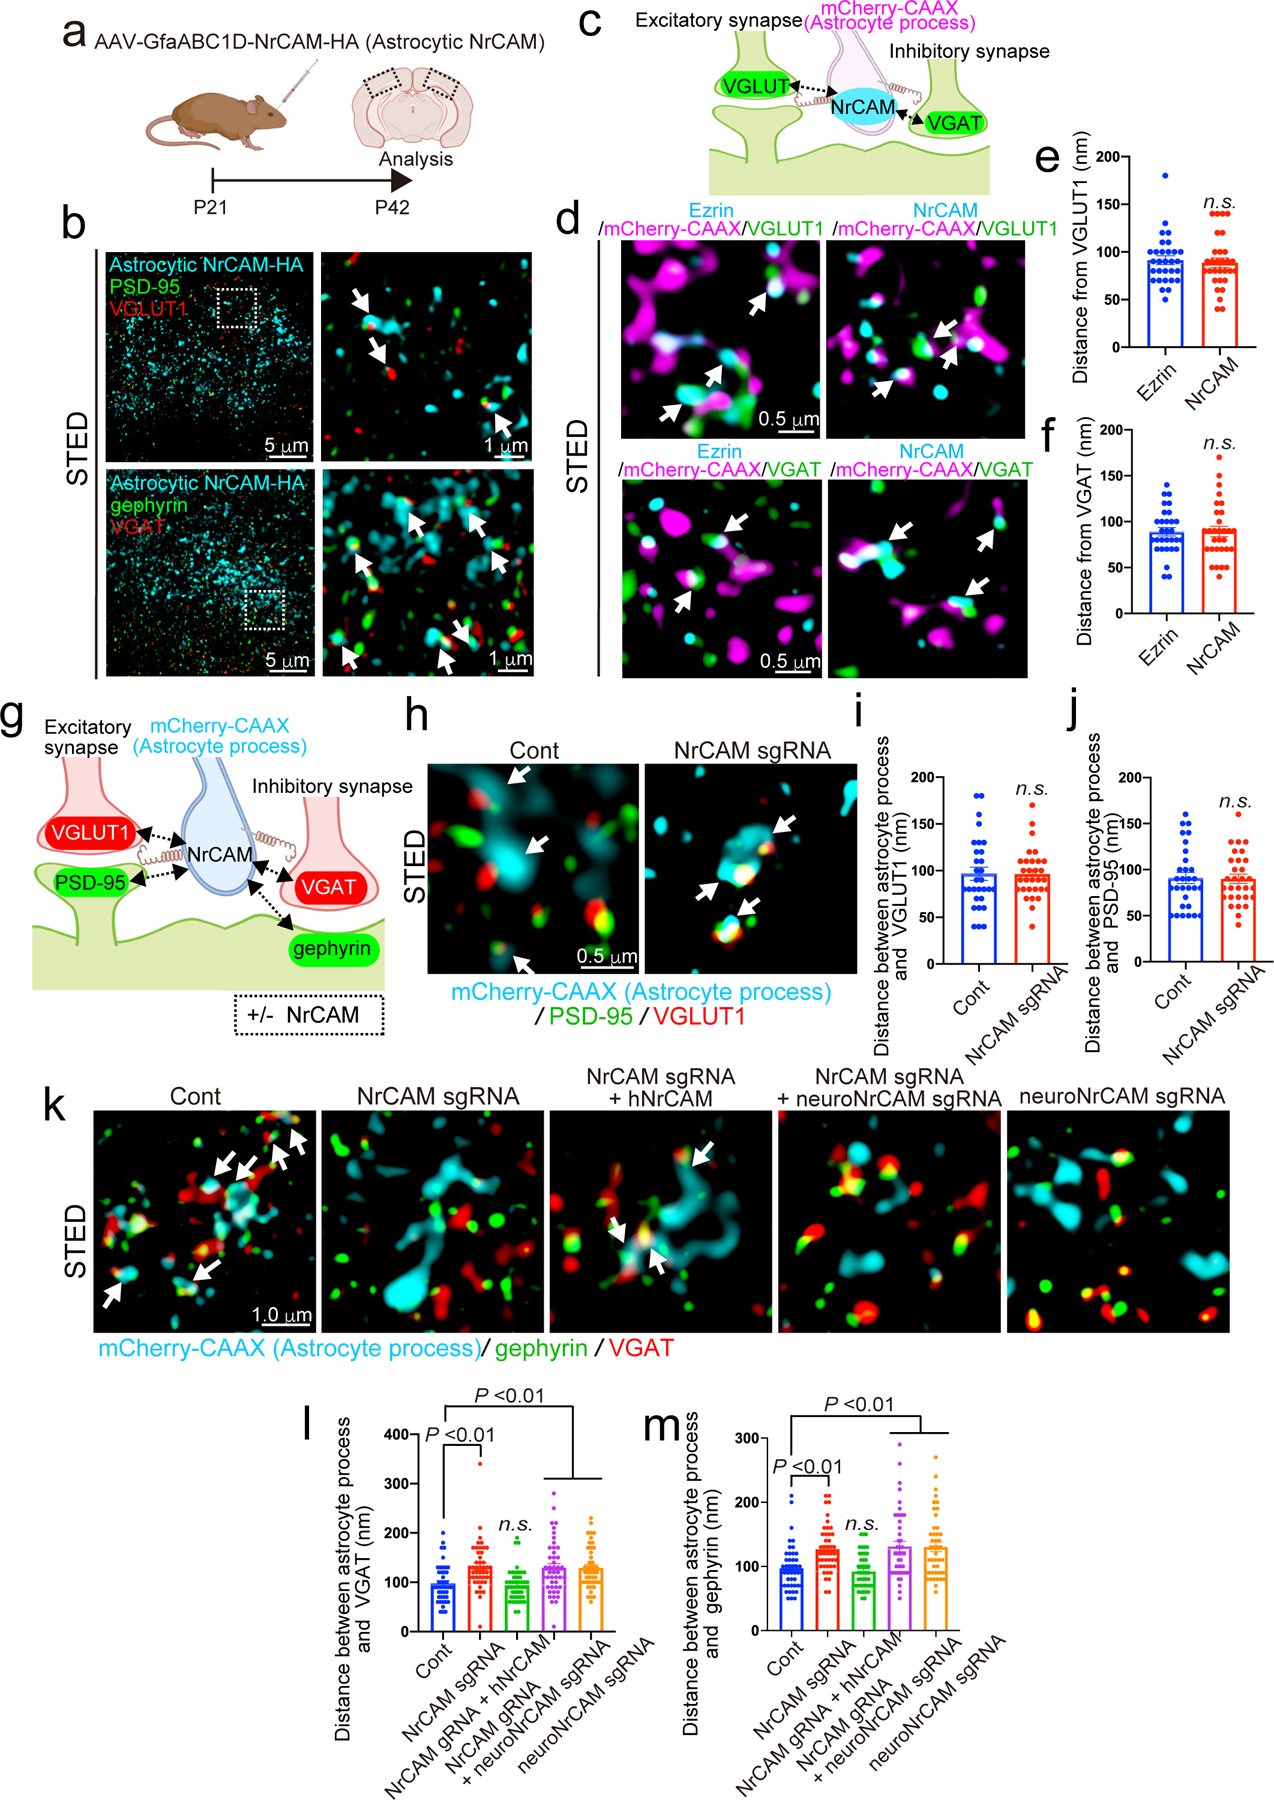
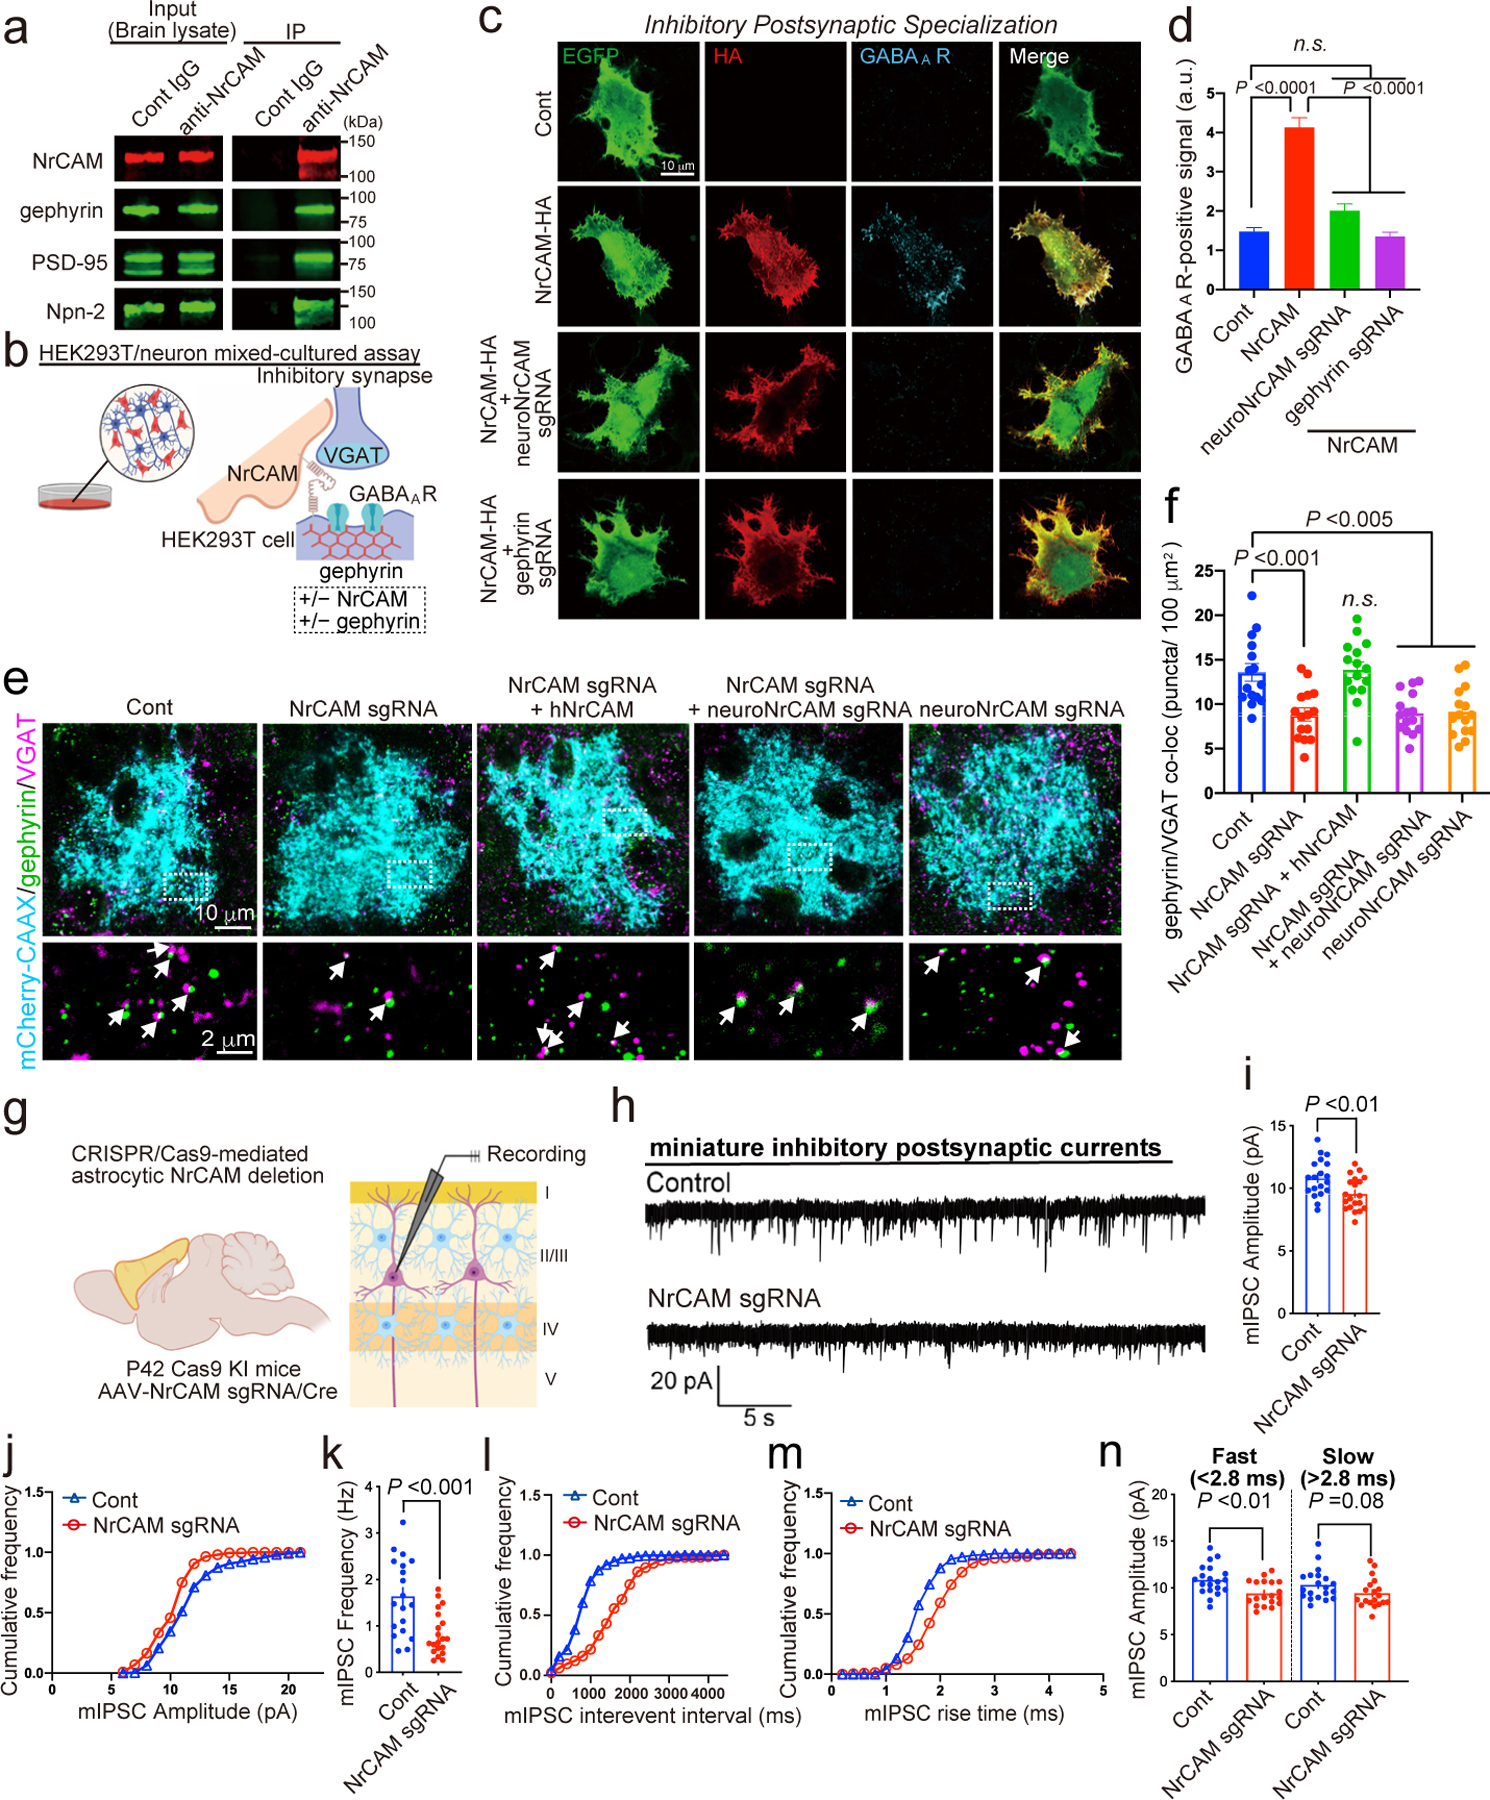
Perisynaptic astrocytic processes are an integral part of central nervous system synapses1,2; however, the molecular mechanisms that govern astrocyte-synapse adhesions and how astrocyte contacts control synapse formation and function are largely unknown. Here we use an in vivo chemico-genetic approach that applies a cell-surface fragment complementation strategy, Split-TurboID, and identify a proteome that is enriched at astrocyte-neuron junctions in vivo, which includes neuronal cell adhesion molecule (NRCAM). We find that NRCAM is expressed in cortical astrocytes, localizes to perisynaptic contacts and is required to restrict neuropil infiltration by astrocytic processes. Furthermore, we show that astrocytic NRCAM interacts transcellularly with neuronal NRCAM coupled to gephyrin at inhibitory postsynapses. Depletion of astrocytic NRCAM reduces numbers of inhibitory synapses without altering glutamatergic synaptic density. Moreover, loss of astrocytic NRCAM markedly decreases inhibitory synaptic function, with minor effects on excitation. Thus, our results present a proteomic framework for how astrocytes interface with neurons and reveal how astrocytes control GABAergic synapse formation and function.


Conflict of interest statement

Competing financial interests

The authors declare no competing financial interests.

Figures

Extended Data Figure 1
Extended Data Figure 1. The reconstituted activity of Split-TurboID in neurons and astrocytes in vitro.
a, Schematics of constructs tested. b, Immunoblot analysis of construct expression and biotinylation activity. c, Schematic of neuron-astrocyte mixed-culture assay for Split-TurboID with cell-type specific AAVs in vitro. d, Cultured neurons and astrocytes were infected with AAV1/2-GfaABC1D-TurboID-HA-surface, AAV1/2-hSynI-V5-N-TurboID and/or AAV1/2-GfaABC1D-C-TurboID-HA at DIV14. Representative images of neuron and astrocyte at DIV14 after the treatment of 500 μM biotin for 6h are shown. n= 3 biological repeats.
Extended Data Figure 2
Extended Data Figure 2. Split-TurboID maps excitatory and inhibitory perisynaptic proteins.
a-d, Representative images demonstrating that proteins biotinylated by astrocytic TurboID-surface or Split-TurboID (cyan) are adjacent to a) excitatory presynaptic marker VGLUT1, b) postsynaptic marker Homer 1, c) inhibitory presynaptic marker VGAT, and d) postsynaptic marker gephyrin. Astrocytes were visualized with GfaABC1D-mCherry-CAAX. n= 3 biological repeats.
Extended Data Figure 3
Extended Data Figure 3. Brain-wide transduction of astrocytes and neurons.
a, Schematic of AAV PHP.eB viruses for neuronal-EGFP or astrocyte-mCherry-CAAX and retro-orbital injection. b, Sagittal section of mouse brain showing expression throughout the cortex and other structures. c, Representative image from cortex, hippocampus or cerebellum showing high coverage of neuronal and astrocytic expression.
Extended Data Figure 4
Extended Data Figure 4. Mapping and identification of tripartite synaptic cleft proteins by Split-TurboID in vivo.
a, Biotinylation activity of Split-TurboID in vivo. Lysates of mouse brain infected with cell-type specific TurboID-surface-HA, V5-N-TurboID and/or C-TurboID-HA. Brain lysates were analyzed by immunoblotting with anti-Streptavidin, anti-V5, anti-HA and anti-Tubulin antibodies. b, The graph indicates the ratio of botinylation activity in vivo (n= 4 brains per each condition). c-d, The biotinylation of Split-TurboID in mouse cortex. e-f, Quantification of average number of excitatory or inhibitory synaptic co-localized puncta in layer 2/3 of the visual cortex. n= 15 slices per each condition from 3 mice. g, Chart summarizing proteomic dataset identified by mass spectrometry and filters used to identify top candidates. h, Venn diagram comparing proteome list of Split-TurboID and TurboID-surface. i, Scale-free network of Split-TurboID (green) and TurboID-surface (blue) identified proteins. High-confidence proteins enriched in both Split-TurboID and TurboID-surface fractions are shown in red. Neuronal enriched proteins (RNAseq expression ratio<1) and astrocyte enriched proteins (RNAseq expression ratio≧1.0) are represented as circle or diamond, respectively. At least n= 4 biological repeats. One-way ANOVA (Dunnett’s multiple comparison, p<0.0001, 0.001). Data are means ± s.e.m.
Extended Data Figure 5
Extended Data Figure 5. The validation of candidate proteins with CRISPR-based astrocytic candidate gene depletion strategy.
a, Schematic of CRISPR-based deletion of astrocytic NrCAM in vitro. b, Immunoblots showing loss of NrCAM with sgRNA. AAV1/2-U6-empty sgRNA or AAV1/2-U6-NrCAM sgRNA was co-infected with AAV1/2- GfaABC1D-Cas9 to cultured neurons and astrocytes at DIV14. The cells were subjected to immunoblot analysis with an anti-NrCAM antibody. Tubulin was used as a loading control. c, The bar graph indicates the expression level of NrCAM from 3 independent experiments. d, Schematic of CRISPR-based deletion strategy of candidate gene. e, Experimental timeline of AAV-mediated CRISPR-based astrocytic gene deletion strategy in Flex-TdTomato mice. f, AAV PHP.eB-U6-NrCAM sgRNA was co-infected with AAV PHP.eB-GfaABC1D-Cas9 in Flex-TdTomato mice at P21. Coronal sections were prepared and immunostained with an anti-TdTomato antibody. g, A High-magnification image is shown. h, Images of Tenm2-, Tenm4- or NrCAM-deleted astrocytes (cyan) and their territories (red outlines) in visual cortexes of juvenile mice. i, Average territory volumes at P42 of Tenm2-, Tenm4- or NrCAM-deleted astrocytes. Between 20–25 cells per condition from 3 mice. j, Images of Tenm2-, Tenm4- or NrCAM-deleted astrocytes (cyan) and their NIV reconstructions (orange) in visual cortexes of juvenile mice. k, Average NIV at P42 of Tenm2-, Tenm4- or NrCAM-deleted astrocytes. 51 cells per each condition from 3 mice. n= 3 biological repeats. One-way ANOVA (Dunnett’s multiple comparison, p<0.0001, 0.01). Data are means ± s.e.m.
Extended Data Figure 6
Extended Data Figure 6. NrCAM is a novel tripartite synaptic protein.
a, A high magnification STED image showing that endogenous NrCAM was enriched at biotinylated proteins in vivo. b, Immunoblot analysis of endogenous NrCAM, astrocyte marker GFAP, neuronal marker b-Tubulin III or loading control α-Tubulin from mouse brain or purified astrocyte lysate. c, Schematic of the visualization of astrocytic membrane and endogenous NrCAM in vivo. d, STED images demonstrating the localization of endogenous NrCAM in vivo. Coronal sections were immunostained with anti-NrCAM antibody (cyan). High magnification image was shown (right panel). e, Schematic of the visualization of both astrocytic and neuronal NrCAM in vivo. f, STED images demonstrating that the colocalization of astrocytic NrCAM with neuronal NrCAM in vivo. Coronal sections were prepared and co-immunostained with an anti-V5 (cyan) and anti-HA (magenta) antibody. A high-magnification image is shown in the right. n= 3 biological repeats. Data represent means ± s.e.m.
Extended Data Figure 7
Extended Data Figure 7. The role of astrocytic NrCAM in astrocytic morphogenesis in vivo.
a, Schematic of CRISPR-based NrCAM deletion in vivo. b, Schematic of hNrCAM domains and fragments. SP, signal peptide; IG, immunoglobulin; FN, fibronectin; TMD, transmembrane domain; ECD, extracellular domains. c, Immunoblots showing the expression of each NrCAM fragments in HEK293T cells. d, f, h, j: Images of astrocytes following deletion of astrocyte NrCAM alone (NrCAM sgRNA), with co-expression with indicated constructs of sgRNA-resistant human NrCAM, neuronal NrCAM deletion (neuroNrCAM sgRNA), or following neuronal NrCAM deletion alone. Images at indicated ages represent. e and i; Analysis of astrocyte territory, 15 – 29 cells per each condition from 3 mice; g and k; Analysis of neuropil infiltration volume. 50 – 51 cells per each condition from 3 mice. n= 3 biological repeats. One-way ANOVA (Dunnett’s multiple comparison, p<0.0001). Data represent means ± s.e.m.
Extended Data Figure 8
Extended Data Figure 8. NrCAM controls inhibitory synaptic specializations through binding the gephyrin.
a, Immunoblot analysis of endogenous NrCAM, astrocyte marker GFAP, Neuroligin 2, Neuroligin 3, Kir4.1 or EAAT2 (GLT1) from purified astrocyte lysate. b, The bar graph indicates the expression level. c, The interaction of NrCAM with PSD95 and gephyrin in HEK293T cells. Cell lysates co-expressing NrCAM-HA with GFP, PSD95-GFP or GFP-gephyrin were incubated with anti-GFP-bound beads. Immunoprecipitated (right) or total (left) NrCAM, GFP, PSD95-GFP or GFP-gephyrin were detected by immunoblotting with anti-HA and anti-GFP antibodies. d, Schematic of HEK293T/neuronal mixed-cultured assay in vitro. e-h, Images of in vitro inhibitory synapse formation assays. The graph shows average of the total integrated intensity of VGAT (Cont= 258, NL2= 222, NrCAM= 242, NrCAM-ΔIG= 288, NrCAM-ΔECD= 303 cells) or GABAA receptor (Cont= 313, NRX1β4(−)= 310, NrCAM= 300, NrCAM-ΔIG= 278, NrCAM-ΔECD= 278 cells) clusters that contact transfected HEK293T cells. i-l, Images of in vitro excitatory synapse formation assay. The graph shows average of the total integrated intensity of VGLUT1 (Cont= 259, NL2= 306, NrCAM= 286, NrCAM-ΔIG= 321, NrCAM-ΔECD= 196 cells) or Homer1 (Cont= 471, NRX1β4(−)= 214, NrCAM= 247, NrCAM-ΔIG= 387, NrCAM-ΔECD= 251 cells) clusters that contact transfected HEK293T cells. n= 3 biological repeats. One-way ANOVA (Dunnett’s multiple comparison, p<0.0001). Data are means ± s.e.m.
Extended Data Figure 9
Extended Data Figure 9. The effect of NrCAM on excitatory synapse formation and function in vivo.
a, Images of postsynapse PSD-95 and presynapse VGLUT1 within NrCAM-deletion astrocytes in L1 of the visual cortex. High magnification images (bottom) correspond to boxes (above). b, Quantification of average number of excitatory synaptic co-localized puncta within astrocyte territories. n= 15 cells per each condition from 3 mice. c, mEPSC traces from L2/3 pyramidal neurons following astrocyte control empty sgRNA or NrCAM sgRNA expression. d-g, Quantification of mEPSC amplitude (d-e; Cont= 16, NrCAM sgRNA= 14 cells from 4 mice) and frequency (f-g; Cont= 14, NrCAM sgRNA= 17 cells from each of 4 mice). At least n= 3 biological repeats. Student’s t-test (paired, p<0.05). Data represent means ± s.e.m.
Extended Data Figure 10
Extended Data Figure 10. In vivo chemogenetics method, Split-TurboID, reveals a novel astrocytic cell adhesion molecule, NrCAM, that controls inhibitory synaptic organization.
Development of in vivo chemo-affinity codes, Split-TurboID, and a working model of astrocytic NrCAM influencing inhibitory synaptic function. Split-TurboID can map the molecular composition of such intercellular contacts, even within the highly complex structure of the tripartite synapse in vivo. Mapping this interface, we discovered a new molecular mechanism by which astrocytes influence inhibitory synapses within the tripartite synaptic cleft via NrCAM. NrCAM is expressed in cortical astrocytes where it interacts with neuronal NrCAM that is coupled to gephyrin at inhibitory postsynapses. Loss of astrocytic NrCAM dramatically alters inhibitory synaptic organization and function in vivo.
Figure 1
Figure 1. Astrocyte-neuron synaptic cleft proteome using in vivo Split-TurboID.
a, Schematic of the Split-surface iBioID approach. b, Outline of Split-TurboID method using cell-type specific AAVs. c, Confocal images of cortical expression of Split-TurboID or TurboID-surface co-expressed with neuronal-EGFP and astrocyte-mCherry-CAAX. d and e, Three-color STED images showing biotinylated proteins adjacent to d) excitatory synaptic markers PSD-95 and VGLUT1, and e) inhibitory synaptic markers gephyrin and VGAT. f, The ratio of biotinylated proteins that was co-localized with VGLUT1, PSD-95, VGAT or gephyrin. n= 15 cells per each condition from 3 mice. n= 3 biological repeats. Student’s t-test (paired, p<0.001, 0.05). Data represent means ± s.e.m.
Figure 2
Figure 2. Astrocyte-neuron synaptic cleft proteome.
a, Outline of proteomic approach. b, Left, Overlapping high-confidence proteins shared between the Split-TurboID and TurboID-surface enriched fractions. Right, Clustergram topology of proteins in selected functional categories. Note: node titles are gene name; size represents fold-enrichment over negative control. Neuronal enriched proteins (RNAseq expression ratio<1) and astrocyte enriched proteins (RNAseq expression ratio≧1.0) are represented as circle or diamond, respectively. Edges are shaded according to types of interactions (gray, iBioIDs; black, protein-protein interactions previously reported).
Figure 3
Figure 3. NrCAM controls astrocyte-neuron contacts in vivo.
a, Schematic of the visualization of astrocytic NrCAM in vivo. b, Three-color STED images demonstrating that astrocytic NrCAM are adjacent to excitatory synapses or inhibitory synapses. c, Schematic of astrocytic NrCAM distribution assay in vivo. d, Three-color STED images showing mCherry-CAAX-positive NrCAM or Ezrin adjacent to excitatory presynapses and inhibitory presynapses. e and f) Quantification of average distance between astrocytic NrCAM and VGLUT1 or VGAT (n= 30 puncta per each condition from 3 brains). g, Schematic of astrocytic process and neuronal synapses contact assay in vivo. h-m, Three-color STED images of astrocytic process following deletion of astrocyte NrCAM adjacent to excitatory synapses (h) or inhibitory synapses (k). i-j and l-m, Quantification of average distance between astrocytic process and excitatory synapses (i-j) or inhibitory synapses (l-m) (n= 30 puncta per each condition from 3 brains). n= 3 biological repeats. Student’s t-test (paired, p<0.001) (e, f, i, j). One-way ANOVA (Dunnett’s multiple comparison, p<0.01) (l, m). Data represent means ± s.e.m.
Figure 4
Figure 4. Astrocytic NrCAM controls inhibitory synaptic organization and function.
a, Co-immunoprecipitation from cortical lysates of NrCAM with gephyrin, PSD-95 and Npn-2. b, Schematic of co-culture assay of mechanisms of non-neuronal NrCAM-HA on inhibitory synaptic specializations. c, Images of NrCAM-HA co-expressed with EGFP in HEK293T cells co-cultured with NrCAM or gephyrin-depleted neurons. d, Graphs of average total integrated intensity of GABAA receptor contacting transfected HEK293T cells (Cont = 418, NrCAM = 416, neuroNrCAM sgRNA + NrCAM= 297, Gephyrin sgRNA + NrCAM = 356 cells). e, Images of inhibitory synapses within NrCAM-deletion astrocytes. High magnification images (bottom) correspond to boxes (above). f, Quantification of average number of inhibitory synaptic co-localized puncta within astrocyte territories. n= 15 cells per each condition from 3 mice. g, Schematic of electrophysiology in L2/3 of pyramidal neurons of V1 cortex. h, mIPSC traces from L2/3 pyramidal neurons following astrocyte control empty sgRNA or NrCAM sgRNA expression. i-m, Quantification of mIPSC amplitude (i-j), frequency (k-l), and rise time (m) (n=20 cells per each condition from 4 mice). n, mIPSC amplitudes sorted by fast and slow rise times. One-way ANOVA (Dunnett’s multiple comparison, p<0.001, 0.005) (d, f). n= 3–6 biological repeats. Student’s t-test (paired, p<0.001, 0.01) (i, k, n). Data represent means ± s.e.m.

References

    1. Yu X, Nagai J & Khakh BS Improved tools to study astrocytes. Nature reviews. Neuroscience 21, 121–138, 10.1038/s41583-020-0264-8 (2020). - DOI - PubMed
    1. Lanjakornsiripan D et al. Layer-specific morphological and molecular differences in neocortical astrocytes and their dependence on neuronal layers. Nature communications 9, 1623, 10.1038/s41467-018-03940-3 (2018). - DOI - PMC - PubMed
    1. Araque A, Parpura V, Sanzgiri RP & Haydon PG Tripartite synapses: glia, the unacknowledged partner. Trends in neurosciences 22, 208–215, 10.1016/s0166-2236(98)01349-6 (1999). - DOI - PubMed
    1. Khakh BS & Sofroniew MV Diversity of astrocyte functions and phenotypes in neural circuits. Nature neuroscience 18, 942–952, 10.1038/nn.4043 (2015). - DOI - PMC - PubMed
    1. Ma Z, Stork T, Bergles DE & Freeman MR Neuromodulators signal through astrocytes to alter neural circuit activity and behaviour. Nature 539, 428–432, 10.1038/nature20145 (2016). - DOI - PMC - PubMed

Publication types

MeSH terms