. 2020 Oct 16:11:548737.
doi: 10.3389/fmicb.2020.548737. eCollection 2020.

Cryptosporidium parvum Infection Depletes Butyrate Producer Bacteria in Goat Kid Microbiome

Affiliations

Cryptosporidium parvum Infection Depletes Butyrate Producer Bacteria in Goat Kid Microbiome

Mohamed Mammeri et al. Front Microbiol. .

Abstract

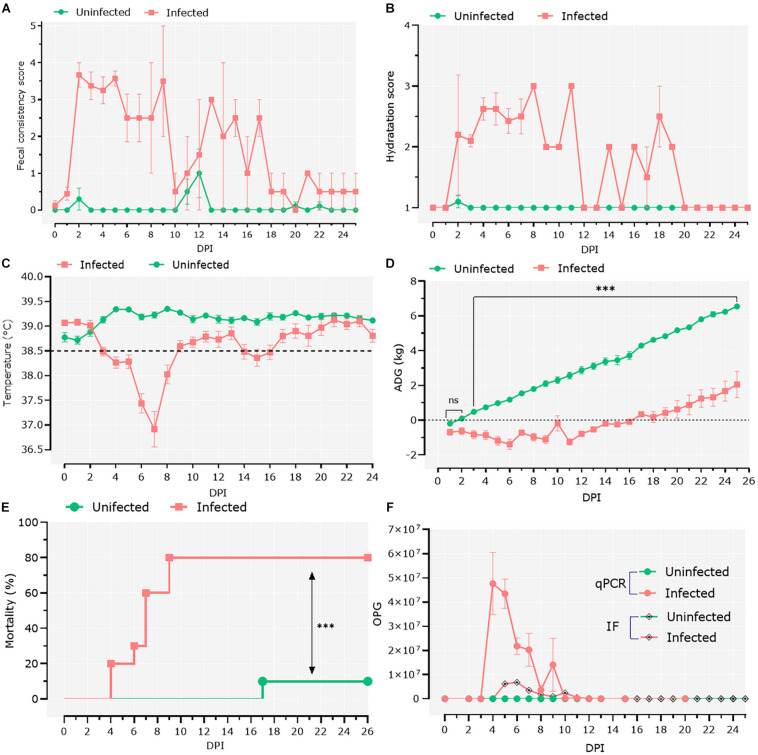
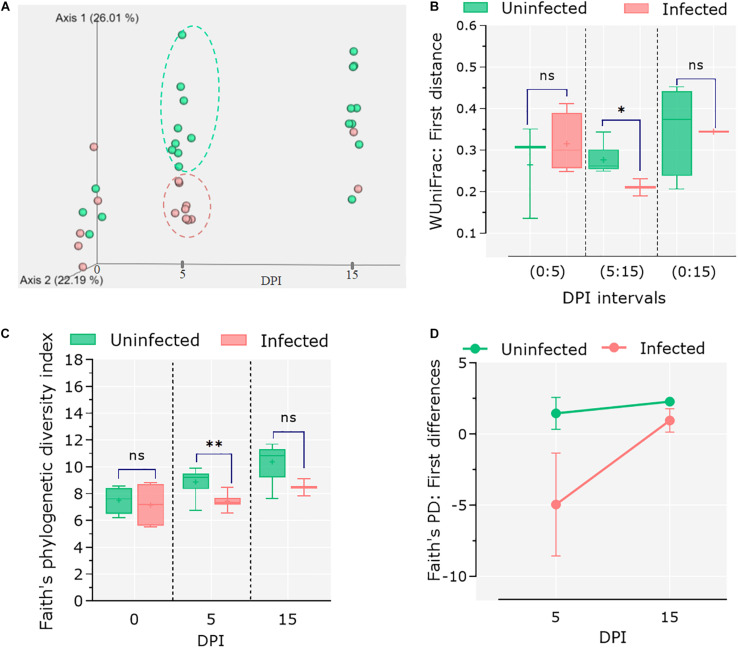
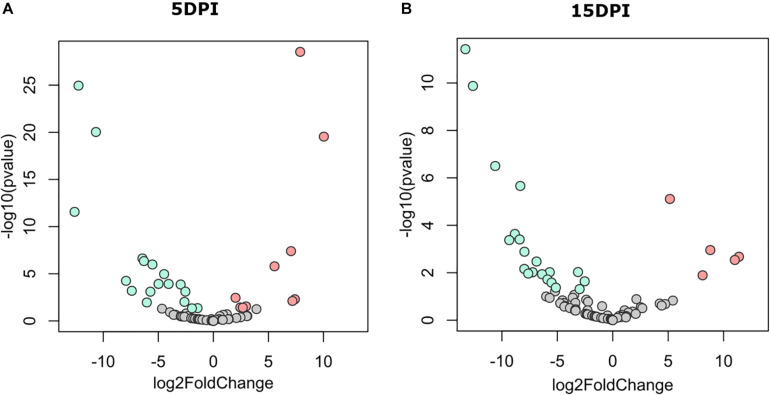
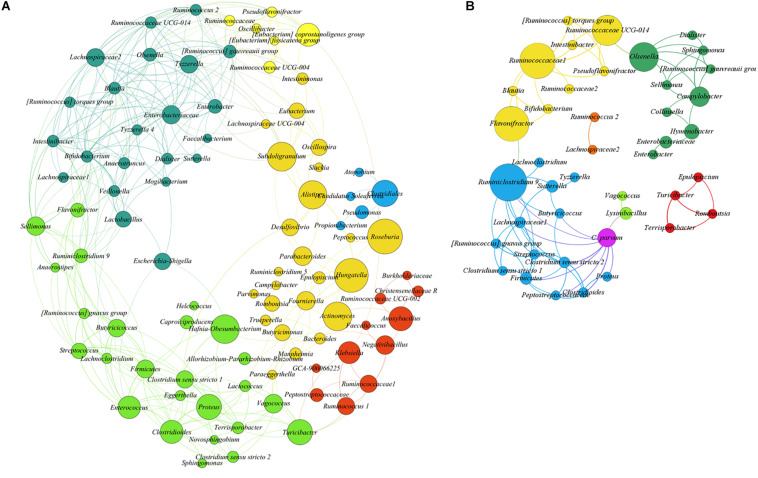
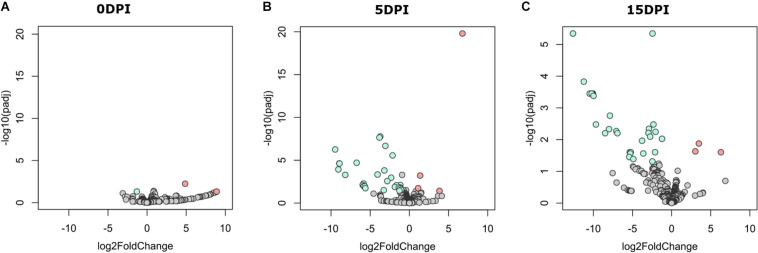
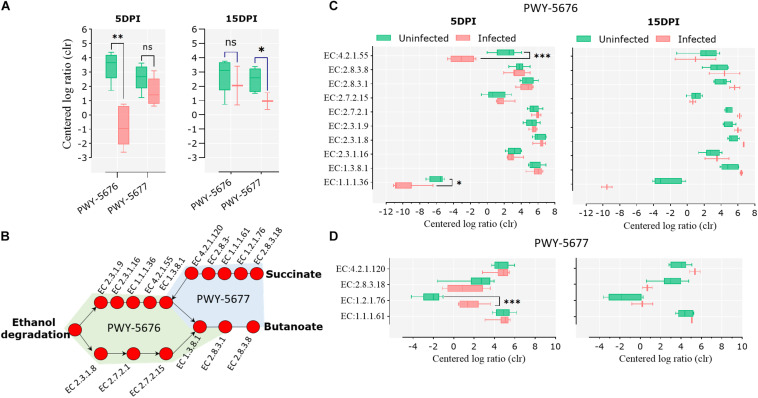
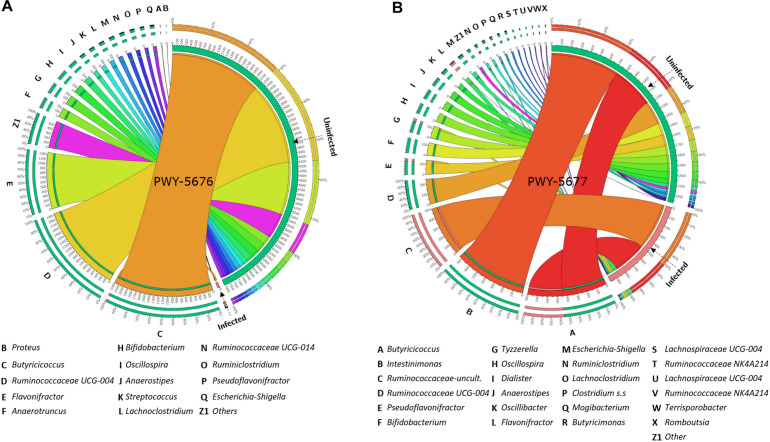
Cryptosporidium parvum is an important apicomplexan parasite infecting ruminants and humans. We characterized the impact of C. parvum infection on the goat kid microbiome. C. parvum was orally administered to parasite-naïve goats, and infection was monitored for 26 days in fecal samples using immunofluorescence assay and qPCR tests. Age-matched goats served as uninfected controls. A reduction in body weight gain, diarrhea, and dehydration were observed in infected goats compared to the uninfected controls. Infection decreased the bacterial diversity 5 days post-infection (dpi), but this parameter recovered at 15 dpi. The infection altered the relative abundance of several taxa. A total of 38 taxa displayed significant differences in abundance between control and infected goats at both 5 and 15 dpi. Co-occurrence network analysis revealed that the infection resulted in a differential pattern of taxa interactions and that C. parvum infection increased the relative abundance of specific taxa. The 16S data set was used for metagenome predictions using the software package PICRUSt2. As many as 34 and 40 MetaCyc pathways (from 387 total) were significantly affected by the infection at 5 and 15 dpi, respectively. Notably, C. parvum decreased the abundance of butyrate-producing pathways in bacteria. Low levels of butyrate may increase mucosal inflammation and tissue repair. Our results suggest that the gut inflammation induced by C. parvum infection is associated with the reduction of butyrate-producing bacteria. This insight could be the basis for the development of novel control strategies to improve animal health.

Keywords: 16S; diarrhea; dysbiosis; functional traits; gut microbiome; resilience 3.


Figures

FIGURE 1
FIGURE 1
Clinical follow-up of animals. (A) Daily average fecal consistency score. The fecal consistency score was recorded from 0 to 4 as either: normal saddle, without mucus (0), pasty and thick, molded or not, glairy (1), creamy (2), semi-fluid (3), and liquid (4). (B) Daily average dehydration scores were recorded as normal (1), mildly dehydrated (2), and severely dehydrated (3). (C) Daily average central temperature. The orange line indicates the limit from which we consider animals in hypothermia. (D) Average daily weight gain (ADG). Data of ADG were explored using general linear mixed-effects model, including infection, time, and their interaction as fixed effects. The significant effect of the time–infection interaction is indicated (ns, non-significant; ∗∗∗p < 0.001). (E) Mortality rates were compared using Mantel–Cox χ2-based test; ∗∗∗P < 0.001. (F) Parasitic load was detected by direct immunofluorescence assay and quantitative PCR. The parasitic load was expressed as the mean of oocysts per gram of feces ± standard deviation.
FIGURE 2
FIGURE 2
Differential microbial diversity in goat kid microbiota due to Cryptosporidium parvum infection. (A) Principal coordinate analysis (PCoA) of weighted UniFrac distances. We chose to represent the duration of infection on the third principal axis (0, 5, and 15 dpi). Each dot represents an individual microbiome (green = uninfected, red = infected); ellipsoids were arbitrarily drawn to highlight the difference between groups at 5 dpi. (B) Pairwise weighted UniFrac distance (degree of dissimilarity between an individual’s microbiota structure at two separate time points) indicates the distance (dissimilarity) between paired samples from uninfected and infected animals in relation to infection time (dpi). We tested whether these differences were significant at three time intervals (dpi): 0–5, 5–15, and 0–15. (C) Comparison of alpha diversity between uninfected and infected goat kids as measured by the “Faith” phylogenetic index (species richness) at genus level at 0, 5, and 15 dpi. (D) Pairwise difference comparisons addressing the changes in Faith phylogenetic index between paired samples in relation to infection time (i.e., species richness in each individual at 5 dpi in relation to itself at 0 dpi and microbiota differences as compared between infected and uninfected animals). Error bars represent standard deviation. Statistical significance was determined by Kruskal–Wallis test (n.s., P < 0.05, ∗∗P < 0.01, ∗∗∗P < 0.001).
FIGURE 3
FIGURE 3
Differential abundant taxa between fecal microbiota of goat kids, from groups uninfected and infected with Cryptosporidium parvum. Volcano plot showing differential abundant taxa (green = uninfected, red = infected, gray = non-significant) identified by DESeq2 analysis. Taxa and ranked by log fold-change and the negative log-10 transform of the nominal P-value (P < 0.05). Comparisons were performed at (A) 5 dpi and (B) 15 dpi. Detailed information on taxa identity and differentiation is presented in Supplementary Table 1.
FIGURE 4
FIGURE 4
SparCC correlation networks observed between taxa, obtained from bacterial and archaeal 16S rRNA gene sequences. Nodes correspond to taxa at the genus level, and connecting edges indicate positive correlations larger than 0.50 (only nodes with at least one significant correlation are represented). (A) Co-occurrence network using all samples from uninfected goat kids. (B) Co-occurrence network using all samples from the infected animals, including Cryptosporidium parvum infection levels as a node (oocysts per gram of feces quantified by qPCR). Node colors are random, but those with the same color indicate taxa modules (communities) that co-occur more frequently than with other taxa. The circle size is proportional to the betweenness centrality of each taxon in the resulting network.
FIGURE 5
FIGURE 5
Differential functional profile of goat kid microbiome from uninfected and Cryptosporidium parvum-infected goats. Volcano plot showing differential abundant pathways between infected and uninfected animals detected by DESeq2 analysis at (A) 0 dpi, (B) 5 dpi, and (C) 15 dpi. The green and the red dots indicate pathways that display both large-magnitude log fold-changes and negative log-10 transform of the adjusted P-value (Benjamini–Hochberg false discovery rate method); the gray dots are not significant (Padj < 0.05). Detailed information on pathway identity and differentiation is presented in Supplementary Table 3.
FIGURE 6
FIGURE 6
Short-chain fatty acid (SCFA) biosynthesis pathways in goat kid gut microbiomes affected by Cryptosporidium parvum infection. (A) Differential abundance of the SCFA pathways PWY-5676 (fermentation of acetyl-CoA to butanoate II) and PWY-5677 (fermentation of succinate to butanoate) between uninfected and infected animals at different infection time points (dpi). (B) SCFA pathway reconstruction using MetaCyc pathway maps, indicating all and Kyoto Encyclopedia of Genes and Genomes (KEGG) enzymes involved in such pathways. Differential abundance of KEGG enzymes from the pathways PWY-5676 (C) and PWY-5677 (D) at 5 and 15 dpi between uninfected and infected goat kids. Statistical significance was determined by Kruskal–Wallis test (P < 0.05, ∗∗P < 0.01, ∗∗∗P < 0.001).
FIGURE 7
FIGURE 7
Taxa (16S) contribution to short-chain fatty acid (SCFA) biosynthesis pathways (PICRUSt2-predicted EC metagenome) affected by Cryptosporidium parvum infection in goat kid microbiomes. Chord diagrams showing the inter-relationships between taxa and SCFA pathways and these relationships compared between uninfected and infected goat kids for (A) PWY-5676 (fermentation of acetyl-CoA to butanoate II) at 5 dpi and (B) PWY-5677 (fermentation succinate to butanoate) at 15 dpi. Node segments along a circle represent taxa or the analyzed pathways in each group (infected and uninfected). The node size indicates the abundance (feature count) of contributing taxa and pathways. Arcs indicate the connections between pathways and taxa, which are represented proportionally by the size of each arc.

Similar articles

Cited by

References

    1. Afrin T., Murase K., Kounosu A., Hunt V. L., Bligh M., Maeda Y., et al. (2019). Sequential changes in the host gut microbiota during infection with the intestinal parasitic nematode Strongyloides venezuelensis. Front. Cell. Infect. Microbiol. 9:217. 10.3389/fcimb.2019.00217 - DOI - PMC - PubMed
    1. Ahamed I., Yadav A., Katoch R., Godara R., Saleem T., Nisar N. A. (2015). Prevalence and analysis of associated risk factors for Cryptosporidium infection in lambs in Jammu district. J. Parasit. Dis. 39 414–417. 10.1007/s12639-013-0353-y - DOI - PMC - PubMed
    1. Angebault C., Ghozlane A., Volant S., Botterel F., D’Enfert C., Bougnoux M. E. (2018). Combined bacterial and fungal intestinal microbiota analyses: impact of storage conditions and DNA extraction protocols. PLoS One 13:e0201174. 10.1371/journal.pone.0201174 - DOI - PMC - PubMed
    1. Bastian M., Jacomy M. (2009). “Gephi: an open source software for exploring and manipulating networks gephi: an open source software for exploring and manipulating networks,” in Proceedings of the Third International Conference on Weblogs and Social Media, ICWSM 2009, (San Jose, CA: ), 4–6. 10.13140/2.1.1341.1520 - DOI
    1. Benjamini Y., Hochberg Y. (1995). Controlling the false discovery rate: a practical and powerful approach to multiple testing. J. R. Stat. Soc. Ser. B 57 289–300. 10.1111/j.2517-6161.1995.tb02031.x - DOI