. 2020 Oct 15:11:595902.
doi: 10.3389/fmicb.2020.595902. eCollection 2020.

Molecular Pap Smear: Validation of HPV Genotype and Host Methylation Profiles of ADCY8, CDH8, and ZNF582 as a Predictor of Cervical Cytopathology

Affiliations

Molecular Pap Smear: Validation of HPV Genotype and Host Methylation Profiles of ADCY8, CDH8, and ZNF582 as a Predictor of Cervical Cytopathology

Jane Shen-Gunther et al. Front Microbiol. .

Abstract

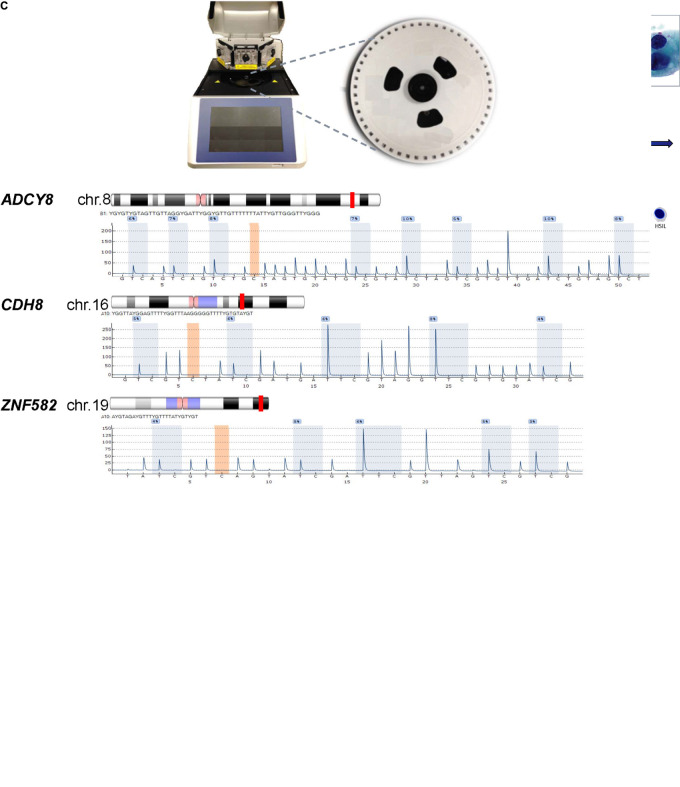
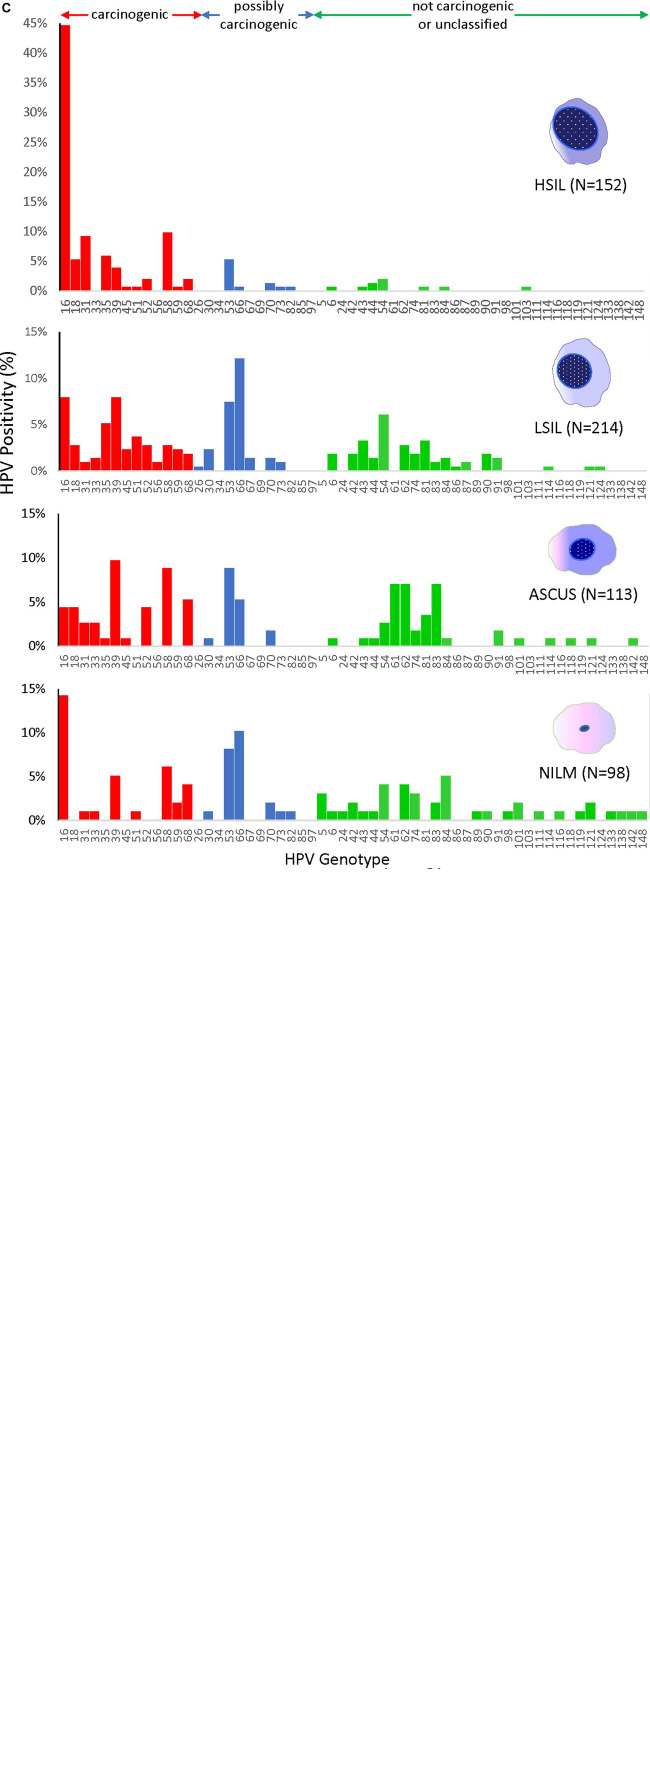
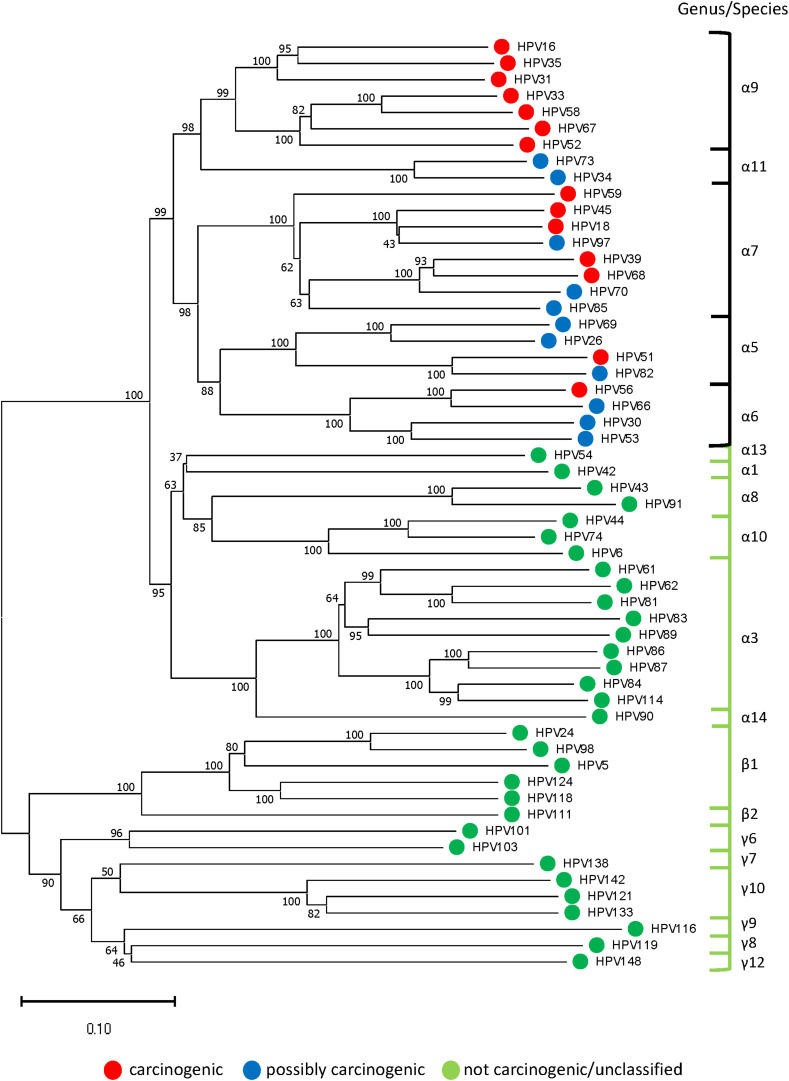
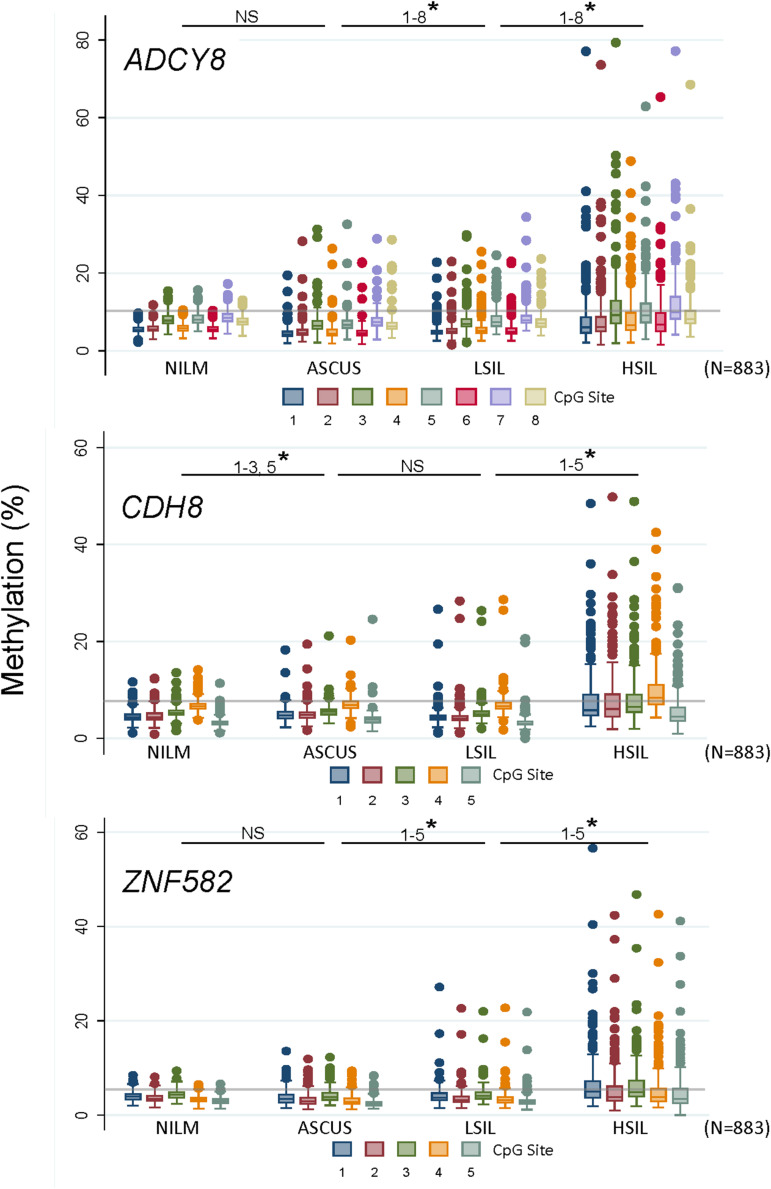
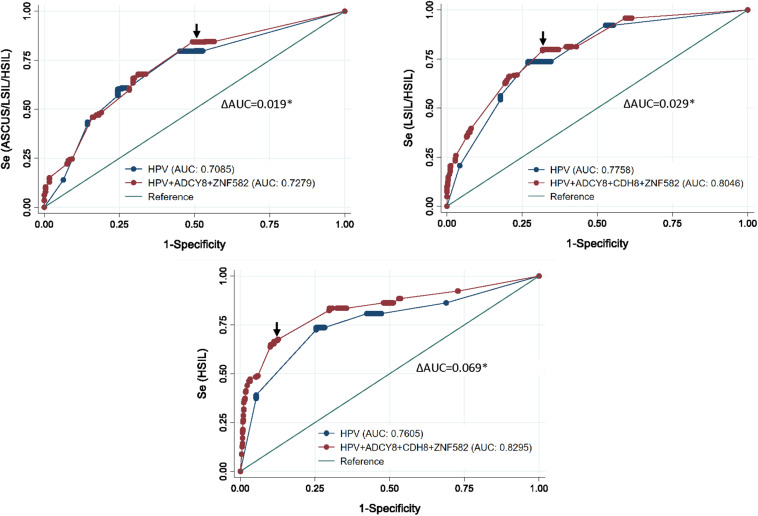
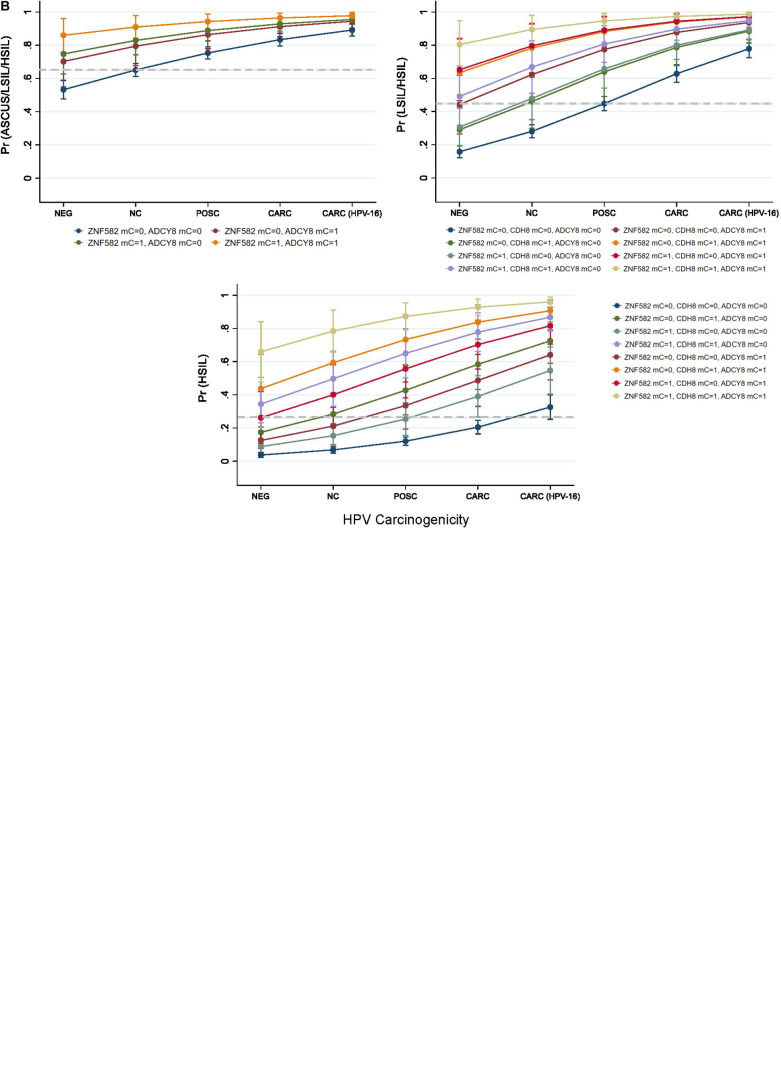
Primary high-risk Human Papillomavirus (hrHPV) screening has recently become an accepted standalone or co-test with conventional cytology. Unfortunately, hrHPV singularly lacks specificity for cytopathological grade. However, mechanisms and markers of evolving virus-host interactions at the epigenome level may be harnessed as a better predictor of carcinogenesis. This study aimed to validate and expand the clinical performance of a multiparametric biomarker panel, referred to as the "Molecular Pap smear" based, on HPV genotype and ADCY8, CDH8 and ZNF582 CpG-methylation as a predictive classifier of cervical cytology. This prospective, cross-sectional study used an independent cohort of residual liquid-based cytology for HPV genotyping and epigenetic analysis. Extracted DNA underwent parallel PCR using 3 primer sets for HPV DNA amplification. HPV-infected samples were genotyped by Sanger sequencing. Promoter methylation levels of 3 tumor suppressor genes were quantified by bisulfite-pyrosequencing of genomic DNA on the newest high-resolution PyroMark Q48 platform. Logistic model performance was compared, and model parameters were used to predict and classify binary cytological outcomes. A total of 883 samples were analyzed. HPV DNA positivity correlated with worsening grade: 125/237 (53%) NILM; 136/235 (58%) ASCUS; 222/229 (97%) LSIL; and 157/182 (86%) HSIL samples. The proportion of carcinogenic HPV-types in PCR-positive sequenceable samples correlated with worsening grade: NILM 34/98 (35%); ASCUS 50/113 (44%); LSIL 92/214 (43%); HSIL 129/152 (85%). Additionally, ADCY8, CDH8, and ZNF582 methylation levels increased in direct correlation with worsening grade. Overall, the multi-marker modeling parameters predicted binarized cytological outcomes better than HPV-type alone with significantly higher area under the receiver operator curve (AUC)s, respectively: NILM vs. > NILM (AUC 0.728 vs. 0.709); NILM/ASCUS vs. LSIL/HSIL (AUC 0.805 vs. 0.776); and <HSIL vs. HSIL (AUC 0.830 vs. 0.761). Our expanded findings validated the multivariable prediction model developed for cytological classification. The sequencing-based "Molecular Pap smear" outperformed HPV-type alone in predicting four grades of cervical cytology. Additional host epigenetic markers that evolved with disease progression decidedly contributed to the overall classification accuracy.

Keywords: DNA methylation; carcinogenesis; epigenetic modification; evolution; host-pathogen interactions; human papillomavirus infection; pap smear; pyrosequencing.


Figures

FIGURE 1
FIGURE 1
Protocol schema and representative images of four cervical cytological grades used in the study. (A) Sample collection, DNA extraction, HPV genotyping by Sanger sequencing and genomic CpG profiling of loci-specific promoters by PSQ. Sequencing results are used for statistical modeling, prediction and classification. (B) Four categories of liquid-based cervical cytology: NILM, ASC-US, LSIL, and HSIL with cytomorphologic features of disease progression, i.e., increased nuclear enlargement, nuclear membrane irregularity, nuclear/cytoplasmic ratio, and chromatin coarseness (ThinPrep Pap smear, 50x magnification). Bottom, binarized classification of 4 cytological grades used as outcomes (“0” and “1”) for logistic regression. Three distinct, sequential logit models were used for outcome prediction by molecular signatures. (C) PyroMark Q48 PSQ instrument and 48-well sample disk (expanded) used for DNA methylation analysis. Bottom, the PSQ CpG assays for three host genes: ADCY8, CDH8, and ZNF582 are shown according to chromosomal locations (red line). The representative pyrograms with assay specific CpG sites (blue-gray columns) are shown with sequence specific, light-intensity peaks along the x- and y-axis, respectively. Chromosome ideograms adapted from NCBI Map Viewer (www.ncbi.nlm.nih.gov/genome/guide/human)]. ASC-US, atypical squamous cells of undetermined significance; chr, chromosome; gDNA, genomic DNA; HSIL, high-grade squamous intraepithelial lesion; LSIL, low-grade squamous intraepithelial lesion; NILM, negative for intraepithelial lesion or malignancy; PCR, polymerase chain reaction; PSQ, pyrosequencing. Photo credit (cytology): Bradie Bishop, MD.
FIGURE 2
FIGURE 2
HPV prevalence and genotype distribution found in 4 cytological grades. (A) HPV DNA positivity rate for 883 samples as determined by PCR amplification and gel electrophoresis. The positive rates for NILM and ASCUS were over 50%, whereas the rates were significantly higher for LSIL and HSIL at ∼80–90% (top) (*p < 0.05, chi-square test). (B) Distribution of HPV-positive rates stratified by type-specific carcinogenic potential for PCR-positive/sequenced samples (n = 640). Progression of cytological grade from NILM to HSIL correlated with a significant uptrend in carcinogenic HPV-types and a downtrend in possibly and not carcinogenic/unclassified HPV-types (*p < 0.05, chi-square trend test). Samples with poor or noisy sequence quality unidentifiable by BLAST also decreased with worsening cytological grade (*p < 0.05, chi-square trend test). (C) HPV genotype distribution of 577 cytology samples as determined by PCR/Sanger sequencing according to cytological diagnoses. The remaining 63 HPV-positive samples could not be genotyped due to poor sequence quality and/or overlapping sequences of mixed infections. The proportion of carcinogenic HPV genotypes (red bars) increased coincidently with cytological grade (*p < 0.05, chi-square trend test). In contrast, the possibly and not carcinogenic/unclassified HPV-types (blue and green bars, respectively) significantly diminished (*p < 0.05, chi-square trend test). Simultaneously, species richness diminished from NILM to HSIL (38 to 23 genotypes, respectively) while HPV-16 surged in 68/152 (45%) HSIL samples. ASC-US, atypical squamous cells of undetermined significance; CARC, carcinogenic HPV; HSIL, high- grade squamous intraepithelial lesion; LSIL, low-grade squamous intraepithelial lesion; NA, not available/identifiable by BLAST; NILM, negative for intraepithelial lesion or malignancy; NOT CARC, not carcinogenic; NS, not significant; POSS CARC, possibly carcinogenic Stars, p < 0.01.
FIGURE 3
FIGURE 3
Representative phylogenetic tree of HPV genotypes identified in the clinical samples. Neighbor-Joining tree of 57 HPV genotypes (one from each genotype) revealed two distinct clades in the alpha genera: “high-risk” containing carcinogenic and possibly carcinogenic types [black bracket] and “low-risk” containing probably not carcinogenic or not classifiable types [green bracket]. The beta and gamma genera formed another clade composed of commensal and unclassified genotypes. With HPV-16 at the pinnacle of HPV carcinogenic potential, genetic divergence from this point correlated with decreased carcinogenic risk (phenotype) and grade of cytopathology. The evolutionary history was inferred using the Neighbor-Joining method after concatenating 57 aligned, E6, E7, and L1 reference nucleotide sequences from Papillomavirus Episteme by MUSCLE (Edgar, 2004). The optimal tree with the sum of branch length = 9.99536245 is shown. The percentage of replicate trees in which the associated taxa clustered together in the bootstrap test (1000 replicates) are shown next to the branches (Felsenstein, 1985). The tree is drawn to scale, with branch lengths in the same units as those of the evolutionary distances used to infer the phylogenetic tree. The evolutionary distances were computed using the Maximum Composite Likelihood method (Tamura et al., 2004) and are in the units of the number of base substitutions per site. All ambiguous positions were removed for each sequence pair (pairwise deletion option). There were a total of 2850 positions in the final dataset. Evolutionary analyses were conducted in MEGA X (Kumar et al., 2018).
FIGURE 4
FIGURE 4
Loci-specific promoter methylation differences and trends among cervical cytological grades. Methylation (%) of total genomic DNA in 4 grades of cervical cytology i.e., NILM (n = 237), ASC-US (n = 235), LSIL (n = 229), and HSIL (n = 182) was compared by CpG sites among 3 genes (ADCY8, CDH8, and ZNF582). Pairwise comparisons of methylation for each CpG site between cytological grades (NILM vs. ASC-US, ASC-US vs. LSIL, and LSIL vs. HSIL) revealed significantly higher levels at multiple sites as noted by a star (* p < 0.05 by the Wilcoxon rank-sum test). Methylation levels for all CpG sites increased coincidently with cytological grade for ADCY8, CDH8, and ZNF582 by Spearman’s rs (p < 0.05, with Bonferroni adjustment) except for ADCY8 CpG sites 1–5. The methylation reference line (gray) for each assay denotes the median of the 95th percentile values for each CpG site within an assay derived from NILM (HPV-negative) samples, i.e., ADCY8 (10.11%), CDH8 (7.61%), and ZNF582 (5.22%). ASC-US, atypical squamous cells of undetermined significance; HSIL, high-grade squamous intraepithelial lesion; LSIL, low-grade squamous intraepithelial lesion; NILM, negative for intraepithelial lesion or malignancy; NS, not statistically significant.
FIGURE 5
FIGURE 5
Receiver operating characteristic (ROC) curve analysis after multivariable logistic regression for three logit models. Top left, the ROC curve revealed the best predictors to differentiate between NILM and ASCUS/LSIL/HSIL as HPV carcinogenicity, ZNF582_1st CpG site, and ADCY8_5th CpG site. Top right, for differentiating between NILM/ASCUS and LSIL/HSIL cytology, the best multivariate predictor was the combination of HPV carcinogenicity, ZNF582_1st CpG site, CDH8_4th CpG site, and ADCY8_5th CpG site. Bottom, for differentiating between NILM/ASCUS/LSIL and HSIL cytology, the best multivariate predictor was the combination of HPV carcinogenicity, ZNF582_1st CpG site, CDH8_4th CpG site, and ADCY8_6th CpG site. All three multivariable models were better predictors of the specified outcome than HPV carcinogenicity alone (delta AUC*, p < 0.05, chi-square test). AUC, Area under the receiver operator curve (AUC); se, sensitivity; cut-off points (arrows).
FIGURE 6
FIGURE 6
Predicted probabilities plot of binarized cytological outcomes using HPV carcinogenicity as a singular or integrated predictor variable. (A) HPV carcinogenicity as a one-dimensional predictor of 3 sequentially binarized cytological outcomes (NILM vs. ASC-US/LSIL/HSIL, NILM/ASCUS vs. LSIL/HSIL, and NILM/ASC-US/LSIL vs. HSIL) is shown with respective cut-off values of ≥0.680, 0.5222, and 0.3321 (dashed lines) as determined by Youden’s index. (B) HPV carcinogenicity and host loci-specific methylation as predictors of cytological outcome. Top left, comparison of predicted probabilities for abnormal cytology (NILM vs. ASC-US/LSIL/HSIL) by HPV carcinogenicity and binarized ZNF582 and ADCY8 methylation status. Top right, comparison of predicted probabilities for NILM/ASC-US vs. LSIL/HSIL permuted by binarized methylation values of ADCY8, CDH8, and ZNF582 at the CpG sites noted in the text. Bottom, comparison of predicted probabilities for <HSIL vs. HSIL permuted by binarized methylation values of ADCY8, CDH8, and ZNF582 at the CpG sites noted in the text. The cut-off values for predicting a positive binarized cytological outcomes (NILM vs. ASC-US/LSIL/HSIL, NILM/ASC-US vs. LSIL/HSIL, and NILM/ASC-US/LSIL vs. HSIL) were ≥0.6503, 0.4533, and 0.2645 (dashed lines) as determined by Youden’s index. Definitions: For loci-specific CpG methylation levels (%), the 95th percentile value for each CpG derived from HPV-negative. NILM cytology was used as the cut-off for normal methylation (coded as 0); >95th percentile was deemed hypermethylated (coded as 1). AUC, area under the curve; mC, 5-methylcytosine at CpG sites; mC = 0, unmethylated cytosine; mC = 1, methylated cytosine; Pr, probability; ROC, Receiver operating characteristic; Se, sensitivity.

Similar articles

Cited by

References

    1. Au Yeung C. L., Tsang W. P., Tsang T. Y., Co N. N., Yau P. L., Kwok T. T. (2010). Hpv-16 E6 upregulation of Dnmt1 through repression of tumor suppressor p53. Oncol. Rep. 24 1599–1604. 10.3892/or_00001023 - DOI - PubMed
    1. Beerenwinkel N., Greenman C. D., Lagergren J. (2016). Computational cancer biology: an evolutionary perspective. PLoS Comput. Biol. 12:e1004717. 10.1371/journal.pcbi.1004717 - DOI - PMC - PubMed
    1. Beltrán-García J., Osca-Verdegal R., Mena-Mollá S., García-Giménez J. L. (2019). Epigenetic IVD tests for personalized precision medicine in cancer. Front. Genet. 10:621. 10.3389/fgene.2019.00621 - DOI - PMC - PubMed
    1. Bernard H. U., Burk R. D., Chen Z., van Doorslaer K., zur Hausen H., de Villiers E. M. (2010). Classification of papillomaviruses (PVs) based on 189 PV types and proposal of taxonomic amendments. Virology 401 70–79. 10.1016/j.virol.2010.02.002 - DOI - PMC - PubMed
    1. Bosch F. X., Broker T. R., Forman D., Moscicki A. B., Gillison M. L., Doorbar J. (2013). ‘Comprehensive Control of HPV Infections and Related Diseases’ Vaccine Volume 30, Supplement 5, 2012. Comprehensive control of human papillomavirus infections and related diseases. Vaccine 31(Suppl. 8), I1–I31. 10.1016/j.vaccine.2013.07.026 - DOI - PMC - PubMed