. 2020 Oct 15:11:561947.
doi: 10.3389/fimmu.2020.561947. eCollection 2020.

Spatiotemporal Alterations in Gait in Humanized Transgenic Sickle Mice

Affiliations

Spatiotemporal Alterations in Gait in Humanized Transgenic Sickle Mice

Stacy Kiven et al. Front Immunol. .

Abstract

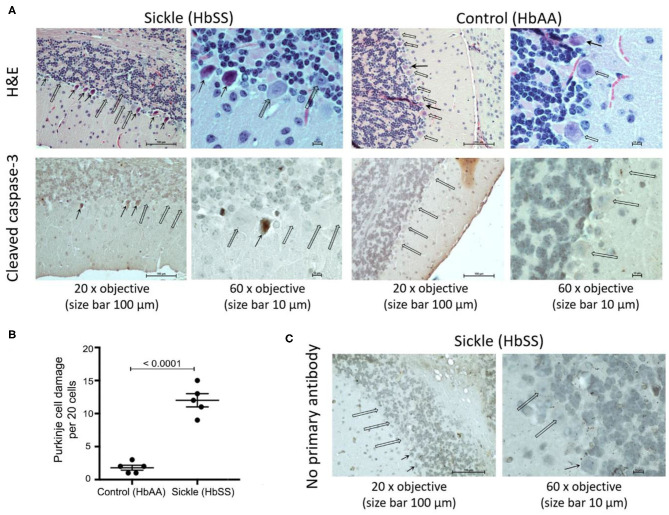
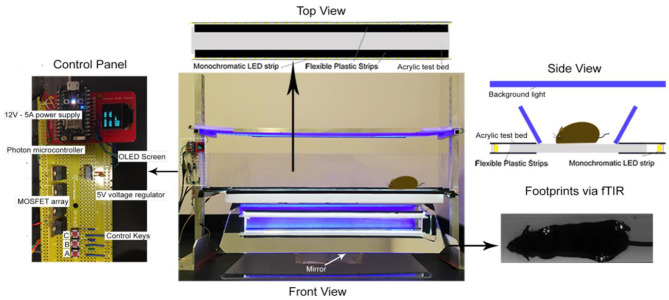
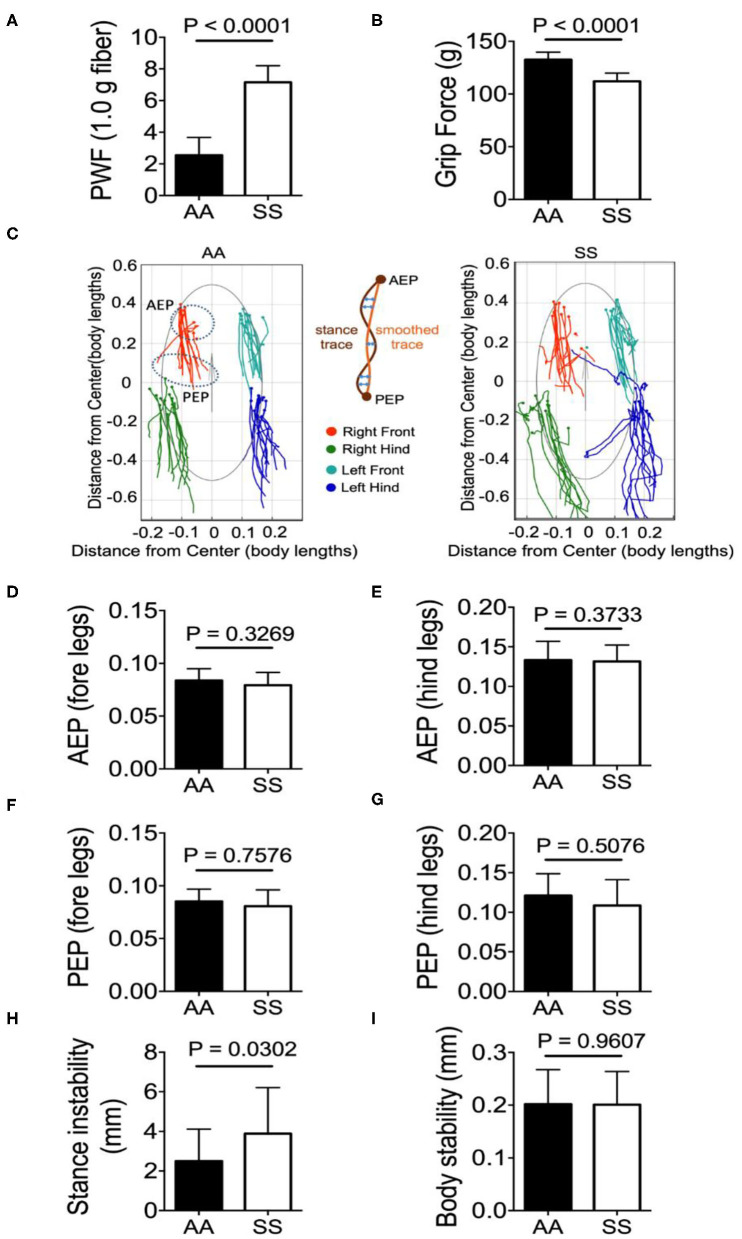
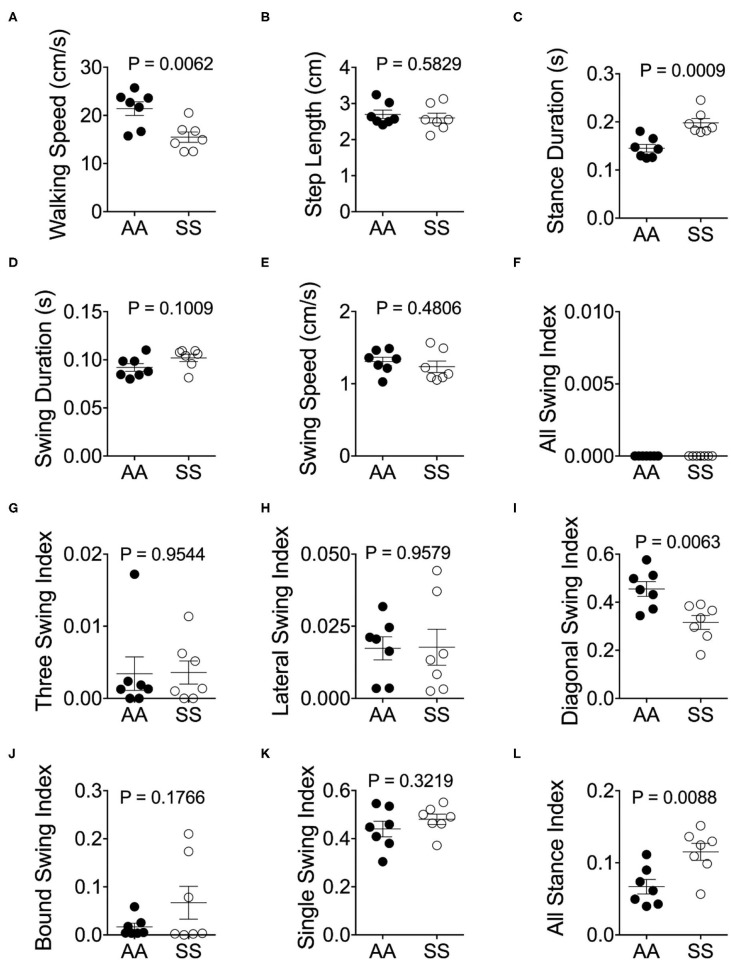
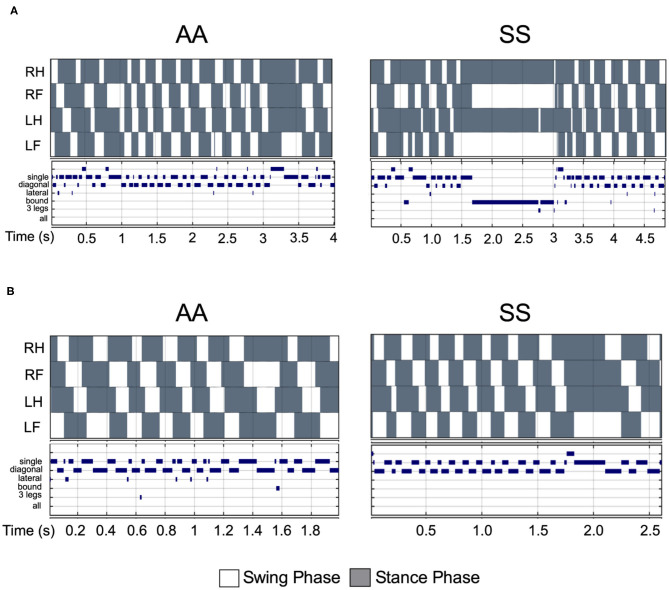
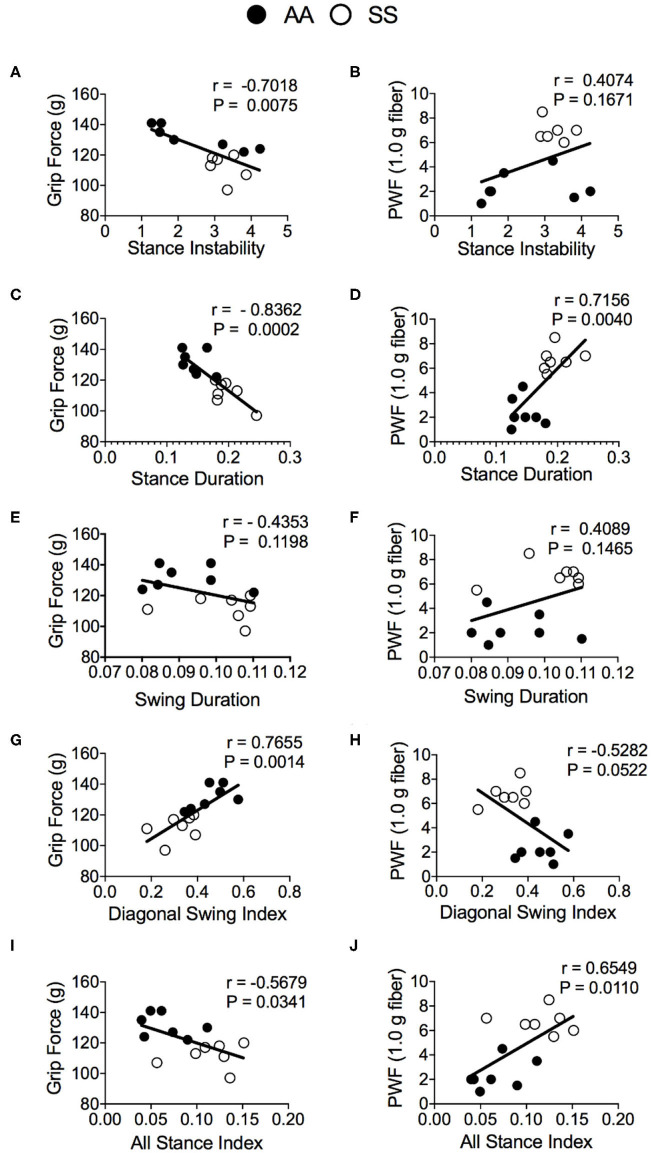
Sickle cell disease (SCD) is a hemoglobinopathy affecting multiple organs and featuring acute and chronic pain. Purkinje cell damage and hyperalgesia have been demonstrated in transgenic sickle mice. Purkinje cells are associated with movement and neural function which may influence pain. We hypothesized that Purkinje cell damage and/or chronic pain burden provoke compensatory gait changes in sickle mice. We found that Purkinje cells undergoe increased apoptosis as shown by caspase-3 activation. Using an automated gait measurement system, MouseWalker, we characterized spatiotemporal gait characteristics of humanized transgenic BERK sickle mice in comparison to control mice. Sickle mice showed alteration in stance instability and dynamic gait parameters (walking speed, stance duration, swing duration and specific swing indices). Differences in stance instability may reflect motor dysfunction due to damaged Purkinje cells. Alterations in diagonal and all stance indices indicative of hesitation during walking may originate from motor dysfunction and/or arise from fear and/or anticipation of movement-evoked pain. We also demonstrate that stance duration, diagonal swing indices and all stance indices correlate with both mechanical and deep tissue hyperalgesia, while stance instability correlates with only deep tissue hyperalgesia. Therefore, objective analysis of gait in SCD may provide insights into neurological impairment and pain states.

Keywords: gait; histopathology; hyperalgesia; purkinje cell; sickle cell disease.


Figures

Figure 1
Figure 1
Sickle mice show increased Purkinje cell damage compared to control mice. Cerebellum from ~3.5 month old female HbSS-BERK sickle and HbAA-BERK control mice. (A) H&E and capase-3 stained sections of cerebellum at 20x objective, size bar 100 μm and at 60x objective, size bar 10 μm. Open arrows: normal Purkinje cells with well-organized nucleus. Solid arrows: apoptotic Purkinje cells with smudged and irregular nuclei with condensed chromatin. (B) Quantification of Purkinje cell apoptosis per 20 cells/mouse brain from 5 control 5 sickle mice (unpaired two-tailed t-test). (C) Incubation of sickle mice brain sections without primary antibody showed no cross reactivity with secondary antibody as a negative control. Open arrows: normal Purkinje cells. Solid arrows: apoptotic Purkinje cells with smudged irregular nuclei.
Figure 2
Figure 2
MouseWalker Apparatus. Each mouse was individually placed in a transparent corridor (8 × 80 cm2) with acrylic glass floor panel mounted with LED lights, which produced a detectable touch sensor. Total internal reflection (TIR) of the LEDs in the acrylic surface was measured with embedded light sensors. During natural walking, foot contact disrupted TIR causing frustrated total internal reflection (fTIR) within the transparent material. The fTIR illuminated points of contact, which were detected by a high-speed CMOS camera (Lumenera Lt425C, Lumenera Corporation, Ottawa, Ontario) with a 16 mm lens. Constant background lighting was established with a backlit board placed 40 cm over the corridor, which comprised two-colored LEDs and aluminum bar sets (HL-LS5050_RGB300NW44K, HitLights, LA, USA; 9001 K25, MacMaster-Carr, IL, USA). The light color was set by a controller box and remote control. The background light and FTIR light were set to blue (intensity: 60%) and white (intensity: 100%), respectively, for optimum video quality. High-performance digital video recording software was used (StreamPix 7, Norpix, Montreal, Quebec) at a resolution of 2048 × 2048 for data assessment. Mice were habituated in the corridor during 3 days before experiment date. Four videos were taken of each mouse and 2 videos of uninterrupted walking were selected and analyzed. The MouseWalker program was developed and compiled in MATLAB (The Mathworks, MA, USA). Matlab software was used to distinguish the footprints from background and convert the videos to grayscale prior to analysis in the MouseWalker software. The mislabeled footprints or body features were manually adjusted following automatic detection with MouseWalker software. Gait-related parameters such as stance instability, walking speed, and swing/stance duration were extracted and exported from the MouseWalker software to determine correlation with measures of hyperalgesia.
Figure 3
Figure 3
Sickle mice with chronic pain present stance instability. Hyperalagesia and gait parameters were measured in the test groups of untreated HbSS-BERK sickle (SS) and HbAA-BERK control (AA) mice. (A) Mechanical hyperalgesia assessed by Paw Withdrawal Frequency (PWF) in response to 1.0-g von Frey filaments. Mechanical and (B) deep tissue hyperalgesia assessed by a computerized grip-force measure. (C) shows representative stance trace of one sickle (right) and control mouse (left) walking at 21.59 and 21.20 cm/s, respectively. The traces were determined by measuring the position of the stance phase footprints relative to the body center. The anterior extreme position (AEP) indicates stance onset and the posterior extreme position (PEP) indicates stance offset (positions encircled by a dashed line for the right fore paw). For each stance trace (maroon), a smoothed trace is generated (using data from every five frames; yellow trace), and the average of the difference between these two lines (orange arrows) corresponds to the stance instability. (D,E) Perpendicular AEP and (F,G) perpendicular PEP plots for both fore and hind legs, respectively. (H,I) show stance instability and body instability, respectively. Gait parameters were analyzed using Student's unpaired two-tailed t-test. Significance was determined by t-test (unpaired, two-tailed). A p < 0.05 was considered statistically significant. All data are represented as mean ± SEM. [n = 7 per group in (A,B,D–I)].
Figure 4
Figure 4
Alterations of gait parameters in sickle mice. Gait parameters were analyzed and compared between HbSS-BERK sickle (SS) and HbAA-BERK control (AA) mice The average walking speed (A), step length (B), stance (C), swing duration (D), and swing speed (E), were compared at walking speed between 10–40 cm/s. The seven stance indices of all-leg swing analyzed were (F), three-leg swing (G), lateral swing (H), diagonal swing (I), bound swing (J), single swing (K), and all stance (L). Gait parameters were analyzed using Student's unpaired two-tailed t-test. Significance was determined by t-test (unpaired, two-tailed). [n = 7 per group in (A–E)]. (F–H) Individual results of 3 videos per mouse. A p < 0.05 was considered statistically significant. All data are represented as mean ± SEM.
Figure 5
Figure 5
Comparison of step pattern and modalities between sickle and control mice under same walking velocity. (A) Representative stance trace and gait parameters of inter-leg coordination of HbSS-BERK sickle (SS) and HbAA-BERK control (AA) mice with walking speeds at 14.50 and 14.56 cm/s, respectively. (B) Representative stance trace and gait parameters of inter-leg coordination of SS and AA mice with walking speeds at 21.2 and 21.59 cm/s, respectively. The upper images of all graphs are gait patterns are composed of two phases which are swing phase (white areas) and stance phase (gray areas). The lower panel shows step combinations.
Figure 6
Figure 6
Correlation of gait parameters with deep tissue and mechanical hyperalgesia measures. Pearson correlation analysis was performed to detect associations of gait parameters with hyperalgesia in HbSS-BERK sickle (SS) and HbAA-BERK control (AA) mice. Correlation test results of grip force measures and paw withdrawal frequency (PWF) in response to 1.0-g von Frey filament, respectively, with stance instability (A,B), stance duration (C,D), swing duration (E,F), diagonal swing index (G,H), and all stance index (I,J) are shown. [n = 7 per group in (A–J)] A p < 0.05 was considered statistically significant. All data are represented as mean ± SEM.

Similar articles

Cited by

References

    1. Aich A, Jones MK, Gupta K. Pain and sickle cell disease. Curr Opin Hematol. (2019) 26:131–8. 10.1097/MOH.0000000000000491 - DOI - PubMed
    1. Ballas SK, Gupta K, Adams-Graves P. Sickle cell pain: a critical reappraisal. Blood. (2012) 120:3647–56. 10.1182/blood-2012-04-383430 - DOI - PubMed
    1. Kato GJ, Piel FB, Reid CD, Gaston MH, Ohene-Frempong K, Krishnamurti L, et al. Sickle cell disease. Nat Rev Dis Primers. (2018) 4:18010 10.1038/nrdp.2018.10 - DOI - PubMed
    1. Telen MJ, Malik P, Vercellotti GM. Therapeutic strategies for sickle cell disease: towards a multi-agent approach. Nat Rev Drug Discov. 18:139–58 (2019). 10.1038/s41573-018-0003-2 - DOI - PMC - PubMed
    1. Tran H, Gupta M, Gupta K. Targeting novel mechanisms of pain in sickle cell disease. Blood. (2017) 130:2377–85. 10.1182/blood-2017-05-782003 - DOI - PMC - PubMed

Publication types

MeSH terms