. 2020 Oct 14:11:571959.
doi: 10.3389/fimmu.2020.571959. eCollection 2020.

Threonyl-tRNA Synthetase Promotes T Helper Type 1 Cell Responses by Inducing Dendritic Cell Maturation and IL-12 Production via an NF-κB Pathway

Affiliations

Threonyl-tRNA Synthetase Promotes T Helper Type 1 Cell Responses by Inducing Dendritic Cell Maturation and IL-12 Production via an NF-κB Pathway

Hak-Jun Jung et al. Front Immunol. .

Abstract

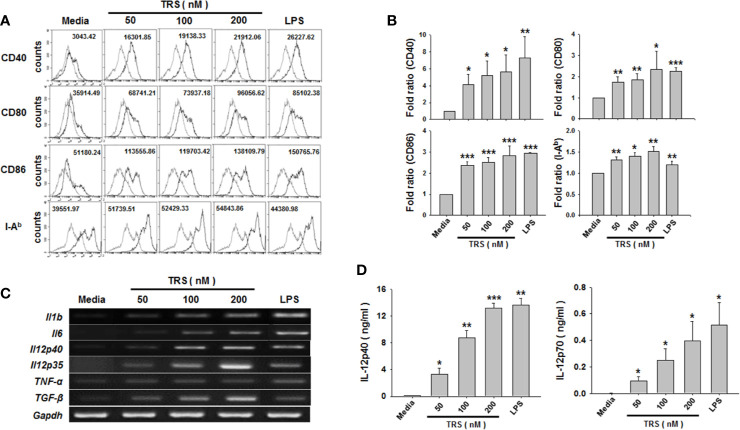
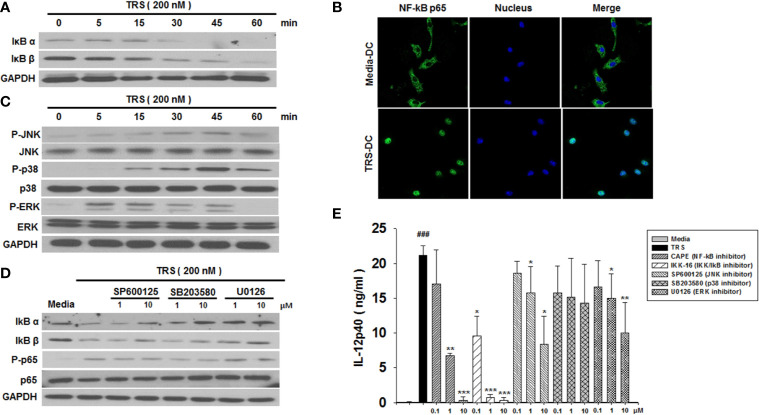
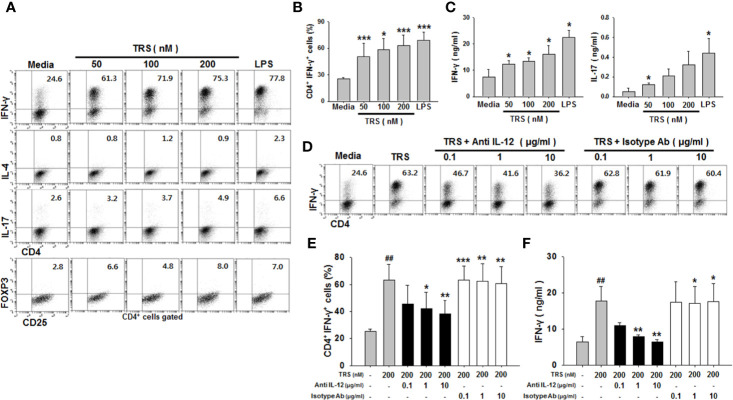
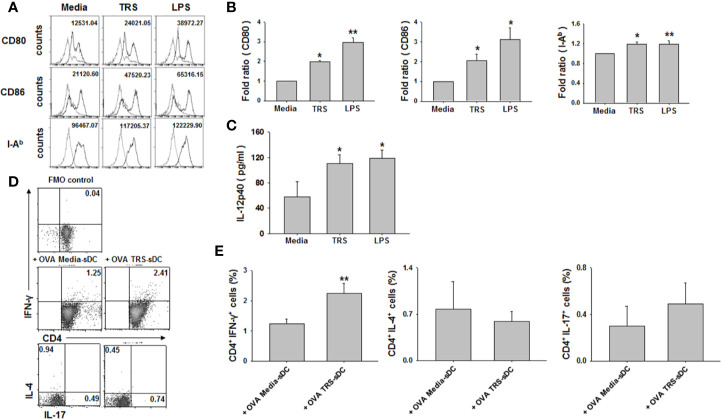
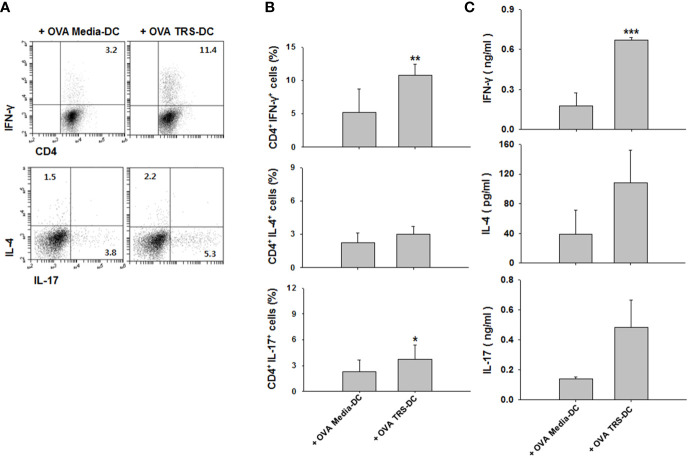
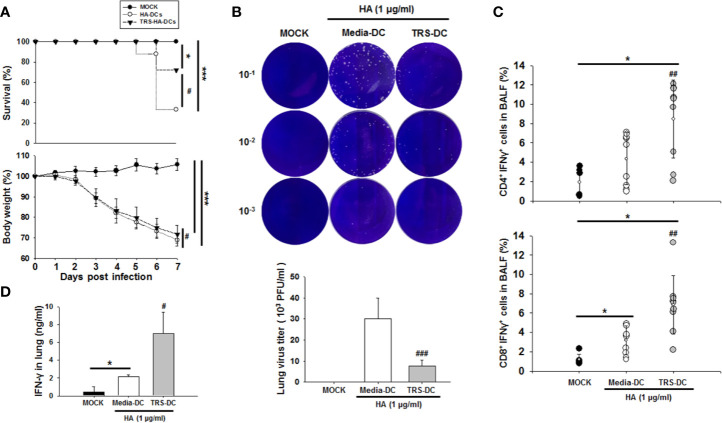
Threonyl-tRNA synthetase (TRS) is an aminoacyl-tRNA synthetase that catalyzes the aminoacylation of tRNA by transferring threonine. In addition to an essential role in translation, TRS was extracellularly detected in autoimmune diseases and also exhibited pro-angiogenetic activity. TRS is reported to be secreted into the extracellular space when vascular endothelial cells encounter tumor necrosis factor-α. As T helper (Th) type 1 response and IFN-γ levels are associated with autoimmunity and angiogenesis, in this study, we investigated the effects of TRS on dendritic cell (DC) activation and CD4 T cell polarization. TRS-treated DCs exhibited up-regulated expression of activation-related cell-surface molecules, including CD40, CD80, CD86, and MHC class II. Treatment of DCs with TRS resulted in a significant increase of IL-12 production. TRS triggered nuclear translocation of the NF-κB p65 subunit along with the degradation of IκB proteins and the phosphorylation of MAPKs in DCs. Additionally, MAPK inhibitors markedly recovered the degradation of IκB proteins and the increased IL-12 production in TRS-treated DCs, suggesting the involvement of MAPKs as the upstream regulators of NF-κB in TRS-induced DC maturation and activation. Importantly, TRS-stimulated DCs significantly increased the populations of IFN-γ+CD4 T cells, and the levels of IFN-γ when co-cultured with CD4+ T cells. The addition of a neutralizing anti-IL-12 mAb to the cell cultures of TRS-treated DCs and CD4+ T cells resulted in decreased IFN-γ production, indicating that TRS-stimulated DCs may enhance the Th1 response through DC-derived IL-12. Injection of OT-II mice with OVA-pulsed, TRS-treated DCs also enhanced Ag-specific Th1 responses in vivo. Importantly, injection with TRS-treated DC exhibited increased populations of IFN-γ+-CD4+ and -CD8+ T cells as well as secretion level of IFN-γ, resulting in viral clearance and increased survival periods in mice infected with influenza A virus (IAV), as the Th1 response is associated with the enhanced cellular immunity, including anti-viral activity. Taken together, these results indicate that TRS promotes the maturation and activation of DCs, DC-mediated Th1 responses, and anti-viral effect on IAV infection.

Keywords: aminoacyl-tRNA synthetase; dendritic cell; influenza A virus; interferon-γ; interleukin-12; threonyl-tRNA synthetase; type 1 helper T cells.


Figures

Figure 1
Figure 1
Threonyl-tRNA synthetase (TRS) increases the expression levels of surface molecules and cytokines in bone marrow-derived dendritic cells (DCs). Bone marrow-derived DCs were isolated from C57BL/6 mice as described in the Materials and Methods. Immature-DCs (iDCs) were cultured for 20 h (A, D), or 6 h (C) with threonyl-tRNA synthetase (TRS; 50, 100, and 200 nM) or lipopolysaccharide (500 ng/ml). (A) The expression of CD40, CD80, CD86, and I-Ab molecules, as detected by flow cytometry for CD11c+ gated cells. Gray histograms, isotype control; black histograms, anti-CD40, anti-CD80, anti-CD86, and anti-I-Ab Ab. Representative figures are presented. The value shown in the histograms represents the mean fluorescence intensity. (B) The fold ratio of surface molecules expression was plotted with the media-treated DCs as 1.0. The data represent mean ± SD of three independent experiments (n = 3); *P < 0.05, **P < 0.01 and ***P < 0.001 compared with media-treated DCs. (C) mRNA levels of pro-inflammatory cytokines, as confirmed by reverse transcriptase-polymerase chain reaction. GAPDH is used as a control. (D) Levels of IL-12p40 and IL-12p70 in cell supernatants, as detected by enzyme-linked immunosorbent assay. Experiments were conducted three times independently and are represented as the mean ± SEM of results performed in triplicate (n = 3). Statistical significance was assessed using unpaired Student’s t-test; *P < 0.05, **P < 0.01 and ***P < 0.001 compared with media-treated DCs.
Figure 2
Figure 2
Threonyl-tRNA synthetase (TRS) activates dendritic cells (DCs) through the NF-κB and MAPK signaling pathways. (A) IκBα, IκBβ, and GAPDH expression levels, as measured by western blotting of DCs treated with TRS in a time-dependent manner (0–60 min). (B) The nuclear translocation of NF-κB p65, as detected by confocal laser scanning microscopy (LSM 800, Carl Zeiss, Oberkochen, Germany) of DCs treated with TRS (200 nM) for 1 h and then incubated with an anti-NF-κB p65 antibody (Ab), followed by staining with an Alexa Fluor 488-conjugated Ab and 4′,6-diamidino-2-phenylindole (DAPI). (C) DC culture method described in (A). Western blotting for phosphorylated JNK, p38, and ERK or unphosphorylated JNK, p38, and ERK. (D) Levels of IκBα, IκBβ, NF-κB p65, and phosphorylated NF-κB p65, as detected via western blot analysis of DCs pretreated with the MAPK inhibitors (1, 10 μM) and treated for 30 min with TRS. (E) IL-12p40 levels in the supernatant, as detected via ELISA of DCs pretreated with the indicated inhibitors (0.1, 1, 10 μM) for 30 min and treated with TRS for 20 h. The media-treated DCs without inhibitors was analyzed as a control. Experiments were conducted three times independently and are represented as the mean ± SEM of results performed in triplicate (n = 3). Statistical significance was assessed using unpaired Student’s t-test; ###P < 0.001 compared with media-treated DCs, *P < 0.05, **P < 0.01 and ***P < 0.001 as determined by one-way analysis of variance with a Bonferroni post-test for multiple comparisons.
Figure 3
Figure 3
Threonyl-tRNA synthetase (TRS) induces the polarization of Th1 cells through the secretion of IL-12 from DCs. Dendritic cells (DCs) were treated with ovalbumin (OVA, 10 μg/ml) for 2 h and OVA-DCs were treated with TRS (50, 100, and 200 nM) or LPS (500 ng/ml) for 6 h. DCs were cultured with OT-II CD4+ T cells at a 1:10 ratio for three days. (A) IFN-γ-, IL-4-, IL-17- and Foxp3-expressing CD4+ T cell populations, as analyzed by flow cytometry. Representative figures are presented. (B) The data are expressed as the mean ± SD of three independent experiments (n = 3). (C) Protein levels of IFN-γ and IL-17 in the supernatant, as analyzed using ELISA. Data shown represent the mean ± SEM of three independent experiments (n = 3). (B, C) *P < 0.05, and ***P < 0.001 compared with media-treated DCs. (D) IFN-γ+ CD4+ T cells, as analyzed via flow cytometry, of DCs treated with OVA (10 μg/ml) for 2 h and then treated with 200 nM TRS for 6 h. The DCs were cultured with OT-II CD4+ T cells at a 1:10 ratio in the presence of anti-IL-12 antibody (Ab) (0.1–1 μg/ml) or isotype Ab (0.1–1 μg/ml) for three days. Representative figures are presented. (E) The population of IFN-γ+CD4+ T cells is presented as the mean ± SD of three independent experiments (n = 3). (F) Protein levels of IFN-γ in the supernatants, as detected by ELISA. Data shown represent the mean ± SEM of three independent experiments (n = 3). (E, F) Statistical significance was assessed using unpaired Student’s t-test; ##P < 0.01 compared with CD4+ T cells co-cultured with media-treated DCs, *P < 0.05, **P < 0.01 and ***P < 0.001 as determined by one-way analysis of variance with a Bonferroni post-test for multiple comparisons.
Figure 4
Figure 4
Threonyl-tRNA synthetase (TRS) induces the maturation of primary splenic DCs and promotes the polarization of Th1 cells. Splenic dendritic cells (DCs) were isolated from mouse spleen using CD11c MicroBeads (Miltenyi Biotec) and primary splenic DCs were cultured for 20 h with TRS (200 nM) or LPS (500 ng/ml). (A) The expression of CD80, CD86, and I-Ab molecules, as detected by flow cytometry for CD11c+ gated cells. Gray histograms, isotype control; black histograms, anti-CD80, anti-CD86, and anti-I-Ab Ab. Representative figures are presented. The value shown in the histograms represents the mean fluorescence intensity. (B) The fold ratio of surface molecules expression was plotted with the media-treated DCs as 1.0. The data represent mean ± SD of three independent experiments (n = 3); *P < 0.05 and **P < 0.01 compared with media-treated DCs. (C) Levels of IL-12p40 in cell supernatants, as detected by enzyme-linked immunosorbent assay (ELISA). Experiments were conducted three times independently and are represented as the mean ± SEM (n = 3). Statistical significance was assessed using unpaired Student’s t-test; *P < 0.05 compared with media-treated DCs. (D) IFN-γ-, IL-4-, and IL-17-expressing cells, as detected by flow cytometry for CD4+ gated cells of splenic DCs treated with OVA (10 μg/ml) for 2 h and then treated with media or TRS (200 nM) for 6 h. The DCs were cultured with OT-II CD4+ T cells at a 1:5 ratio for three days. Some cells were only stained with CD4 to generate FMO control for IFN-γ. Representative figures are presented. (E) The populations of CD4+-IFN-γ+, -IL-4+, and -IL-17+ cells are presented as the mean ± SD of three independent experiments (n = 3). *P < 0.05 and **P < 0.01 compared with the group injected with OVA, media-treated DCs.
Figure 5
Figure 5
Threonyl-tRNA synthetase (TRS)-treated DCs induce Th1 polarization in vivo. Dendritic cells (DCs) were isolated from C57BL/6 mice as described in the Materials and Methods. Immature-DCs (iDCs) were cultured with ovalbumin (OVA, 10 μg/ml) for 2 h and OVA-DCs were treated with media or TRS (200 nM) for 6 h, harvested, and then, DCs were subcutaneously injected into OT-II mice through the footpad. After seven days, the draining lymph node cells were isolated and cultured for three days in the presence with OVA (100 μg/ml). (A) The populations of IFN-γ-, IL-4-, and IL-17-expressing CD4+ T cells, as analyzed by flow cytometry. Representative figures are presented. Results from (A) are summarized in (B) as the mean ± SD of three independent experiments (n = 6). (C) Protein levels of IFN-γ, IL-4, and IL-17 in the culture supernatant, as analyzed using enzyme-linked immunosorbent assay. Data shown represent the mean ± SEM of three independent experiments (n = 6). (B, C) *P < 0.05, **P < 0.01, ##P < 0.01, and ***P < 0.001 compared with the group injected with OVA, media-treated DCs.
Figure 6
Figure 6
Threonyl-tRNA synthetase (TRS)-treated DCs induce an anti-viral effect in influenza virus A/WSN/1933 (H1N1)-infected mice. Female 7-week-old C57BL/6 mice were immunized with hemagglutinin (HA)- or TRS-HA-DCs. Three days later, mice were infected intranasally with 1 mLD50 of H1N1 influenza. (A) After infection for 7 days, infected mice were monitored for body weight loss and survival. Data represent n= 12 mice (MOCK), n=18 mice (HA-DC), and n=18 mice (TRS-HA-DC) from three independent experiments. Data shown are the mean ± SD and statistical significance was analyzed using Kaplan-Meier method and a log-rank test (survival) and Mann-Whitney U test (body weight); *P < 0.05, and ***P < 0.001 compared with the group injected with PBS-injected groups (MOCK), #P < 0.05 compared with HA-DCs-injected groups. (B) Plaque assays of live influenza from whole lung at 7 days after infection. (C) Quantification of IFN-γ+CD4+ T cells and IFN-γ+CD8+ T cells identified in the bronchoalveolar lavage fluid by flow cytometry. Data represent n= 6 mice (MOCK), n=9 mice (HA-DC), and n=9 mice (TRS-HA-DC) from three independent experiments. (D) Protein levels of IFN-γ in the lung, as detected by ELISA Data shown represent the mean ± SEM of results performed in triplicate. Data shown are the mean ± SD (B, C), ± SEM (D) and statistical significance was assessed using unpaired Student’s t-test; *P < 0.05 compared with the group injected with PBS-injected groups (MOCK), #P < 0.05, ##P < 0.01, and ###P < 0.001 as determined by one-way analysis of variance with Bonferroni post-test for multiple comparisons.

Similar articles

Cited by

References

    1. Son SH, Park MC, Kim S. Extracellular activities of aminoacyl-tRNA synthetases: new mediators for cell-cell communication. Top Curr Chem (2014) 344:145–66. 10.1007/128_2013_476 - DOI - PubMed
    1. Martinis SA, Plateau P, Cavarelli J, Florentz C. Aminoacyl-tRNA synthetases: a family of expanding functions. Mittelwihr, France, October 10-15, 1999. EMBO J (1999) 18(17):4591–6. 10.1093/emboj/18.17.4591 - DOI - PMC - PubMed
    1. Liang D, Tian L, You R, Halpert MM, Konduri V, Baig YC, et al. AIMp1 Potentiates TH1 Polarization and Is Critical for Effective Antitumor and Antiviral Immunity. Front Immunol (2017) 8:1801. 10.3389/fimmu.2017.01801 - DOI - PMC - PubMed
    1. Lee EY, Lee HC, Kim HK, Jang SY, Park SJ, Kim YH, et al. Infection-specific phosphorylation of glutamyl-prolyl tRNA synthetase induces antiviral immunity. Nat Immunol (2016) 17(11):1252–62. 10.1038/ni.3542 - DOI - PMC - PubMed
    1. Park MC, Kang T, Jin D, Han JM, Kim SB, Park YJ, et al. Secreted human glycyl-tRNA synthetase implicated in defense against ERK-activated tumorigenesis. Proc Natl Acad Sci USA (2012) 109(11):E640–647. 10.1073/pnas.1200194109 - DOI - PMC - PubMed

Publication types