. 2020 Oct 15:11:580187.
doi: 10.3389/fimmu.2020.580187. eCollection 2020.

VISTA Re-programs Macrophage Biology Through the Combined Regulation of Tolerance and Anti-inflammatory Pathways

Affiliations

VISTA Re-programs Macrophage Biology Through the Combined Regulation of Tolerance and Anti-inflammatory Pathways

Mohamed A ElTanbouly et al. Front Immunol. .

Abstract

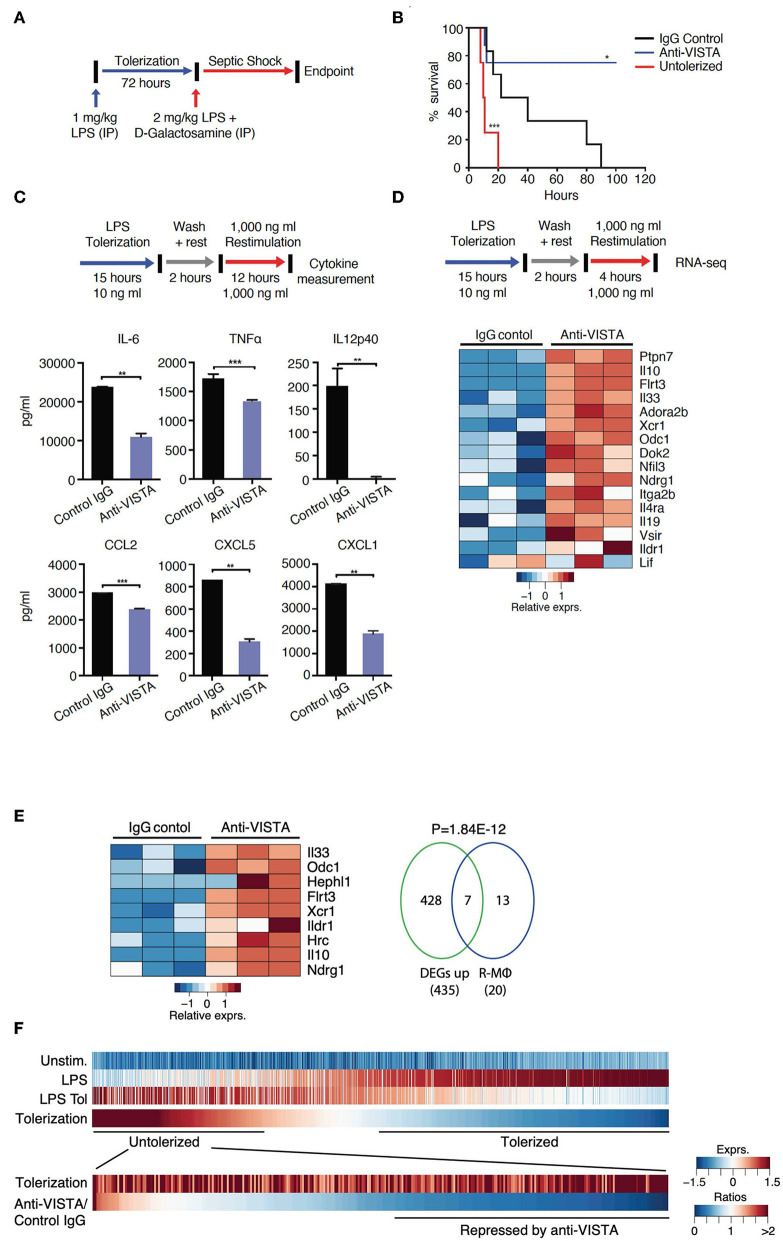
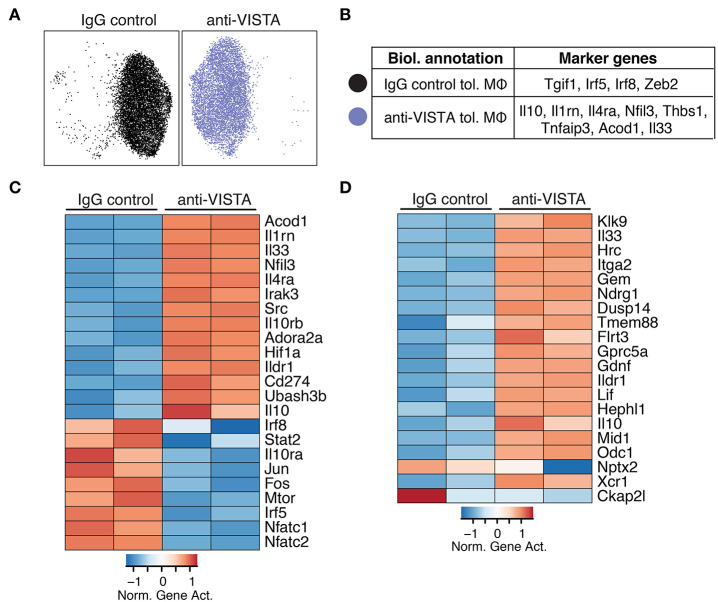
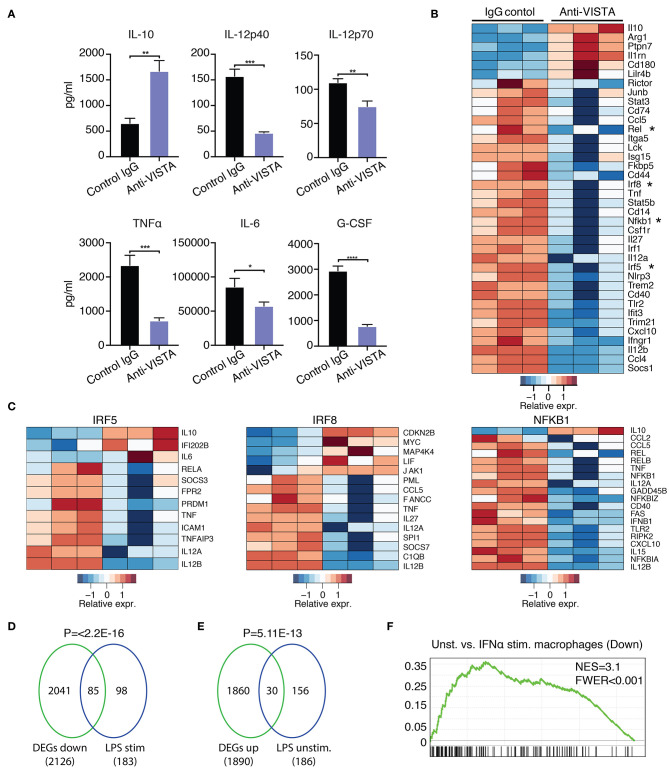
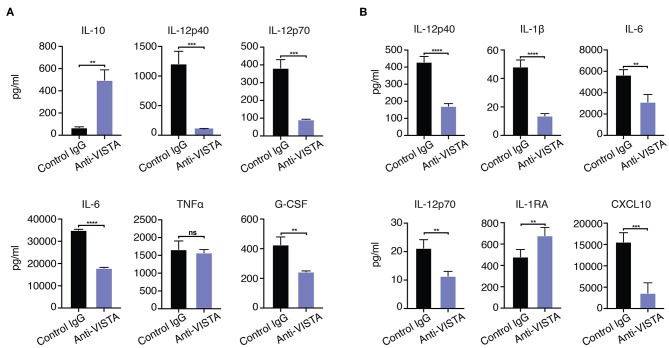
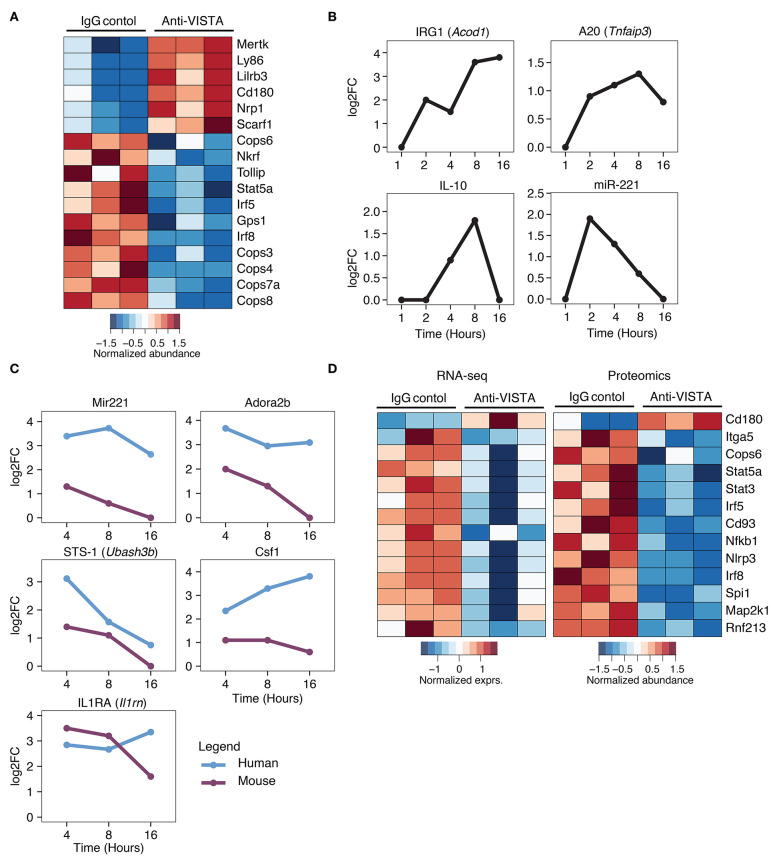
We present the novel finding that V-domain Ig suppressor of T cell activation (VISTA) negatively regulates innate inflammation through the transcriptional and epigenetic re-programming of macrophages. Representative of VISTA re-programming is the ability of VISTA agonistic antibodies to augment LPS tolerance and reduce septic shock lethality in mice. This anti-inflammatory effect of anti-VISTA was mimicked in vitro demonstrating that anti-VISTA treatment caused a significant reduction in LPS-induced IL-12p40, IL-6, CXCL2, and TNF; all hallmark pro-inflammatory mediators of endotoxin shock. Even under conditions that typically "break" LPS tolerance, VISTA agonists sustained a macrophage anti-inflammatory profile. Analysis of the proteomic and transcriptional changes imposed by anti-VISTA show that macrophage re-programming was mediated by a composite profile of mediators involved in both macrophage tolerance induction (IRG1, miR221, A20, IL-10) as well as transcription factors central to driving an anti-inflammatory profile (e.g., IRF5, IRF8, NFKB1). These findings underscore a novel and new activity of VISTA as a negative checkpoint regulator that induces both tolerance and anti-inflammatory programs in macrophages and controls the magnitude of innate inflammation in vivo.

Keywords: VISTA; agonist; immunosuppression; macrophage; tolerance.


Figures

Figure 1
Figure 1
VISTA targeting augments LPS tolerance in vivo and in vitro. (A) Anti-VISTA enhances LPS-induced tolerance in a model of LPS-induced septic shock. Mice were partially tolerized using 1 mg/kg LPS in the presence of anti-VISTA or control IgG for 72 h followed by the induction of septic shock using 2 mg/kg LPS + D-galactosamine and monitored for survival (top). (B) Survival of mice following treatment with control Ig, anti-VISTA or non-tolerized (n = 8/group in the antibody treatment and n = 4 for untolerized mice control). This experiment is a representative of 3 independent repeats with p-values calculated by log rank test (bottom). P-value of anti-VISTA treatment vs. Isotype IgG control treatment is 0.0194 whereas p-value of untolerized compared to antibody treatment is 0.0004 (C) Anti-VISTA enhances a tolerogenic profile in LPS-treated BMDMs in vitro. Anti-VISTA or control Ig-treated BMDMs (1 × 10⁶ cells/ml per well in a 6 well plate) were tolerized by treatment with 10 ng/ml LPS for 15 h, washed and rested for 2 h, then stimulated by 1 μg/ml LPS for 12 h. Luminex analysis was performed on supernatant. This data is representative of three independent repeats with three biological samples of pooled BMDMs. Each bar indicates the mean value, and each error bar refers to one standard deviation (SD). Student's t-tests were performed on anti-VISTA vs. Control IgG samples. (D) Differential gene expression in anti-VISTA treated LPS activated BMDMs. BMDMs were treated for 15 h with LPS and control Ig or anti-VISTA, rested for 2 h and restimulated with LPS (top). Heat map of RNA expression (RNA-seq) of selected differentially expressed genes from anti-VISTA vs. control IgG treated BMDMs after 4 h of restimulation with LPS following LPS tolerance (bottom). (E) Anti-VISTA induces a regulatory macrophage transcriptional profile. Comparison between Anti-VISTA treated tolerized BMDM profile vs. Regulatory BMDM previously reported (14). P-value calculated by hypergeometric test. These experiments are representative of three independent repeats with three biological samples per repeat. (F) Anti-VISTA expands the breadth of LPS tolerizable genes. Genes induced by LPS stimulation (“LPS”) compared to unstimulated (“Unstim.”) were identified and classified as non-tolerized (red) or tolerized by LPS pretreatment (blue) (“LPS Tol”) in BMDMs (as described in (C). The extend of tolerization was determined by the ratio of “LPS tol” and “LPS” (“Tolerized”). Genes non-tolerized by LPS were further evaluated for expression upon anti-VISTA treatment (“Anti-VISTA/Control IgG”). Statistical significance of *P ≤ 0.05, **P ≤ 0.01, ***P ≤ 0.001, whereas ****P ≤ 0.0001.
Figure 2
Figure 2
Anti-VISTA alters the epigenetic profile of tolerized BMDM. (A) Anti-VISTA alters the epigenetic steady state of tolerized BMDMs. UMAP plot of scATAC-seq on anti-VISTA agonist or IgG isotype control treated LPS-tolerized BMDMs 15 h after treatment with tolerizing LPS dose (10 ng/ml). Data is representative of ~10,000 cells from 2 independent biological samples per group. (B) Representative genes that define the clusters identified by scATAC-seq analysis presented in (A). (C) Anti-VISTA induces global changes in the epigenetic profile of tolerized BMDMs. Heatmap presenting global differences in gene activity between anti-VISTA vs. IgG control in LPS-tolerized BMDMs. (D) Anti-VISTA induced a regulatory macrophage profile. Comparison between Anti-VISTA treated tolerized BMDM profile vs. Regulatory BMDM previously reported (14). This data is representative of two independent repeats with two biological samples per group for each repeat.
Figure 3
Figure 3
Anti-VISTA induces LPS tolerance based on changes in cytokine production and transcriptional profile. (A) Pretreatment with anti-VISTA alters cytokine production by LPS-activated BMDMs. BMDMs were treated with anti-VISTA vs. Control IgG for 24 h then stimulated with 1 μg/ml LPS for 24 h and supernatant analyzed by mouse 32-plex. Bar graphs presents average cytokine levels from 4 biological samples of pooled BMDM. Each bar indicates the mean value, and each error bar refers to one standard deviation (SD). Student's t-tests were performed on anti-VISTA vs. Control IgG samples. (B) Pretreatment with anti-VISTA alters the transcriptional profile of LPS-activated BMDMs to a tolerized macrophage phenotype. Shown is a heatmap of RNA-seq analysis on anti-VISTA vs. Control IgG pretreated BMDMs after 4 h of acute stimulation with LPS (as in A). (C) Heat maps of TF target gene expression for IRF5, IRF8, and NFkB1 in BMDMs treated with anti-VISTA vs. Control IgG after 4 h of acute stimulation with LPS. (D) Enrichment analysis comparing the downregulated transcriptional profile of Anti-VISTA agonist and LPS stimulated macrophages to the well-defined profile induced upon LPS stimulation (48) and (E) enrichment analysis comparing the upregulated gene profile of Anti-VISTA and LPS stimulated macrophages to genes expressed in naïve unstimulated macrophages (48). Anti-VISTA downregulates genes induced by LPS and (E) enriches for genes expressed in naïve macrophages. P-value was calculated by a sample permutation test (GSEA). (F) Gene-set Enrichment analysis (GSEA) output of anti-VISTA and LPS treated macrophages compared to control treatment (IgG + LPS) indicating a significant enrichment of genes upregulated by unstimulated macrophages compared to IFN-a stimulated macrophages in genes upregulated in unstimulated macrophages in the anti-VISTA and LPS treated group. Anti-VISTA imposes a generalized anti-inflammatory profile in pretreated BMDMs. Cytokine measurement experiments are representative of four independent experiments with at least three biological samples per experiment. RNA-seq analysis is representative of two independent experiments with at least three biological sample per experiment. Statistical significance of *P ≤ 0.05, **P ≤ 0.01, ***P ≤ 0.001, ****P ≤ 0.0001.
Figure 4
Figure 4
(A) Anti-VISTA overrides IFN-γ reversal of LPS tolerance. BMDMs were treated with anti-VISTA vs Control followed by stimulation with LPS (100 ng/ml) and IFN-y (100 U/ml) and cytokines were measured by Luminex. This data is representative of three independent repeats with three biological samples of pooled BMDMs. Each bar indicates the mean value, and each error bar refers to one standard deviation (SD). Student's t-tests were performed on anti-VISTA vs Control IgG samples. (B) Anti-VISTA induces a tolerogenic cytokine profile in human monocyte-derived macrophages. Isolated monocytes were differentiated to macrophages for 6 days prior and treatment with anti-hVISTA or control Ig (hIgG2) for 24 h followed by LPS (1 μg/ml) stimulation. Supernatant analysis of cytokines from anti-VISTA or control pretreated human macrophages that were stimulated is shown. The data is representative of three independent repeats from 1 healthy donor per repeat. Statistical significance of *P ≤ 0.05, **P ≤ 0.01, ***P ≤ 0.001, ****P ≤ 0.0001.
Figure 5
Figure 5
Comparative analysis of anti-VISTA alterations in the proteome and transcriptome of human monocytes and mouse macrophages. (A) Anti-VISTA agonist induces a tolerogenic proteomic profile in BMDMs. Heatmap presenting quantified global proteomic changes in BMDMs treated with anti-VISTA agonist (803) for 30 min (details in Methods). Multiple sample test with FDR <0.05 revealed 1,581 proteins that were significantly changing between two study groups. Data is representative of compiled three biological independent repeats of pooled BMDMs (10 × 106 cells per sample). (B) Anti-VISTA induced changes in the transcriptional expression of genes involved with LPS-induced macrophage tolerance. Kinetics of mRNA expression of the genes Acod1, Tnfaip3, Il10, and miR-221 from a time-course assessment of anti-VISTA treatment of BMDMs at 1, 2, 4, 8, and 16 h by total RNA-seq. (C) Comparative analysis of anti-VISTA alterations in the transcriptional expression of miR-221, Adora2b, Ubash3b, Csf1, and Il1rn in human and mouse macrophages. The log2 fold change (log2FC) of differentially expressed genes comparing Anti-VISTA agonist and Control IgG-treated BMDM and monocyte derived human macrophage were compared. Kinetics of mRNA expression of the genes miR-221, Adora2b, Ubash3b, Csf1, and Il1rn upregulated by both mouse BMDMs and human monocytes after anti-VISTA treatment. (D) Anti-VISTA induces similar changes in gene expression when analyzed at both the transcriptional and proteomic levels. Heatmap presenting common genes differentially expressed after anti-VISTA treatment at both the proteomic level from the same dataset in (A) and by RNA-seq after LPS stimulation (from data presented in Figure 3).

Similar articles

Cited by

References

    1. Seeley JJ, Ghosh S. Molecular mechanisms of innate memory and tolerance to LPS. J Leukoc Biol. (2017) 101:107–19. 10.1189/jlb.3MR0316-118RR - DOI - PubMed
    1. Mosser DM. The many faces of macrophage activation. J Leukoc Biol. (2003) 73:209–12. 10.1189/jlb.0602325 - DOI - PubMed
    1. Van 'T Veer C, Van Den Pangaart PS, Van Zoelen MA, De Kruif M, Birjmohun RS, Stroes ES, et al. . Induction of IRAK-M is associated with lipopolysaccharide tolerance in a human endotoxemia model. J Immunol. (2007) 179:7110–20. 10.4049/jimmunol.179.10.7110 - DOI - PubMed
    1. Porta C, Rimoldi M, Raes G, Brys L, Ghezzi P, Di Liberto D, et al. . Tolerance and M2 (alternative) macrophage polarization are related processes orchestrated by p50 nuclear factor kappaB. Proc Natl Acad Sci USA. (2009) 106:14978–83. 10.1073/pnas.0809784106 - DOI - PMC - PubMed
    1. Rackov G, Hernandez-Jimenez E, Shokri R, Carmona-Rodriguez L, Manes S, Alvarez-Mon M, et al. . p21 mediates macrophage reprogramming through regulation of p50-p50 NF-kappaB and IFN-beta. J Clin Invest. (2016) 126:3089–103. 10.1172/JCI83404 - DOI - PMC - PubMed

Publication types

MeSH terms