. 2020 Oct 15:11:574881.
doi: 10.3389/fpls.2020.574881. eCollection 2020.

Auxin and Its Interaction With Ethylene Control Adventitious Root Formation and Development in Apple Rootstock

Affiliations

Auxin and Its Interaction With Ethylene Control Adventitious Root Formation and Development in Apple Rootstock

Tuanhui Bai et al. Front Plant Sci. .

Abstract

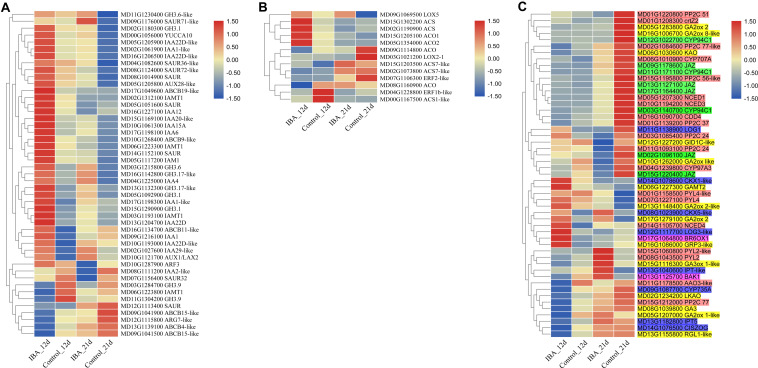
Adventitious root (AR) formation is indispensable for vegetative asexual propagation. Indole-3-butyric acid (IBA) functioned indirectly as precursor of IAA in regulating AR formation. Ethylene affects auxin synthesis, transport, and/or signaling processes. However, the interactions between auxin and ethylene that control AR formation in apple have not been elucidated. In this study, we investigated the effects of IBA and its interaction with ethylene on AR development in apple. The results revealed that IBA stimulated the formation of root primordia, increased the number of ARs, and upregulated expression of genes (MdWOX11, MdLBD16, and MdLBD29) involved in AR formation. Comparison of different periods of IBA application indicated that IBA was necessary for root primordium formation, while long time IBA treatment obviously inhibited root elongation. RNA-seq analysis revealed that many plant hormone metabolism and signal transduction related genes were differentially expressed. IBA stimulated the production of ethylene during AR formation. Auxin inhibiting ARs elongation depended on ethylene. Together, our results suggest that the inhibitory role of auxin on AR elongation in apples is partially mediated by stimulated ethylene production.

Keywords: adventitious root; apple rootstock 3/21; auxin; ethylene; indole-3-butyric acid.


Figures

FIGURE 1
FIGURE 1
IBA stimulated the AR formation of M9-T337 cuttings. (A) Morphological and (B) anatomical observations of AR formation in stem cuttings of M9-T337 cultivated in 1/2 MS medium without (Control) or with (IBA) 0.6 mg⋅L− 1 IBA. (C) Expression levels of the genes involved in AR formation in the base of stem cuttings of M9-T337 cultivated in 1/2 MS medium without (Control) or with (IBA) 0.6 mg⋅L− 1 IBA. The arrows in (B) indicated the AR primordium. Values represent the mean ± SE of three biological replicates. Bars with the different letters indicate a significantly difference between treatments for a same date according to Duncan test (at P < 0.05).
FIGURE 2
FIGURE 2
Effect of different periods of IBA application on AR development and growth. Morphology (A) and growth (B) of AR in stem cuttings of M9-T337 in the control, 1d IBA, 3d IBA, 5d IBA, 7d IBA, and 27d IBA groups. The control group is stem cuttings cultivated in 1/2 MS medium without IBA. 1d IBA, 3d IBA, 5d IBA, 7d IBA, and 27d IBA groups are stem cuttings cultivated in 1/2 MS medium with 0.6 mg⋅L− 1 IBA for 1, 3, 5, 7, or 27 days, and then transferred to1/2 MS medium without IBA. The photos in (A) were taken at the 27th day after treatment. Bars with the different letters indicate a significantly difference among treatments for a same stage according to Duncan test (at P < 0.05).
FIGURE 3
FIGURE 3
Effect of IBA on the AR cell elongation. Morphological (A) and anatomical structure (B) observations, (C) expression levels of the genes involved in cell cycle and elongation in the basal portion of the cutting including the elongated roots, and cell length (D) during AR growth and development in stem cuttings of M9-T337 of the control and 27d IBA groups. The control group is stem cuttings cultivated in 1/2 MS for the entire experiment. 27d IBA group is stem cuttings cultivated in 1/2 MS medium with 0.6 mg⋅L− 1 IBA for 27 days. The photos in (A) were taken at the 21st day after treatment. Bars with the different letters indicate a significantly difference between treatments for a same stage according to Duncan test (at P < 0.05). Scale bars in (A), 1 cm. Scale bars in (B), 500 μm.
FIGURE 4
FIGURE 4
Comparison of differentially expressed genes between the stem base including elongating adventitious roots of control and IBA groups at days 12 and 21. The IBA group is stem cuttings cultivated in 1/2 MS with 0.6 mg⋅L− 1 IBA for the entire experiment. The control group is stem cuttings cultivated in 1/2 MS medium with 0.6 mg⋅L− 1 IBA for 7 days, and then transferred to1/2 MS medium without IBA. Blue: upregulated genes; orange: downregulated genes.
FIGURE 5
FIGURE 5
GO enrichment analysis of DEGs between the stem base including elongating adventitious roots of control and IBA groups at days 12 and 21. GO enrichment analysis of all the DEGs between the root of control and IBA. The IBA group is stem cuttings cultivated in 1/2 MS with 0.6 mg⋅L− 1 IBA for the entire experiment. The control group is stem cuttings cultivated 1/2 MS medium with 0.6 mg⋅L− 1 IBA for 7 days, and then transferred to1/2 MS medium without IBA.
FIGURE 6
FIGURE 6
KEGG enrichment analysis of DEGs between the stem base including elongating adventitious roots of control and IBA groups at days 12 and 21. (A) KEGG enrichment analysis of DEGs between the control and IBA at 12 days. (B) KEGG enrichment analysis of DEGs between the control and IBA at 21 days. The IBA group is stem cuttings cultivated in 1/2 MS with 0.6 mg⋅L− 1 IBA for the entire experiment. The control group is stem cuttings cultivated in 1/2 MS medium with 0.6 mg⋅L− 1 IBA for 7 days, and then transferred to1/2 MS medium without IBA.
FIGURE 7
FIGURE 7
Heatmap of the plant hormone-related DEGs between the stem base including elongating adventitious roots of control and IBA groups at days 12 and 21. (A) Auxin. (B) Ethylene. (C) Other hormone. The IBA group is stem cuttings cultivated in 1/2 MS with 0.6 mg⋅L− 1 IBA for the entire experiment. The control group is stem cuttings cultivated 1/2 MS medium with 0.6 mg⋅L− 1 IBA for 7 days, and then transferred to1/2 MS medium without IBA. The FPKM value of the gene expressions from transcriptome is displayed in different colors. Red color means high expression and blue color means low expression.
FIGURE 8
FIGURE 8
Relationship between IBA, ethylene production, and AR development. (A) Ethylene production in the IBA treatment group and the control group. The IBA group is stem cuttings cultivated in 1/2 MS with 0.6 mg⋅L− 1 IBA for the entire experiment. The control group is stem cuttings cultivated 1/2 MS medium with 0.6 mg⋅L− 1 IBA for 7 days, and then transferred to1/2 MS medium without IBA. (B) Ethylene production of ACC and AgNO3 treatment. (C) Morphological observation of ACC and AgNO3 treatment. The photos were taken at the 21st day after treatment. Ethylene production was measured at the 21 days after treatment. Control: 1/2 MS medium; IBA: 1/2 MS medium with 0.6 mg⋅L− 1 IBA; IBA + ACC: 1/2 MS medium with 0.6 mg⋅L− 1 IBA and 3 mg⋅L− 1 ACC; IBA + AgNO3: 1/2 MS medium with 0.6 mg⋅L− 1 IBA and 3 mg⋅L− 1 AgNO3. Bars with the different letters indicate a significantly difference among treatments by Duncan test (at P < 0.05).
FIGURE 9
FIGURE 9
The expression levels of auxin- and ethylene-related genes during AR growth and development. The IBA group is stem cuttings cultivated in 1/2 MS with 0.6 mg⋅L− 1 IBA for the entire experiment. The control group is stem cuttings cultivated in 1/2 MS medium with 0.6 mg⋅L− 1 IBA for 7 days, and then transferred to1/2 MS medium without IBA. Values represent the mean ± SE of three biological replicates. Bars with the different letters indicate a significantly difference between treatments for a same stage according to Duncan test (at P < 0.05).
FIGURE 10
FIGURE 10
Tentative model of the regulation networks about auxin and interaction with ethylene during AR formation and development. Arrows and inhibition lines represent positive and negative interactions, respectively. The question mark indicates possible regulation mode.

References

    1. Ahkami A. H., Melzer M., Ghaffari M. R., Pollmann S., Ghorbani Javid M., Shahinnia F., et al. (2013). Distribution of indole-3-acetic acid in Petunia hybrida shoot tip cuttings and relationship between auxin transport, carbohydrate metabolism and adventitious root formation. Planta 238 499–517. 10.1007/s00425-013-1907-z - DOI - PMC - PubMed
    1. Aroonpong P., Chang J. (2015). Micropropagation of a difficult-to-root weeping mulberry (Morus alba var. Shidareguwa): a popular variety for ornamental purposes. Sci. Hortic. 194 320–326. 10.1016/j.scienta.2015.08.019 - DOI
    1. Atkinson C., Else M., Taylor L., Dover C. (2003). Root and stem hydraulic conductivity as determinants of growth potential in grafted trees of apple (Malus pumila Mill.). J. Exp. Bot. 54 1221–1229. 10.1093/jxb/erg132 - DOI - PubMed
    1. Atkinson J., Rasmussen A., Traini R., Voß U., Sturrock C., Mooney S., et al. (2014). Branching Out in Roots: uncovering form, function and regulation. Plant Physiol. 166 538–550. 10.1104/pp.114.245423 - DOI - PMC - PubMed
    1. Bai B., Bian H., Zeng Z., Hou N., Shi B., Wang J., et al. (2017). miR393-Mediated auxin signaling regulation is involved in root elongation inhibition in response to toxic aluminum stress in barley. Plant Cell Physiol. 58 426–439. - PubMed